OPEN-SOURCE SCRIPT
Updated COT-index range

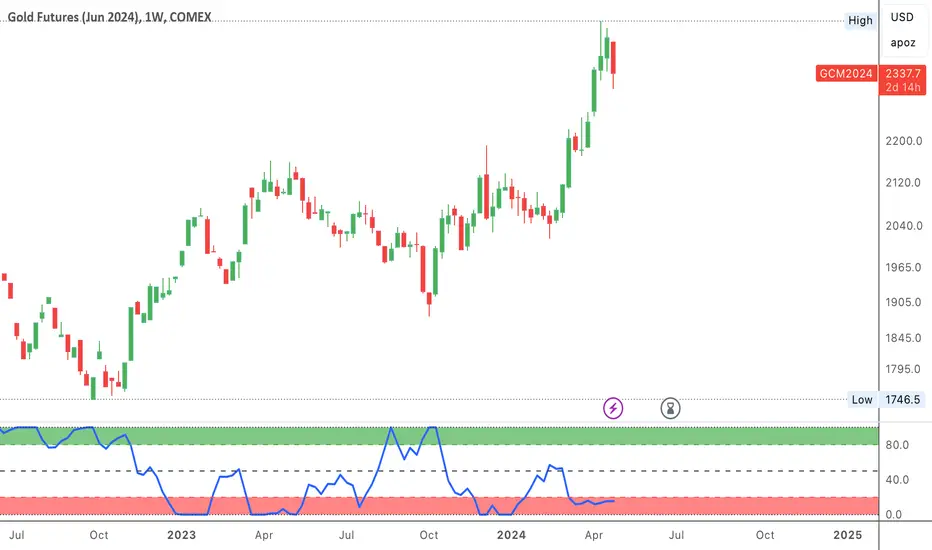
A graph showing the commercials (part of COT-data) positioning in relation to its own range, X periods back. I usually choose the look-back period to equal approximately one year. This will be around 52 on a weekly chart and 250 on a daily chart.
In my opinion a high data-point for the commercials is bullish and vice versa. But instead of only looking att absolute values I now look more at how the commercials are positioned compared to the previous 12 och 6 months.
Example:
a) if COT-index range = 0.8, then the commercials are in the 80th percentile for this specific look-back period, i.e. the commercials has only been more bullish 20% of the time and more bearish 80% of the time.
b) a) if COT-index range = 0.5, then the commercials are in the 50th percentile for this specific look-back period, i.e. the commercials has been more bullish 50% of the time and more bearish 50% of the time.
c) if COT-index range = 0.2, then the commercials are in the 20th percentile for this specific look-back period, i.e. the commercials has been more bullish 80% of the time and more bearish 20% of the time.
In other words, a high reading is bullish and a low reading is bearish.
Release Notes
Updated versionRelease Notes
*Updated*Script showing positioning as reported by the commitment of traders (COT) report, as before.
Whats updated:
1. COT Index
- The COT index shows the net commercial positioning, relative to its own range the last x periods. A high value (default: >80 in a 24 week period) indicates that the net commercials are accumulating long positions. <20 has the same interpretation, but for short positions.
The COT index can basically be interpreted as a percentile, where 100 is the longest, and 0 is the shortest, net positioning the commercials has had for the given period (default 24 weeks).
Release Notes
*Updated the default settings*- Note that most lines has to be unticked in order to properly display the COT Index.
Release Notes
*Updated defaults and visuals*- All COT data lines, not used to interpret the COT Index, are not displayed by default.
- Color opacity is lowered for the COT Index zones.
Open-source script
In true TradingView spirit, the creator of this script has made it open-source, so that traders can review and verify its functionality. Kudos to the author! While you can use it for free, remember that republishing the code is subject to our House Rules.
Disclaimer
The information and publications are not meant to be, and do not constitute, financial, investment, trading, or other types of advice or recommendations supplied or endorsed by TradingView. Read more in the Terms of Use.