Autoreg Trend Clouds [SS Premium]
About:
The autoregressive trend clouds operate on 2 major statistical concepts, as the name implies, the use of autoregression being the primary facet, as well as the use of an ANOVA statistical analysis of mean variance. I will elaborate on each of these below, but first will discuss the gist of what the indicator does.
The indicator plots the expected range based on an autogenerated autoregressed model of the stock. The indicator will train itself for lookback time and for modelling and will fit a model to whichever ticker, index, FOREX or crypto, etc. you are on.
These clouds represent the anticipated range for an instrument to fall in based on its current trend and its autoregressed relationship.
Below is an example with BTC on the 1 hour:
And QQQ on the 1 hour:
Autoregression:
The autoregression model uses an automatic trend identifier to identified the appropriate lookback length. It then generates two types of models, a lag 1 model (1 lag autoregression back) and a 3 lag model (using the last 3 lags, or candles, to create a model). It then compares which model is stronger and selects the best fit. It identifies this by looking at the R (correlation) of the models performance.
ANOVA:
ANOVA stands for Analysis of Variance. It is a statistical test commonly used in comparative analyses based research. What it does is it compares the statistical significance of the variance between a group of means. In this indicator, the ANOVA is uses 3 variables, the lagged high, lagged low and lagged close value over a 14 candle lookback period. In my observations, these settings have been very useful in identifying pivots and breakouts when a significant ANOVA is triggered.
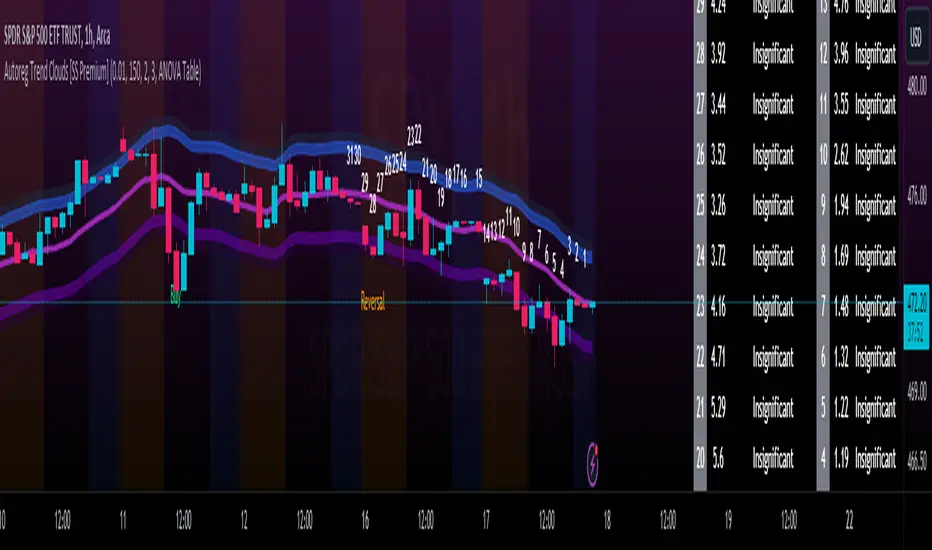
There are two ways to visualize this with this indicator. The first is by just looking at the chart. When a significant ANOVA results, the chart will display "Reversal" (see below):
Reversal is a bit of a misnomer, because it doesn't always mean that a "reversal" will happen, but that a big move is coming. In this case, the stock broke out to the upside.
How do you know which direction it will go? You can get an idea based on the position within the cloud, for example, when it is at the bottom of the range, reversal signals tend to mean it will go up:
But what it does more importantly is puts you on alert that something is about to happen, whether it is a pivot or a breakout/down.
ANOVA has also been applied to buy and sell signals that the indicator produces:
The indicator will look at the SMA of the ANOVA, as well as the position of the stock in relation to the autoregerssion model, and decide when to signal a sell or buy signal. Generally, the parameters are a significant ANOVA that is above its SMA and a move outside of the expected range.
There is another way to visualize the ANOVA using this indicator, and that is with the candle counting chart:
This will show you areas of significance over the last 31 candles, so you can identify precise areas of reversals in the most recent trading history. The table and candle numbers can be toggled off as well.
Significance Value:
And important note needs to be made about the significance value. ANOVA requires a "critical value", a value that must be met in order for something to be deemed "statistically significant". There are different levels of critical values for ANOVA based on the desired confidence. All this means is, how strict to you want your signals to be. The general recommendation for this indicator is this:
On any timeframe 4 hours or below, leave the critical value at 0.01.
On any timeframe above 4 hours, including the daily timeframe, use 0.05 or 0.10.
You can toggle these settings in the menu:
It also works really well on the larger timeframes:
QQQ 1D:
Uses & Tips:
This can be used as a standalone indicator or in combination with other indicators/strategies. I personally use this indicator frequently on the 1 hour and 5 minute timeframes to see where we are in relation to the anticipated range, and whether there is any significance on the ANOVA analysis.
Some tips for use:
- Works best on the 5 minute chart for intra-day trades.
- Works best on a ranging market on the shorter timeframes.
- Works great on the larger timeframes in all markets!
- Can be used on any instrument, be it Crypto, commodities, futures, indices etc..
And that is the indicator!
As always leave your questions and comments below.
For access, please follow the instructions below.
Safe trades everyone!
Invite-only script
Only users authorized by the author have access to this script, and this usually requires payment. You can add the script to your favorites, but you will only be able to use it after requesting permission and obtaining it from its author — learn more here. For more details, follow the author's instructions below or contact Steversteves directly.
TradingView does NOT recommend paying for or using a script unless you fully trust its author and understand how it works. You may also find free, open-source alternatives in our community scripts.
Author's instructions
Warning: please read our guide for invite-only scripts before requesting access.
Get:
- Live Updates,
- Discord access,
- Access to my Proprietary Merlin Software,
- Access to premium indicators,
patreon.com/steversteves
Disclaimer
Invite-only script
Only users authorized by the author have access to this script, and this usually requires payment. You can add the script to your favorites, but you will only be able to use it after requesting permission and obtaining it from its author — learn more here. For more details, follow the author's instructions below or contact Steversteves directly.
TradingView does NOT recommend paying for or using a script unless you fully trust its author and understand how it works. You may also find free, open-source alternatives in our community scripts.
Author's instructions
Warning: please read our guide for invite-only scripts before requesting access.
Get:
- Live Updates,
- Discord access,
- Access to my Proprietary Merlin Software,
- Access to premium indicators,
patreon.com/steversteves