INVITE-ONLY SCRIPT
Rubber Band
Updated
One indicator for ALL

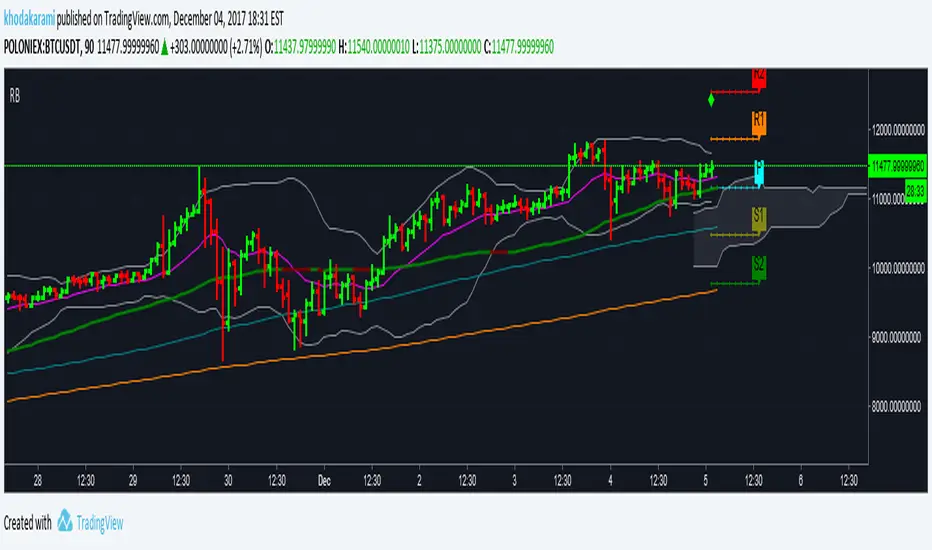
Bollinger Bands :
A well known system for defining volatility and Squeeze / expansion

Moving Averages :
SMA 50 (color coded based on direction) for showing the dynamic trend line
EMA 15 for showing local resistance / support lines
SMA 100 and 200 for showing higher time frame resistance/ support or dynamic trend lines

Ichimoko Cloud:
From all the Ichimoko indicator system, it's cloud is one of the best parts to show you the future possible resistance/support zones but it will occlude the chart, so, why not have the needed part?

Parabolic Sar :
One the good indicators to show the shift in the momentum and the power behind it, color coded for easier definition of bullish from bearish

Pivot Points :
One of the best indications for resistance / support levels, separated check mark to hide or show each line, up to 5 support and 5 resistance levels.

Automatic Fibonacci Retrace :
One check mark, and instead of Pivots, you will see the fibo levels to find possible retrace positions

Draw all if them and you will find one of the most complete yet robust indicators to be used will enough information in it. This script is fully customize-able, from the number of candles each time frame will look back to find fibo levels up to the parameters used for parabolic sar or bollinger bands.
For getting access to this script, all you need is to send 0.01 bitcoin (the amount should sit in the wallet after reduction of the fee) to the following address and contact me via pm and giving me the transaction information. I will give you the access as soon as that 0.01 Bit sits in the wallet. Also, the license is life time, so with paying once, you will get access to this indicator's updates (if any in the future) your whole life.
Here are some images from the input and style section :
prntscr.com/hj576f
prntscr.com/hj57j7
prntscr.com/hj57rh
prntscr.com/hj57w9
prntscr.com/hj582p
prntscr.com/hj5887
prntscr.com/hj58e4
prntscr.com/hj58iu
prntscr.com/hj58o0
prntscr.com/hj58sr
prntscr.com/hj58yn
I hope you enjoy using this indicator and win money ;)
Bitcoin Address to Buy this script :
1PB3TBm85JC6Y3jxifv3Y5i9p1pu2vbofi
Amount to buy the script
0.01 BTC
Bollinger Bands :
A well known system for defining volatility and Squeeze / expansion
Moving Averages :
SMA 50 (color coded based on direction) for showing the dynamic trend line
EMA 15 for showing local resistance / support lines
SMA 100 and 200 for showing higher time frame resistance/ support or dynamic trend lines
Ichimoko Cloud:
From all the Ichimoko indicator system, it's cloud is one of the best parts to show you the future possible resistance/support zones but it will occlude the chart, so, why not have the needed part?
Parabolic Sar :
One the good indicators to show the shift in the momentum and the power behind it, color coded for easier definition of bullish from bearish
Pivot Points :
One of the best indications for resistance / support levels, separated check mark to hide or show each line, up to 5 support and 5 resistance levels.
Automatic Fibonacci Retrace :
One check mark, and instead of Pivots, you will see the fibo levels to find possible retrace positions
Draw all if them and you will find one of the most complete yet robust indicators to be used will enough information in it. This script is fully customize-able, from the number of candles each time frame will look back to find fibo levels up to the parameters used for parabolic sar or bollinger bands.
For getting access to this script, all you need is to send 0.01 bitcoin (the amount should sit in the wallet after reduction of the fee) to the following address and contact me via pm and giving me the transaction information. I will give you the access as soon as that 0.01 Bit sits in the wallet. Also, the license is life time, so with paying once, you will get access to this indicator's updates (if any in the future) your whole life.
Here are some images from the input and style section :
prntscr.com/hj576f
prntscr.com/hj57j7
prntscr.com/hj57rh
prntscr.com/hj57w9
prntscr.com/hj582p
prntscr.com/hj5887
prntscr.com/hj58e4
prntscr.com/hj58iu
prntscr.com/hj58o0
prntscr.com/hj58sr
prntscr.com/hj58yn
I hope you enjoy using this indicator and win money ;)
Bitcoin Address to Buy this script :
1PB3TBm85JC6Y3jxifv3Y5i9p1pu2vbofi
Amount to buy the script
0.01 BTC
Release Notes
One indicator for ALL Bollinger Bands :
A well known system for defining volatility and Squeeze / expansion
Moving Averages :
SMA 50 (color coded based on direction) for showing the dynamic trend line
EMA 15 for showing local resistance / support lines
SMA 100 and 200 for showing higher time frame resistance/ support or dynamic trend lines
Ichimoko Cloud:
From all the Ichimoko indicator system, it's cloud is one of the best parts to show you the future possible resistance/support zones but it will occlude the chart, so, why not have the needed part?
Two Parabolic-Sar Sets:
One of the best indicators to show the shift in the momentum and the power behind it, color coded for easier definition of bullish from bearish
Pivot Points :
One of the best indications for resistance / support levels, separated check mark to hide or show each line, up to 5 support and 5 resistance levels.
Automatic Fibonacci Retrace :
One check mark, and instead of Pivots , you will see the fibo levels to find possible retrace positions
Draw all of them, and you will find one of the most complete yet robust indicators to be used with enough information in it. This script is fully customize-able, from the number of candles each time frame will look back to find fibo levels up to the parameters used for parabolic sar or bollinger bands .
For getting access to this script, all you need is to send 0.01 bitcoin (the amount should sit in the wallet after reduction of the fee) to the following address and contact me via pm and giving me the transaction information. I will give you the access as soon as that 0.01 Bit sits in the wallet. Also, the license is life time, so with paying once, you will get access to this indicator's updates (if any in the future) your whole life.
Here are some images from the input and style section :
prntscr.com/hj576f
prntscr.com/hj57j7
prntscr.com/hj57rh
prntscr.com/hj57w9
prntscr.com/hj582p
prntscr.com/hj5887
prntscr.com/hj58e4
prntscr.com/hj58iu
prntscr.com/hj58o0
prntscr.com/hj58sr
prntscr.com/hj58yn
I hope you enjoy using this indicator and win money ;)
Bitcoin Address to Buy this script :
1PB3TBm85JC6Y3jxifv3Y5i9p1pu2vbofi
Amount to buy the script
0.01 BTC
Update 16 Dec 2017:
- Added a second parabolic sar
- fixed the issue with pivots on higher time frames
Release Notes
Added Cloud Draw for Bollinger BandChanged the Bollinger's edge draw shape
Changed the default value for flat percentage
Release Notes
sacrificed the indicator of higher time frame direction indicator (the small little diamond on top right) for a much more useful indicator, williams fractals. Shame that when ever i want to add something to this useful indicator i have to drop something because of the limitation on number of plots possible by the scripting engine !Invite-only script
Access to this script is restricted to users authorized by the author and usually requires payment. You can add it to your favorites, but you will only be able to use it after requesting permission and obtaining it from its author. Contact CAB_Member for more information, or follow the author's instructions below.
TradingView does not suggest paying for a script and using it unless you 100% trust its author and understand how the script works. In many cases, you can find a good open-source alternative for free in our Community Scripts.
Want to use this script on a chart?
Warning: please read before requesting access.
Disclaimer
The information and publications are not meant to be, and do not constitute, financial, investment, trading, or other types of advice or recommendations supplied or endorsed by TradingView. Read more in the Terms of Use.