PROTECTED SOURCE SCRIPT
50, 100, 200 Moving Average
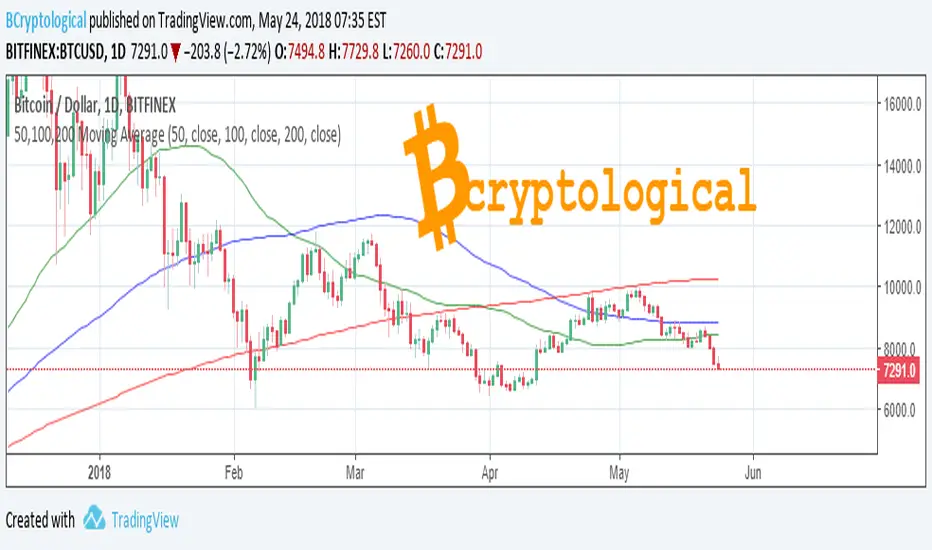
Free to use Moving Average indicator for 50, 100 and 200 days.
Smooths out the price across each period to reveal short, medium and long term trends and their relationship to each other. In principal, when the price is above a moving average the trend is up, when the price is below a moving average the trend is down.
When a short term MA crosses above a long term MA (a "golden cross") it is a strong buy signal. Conversely when a short term MA crosses below a long term MA (a "death cross") it is a strong sell signal.
Note that Moving Averages represent historical data and therefore are not strictly predictive in nature, but show trends that may be in action. Notably the 200 day MA will often be respected as support or resistance.
This tool is for educational purposes only and not a recommendation to buy or sell. Always do your own research before trading.
Best wishes,
BCryptological
Protected script
This script is published as closed-source. However, you can use it freely and without any limitations – learn more here.
Disclaimer
The information and publications are not meant to be, and do not constitute, financial, investment, trading, or other types of advice or recommendations supplied or endorsed by TradingView. Read more in the Terms of Use.