OPEN-SOURCE SCRIPT
Updated CV_VWAP_GME

Coefficient of variance GME ‰
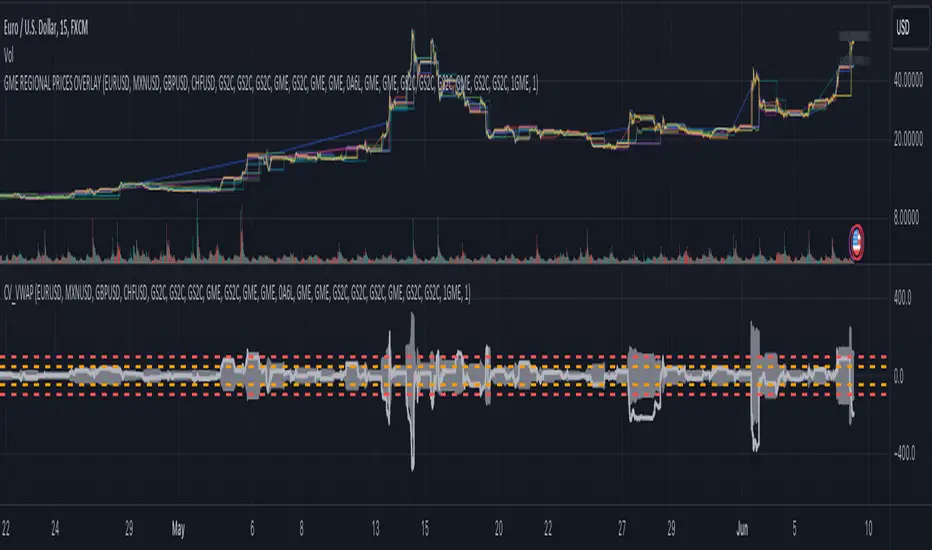
Gray area: Regional price variance of GME in per milles
Light gray thick line: NYSE:GME deviation from global mean
1. Select a chart 24-hour ticker like FX_IDC:USDEUR
2. Select a timescale (5 min, 15 min, ...)
3. Monitor the regional price variance
Exchanges included: NYSE, XETR, BMV, FWB, SWB, BITTREX, FTX
Currency conversion: Forex
Adapted from Detecting the great short squeeze on Volkswagen, Godfrey, K. (2016, February 18).
Release Notes
version=5Coefficient of variation GME ‰
Gray area: Regional price variance of GME
Light gray thick line: NYSE:GME deviation from global mean
1. Select a chart 24-hour ticker like FX_IDC:USDEUR
2. Select a timescale (5 min, 15 min, ...)
3. Monitor the regional price variance
Exchanges included: NYSE, XETR, BMV, FWB, SWB, MUN, PYTH, LSIN,
CAPITALCOM (CFD), BIVA, BER, HAM, DUS, VIE,
BX, TRADEGATE, MIL
Currency conversion: Forex
Adapted from Detecting the great short squeeze on Volkswagen
sciencedirect.com/science/article/pii/S0927538X16300075
Release Notes
Coefficient of variation GME ‰Gray area: Regional price variance of GME
Light gray thick line: NYSE:GME deviation from global mean
1. Select a chart 24-hour ticker like FX_IDC:USDEUR
2. Select a timescale (5 min, 15 min, ...)
3. Monitor the regional price variance
Exchanges included: NYSE, XETR, BMV, FWB, SWB, MUN, PYTH, LSIN,
CAPITALCOM (CFD), BIVA, BER, HAM, DUS, VIE,
BX, TRADEGATE, MIL
Currency conversion: Forex
Adapted from Detecting the great short squeeze on Volkswagen
sciencedirect.com/science/article/pii/S0927538X16300075
Open-source script
In true TradingView spirit, the creator of this script has made it open-source, so that traders can review and verify its functionality. Kudos to the author! While you can use it for free, remember that republishing the code is subject to our House Rules.
Disclaimer
The information and publications are not meant to be, and do not constitute, financial, investment, trading, or other types of advice or recommendations supplied or endorsed by TradingView. Read more in the Terms of Use.