INVITE-ONLY SCRIPT
360D_TradersStream
Updated

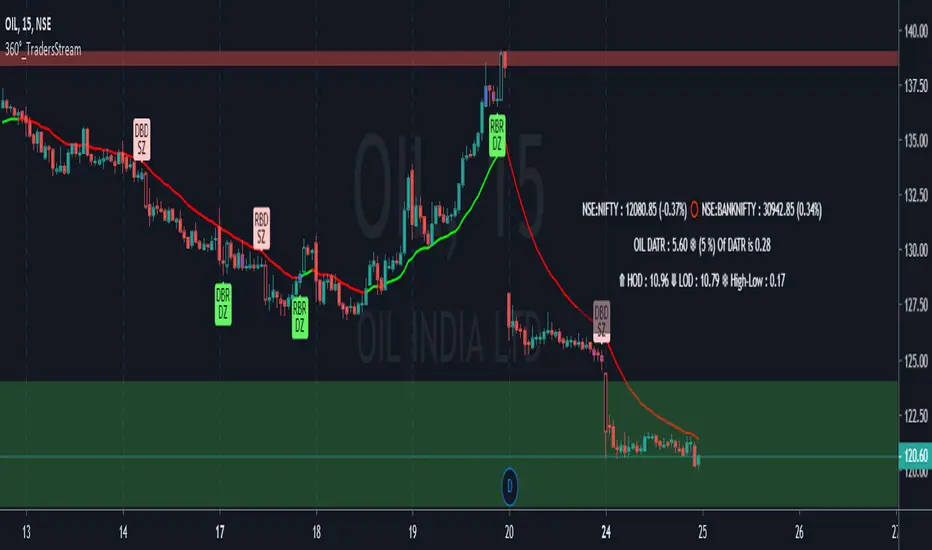
This is a Ultimate Tool for Trading. This tool includes
1. MA = In that you will find EMA & SMA
2. MA Length = It's Length of MA
3. Explosive Leg-out Strength = It's Explosive Candles Strength
4. RBR Pattern = Up to 6 Bases and you can minimize Base Qty.
5. DBD Pattern, DBR Pattern & RBD Pattern as we mentioned above
6. Curve Time Frame = Choose this thing so, tool can know what is your curve accordingly this it will judge your ITF & LTF
7. High of the Curve & Low of the Curve = Please enter manually the no.'s of your Upper curve & lower curve. and when changing chart don't forget make it "0"
8. Trend @ ITF = Choose your Trend. (Please choose your Trend from your ITF Time frame, to get better results)
9. Intraday Risk in % & Swing Risk in % = Calculates as per DATR
10. 1st Symbol & 2nd Symbol = To have other stocks price in your chart.
11. Tick for White Label & Un-tick for Black Label
12. Explosive Candle & Basing Candle = Tick to view Explosive & Boring candle in zone formations & Untick hide the indication
13. And finally you can change Labels Size as per your requirement,
Release Notes
More Simplification in Menu by merging Explosive & Boring Candle Tabs, Specified Moving Averages for Accuracy and Small changes in Label.Release Notes
Some Minor Updates done.Invite-only script
Access to this script is restricted to users authorized by the author and usually requires payment. You can add it to your favorites, but you will only be able to use it after requesting permission and obtaining it from its author. Contact mohsinsait3 for more information, or follow the author's instructions below.
TradingView does not suggest paying for a script and using it unless you 100% trust its author and understand how the script works. In many cases, you can find a good open-source alternative for free in our Community Scripts.
Want to use this script on a chart?
Warning: please read before requesting access.
Disclaimer
The information and publications are not meant to be, and do not constitute, financial, investment, trading, or other types of advice or recommendations supplied or endorsed by TradingView. Read more in the Terms of Use.