PROTECTED SOURCE SCRIPT
Updated Trend Reversal Alert Hybrid [T.R.A.H]
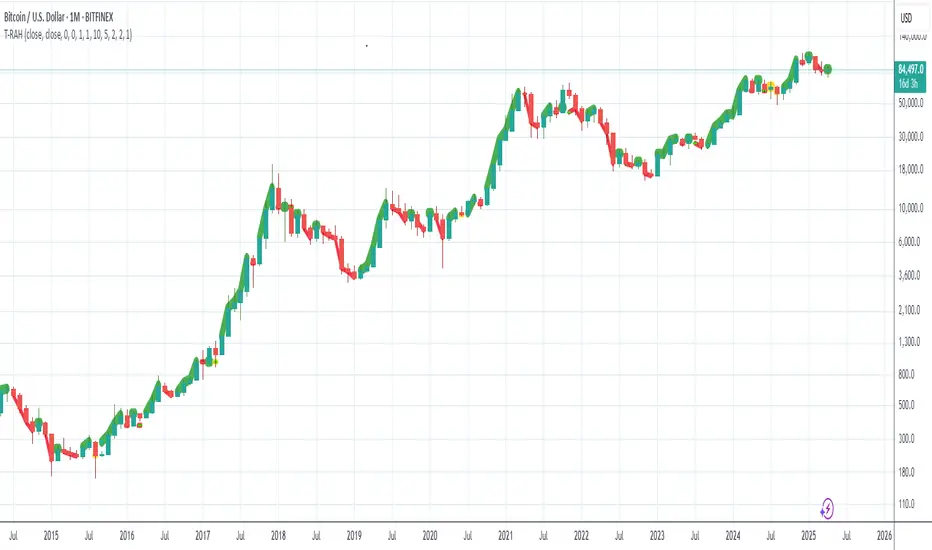
This is extention of a hybrid of AlPos-Trend-Highlighter with Peaks and Bottoms Detector from All Time Fibo Channel.
It is a visualizer of Reversal Points and Trend Lines for the series of a T-R.A.S strategies that are available in my scripts.
* Note : I ended up frustrated, I must say, because when I run my strategy it works perfect, but when I add this visualizer and turn it into strategy for some reason that is beyond of my understanding of pinescript, results are different. I tried everything I could, but in the end decided to make two separately working scripts that one is an indicator and the other one is a strategy. And it's working that way WTH!?!?!? for some reason in SPX lime and aqua lines showed displaced from candles, but when you use it on crypto seems working perfect. Might be a difference in data.. Anyway, please test and comment.
Release Notes
Updating logic to be as most close to T-R.A.S[lite] as I canRelease Notes
Version update from 2nd to 6th.Protected script
This script is published as closed-source. However, you can use it freely and without any limitations – learn more here.
Disclaimer
The information and publications are not meant to be, and do not constitute, financial, investment, trading, or other types of advice or recommendations supplied or endorsed by TradingView. Read more in the Terms of Use.
Protected script
This script is published as closed-source. However, you can use it freely and without any limitations – learn more here.
Disclaimer
The information and publications are not meant to be, and do not constitute, financial, investment, trading, or other types of advice or recommendations supplied or endorsed by TradingView. Read more in the Terms of Use.