OPEN-SOURCE SCRIPT
UpVol/TVol NYSE Lowry Upside Days
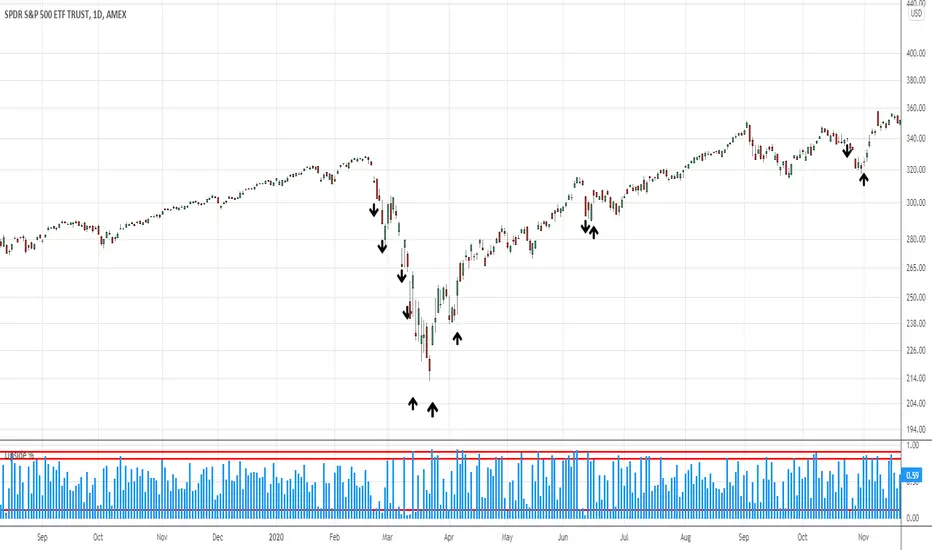
Takes Tradingviews Upside Volume for NYSE and divides it by Total Volume on NYSE.
Tradingview's data source generally has different volume figures than say the Wall Street Journal. Therefore, this indicator is an estimate.
10% upside volume shows extreme panic and is consistent with market sell offs.
90% upside days, following a decline, are often occur within a week or so of significant market bottoms.
Recommend using columns as the plot type.
Based on research of LowryResearch Corp.
Open-source script
In true TradingView spirit, the creator of this script has made it open-source, so that traders can review and verify its functionality. Kudos to the author! While you can use it for free, remember that republishing the code is subject to our House Rules.
Cory Mitchell, CMT
Stock and forex trading insights at tradethatswing.com/
Stock and forex trading insights at tradethatswing.com/
Disclaimer
The information and publications are not meant to be, and do not constitute, financial, investment, trading, or other types of advice or recommendations supplied or endorsed by TradingView. Read more in the Terms of Use.