Liberty Scanner

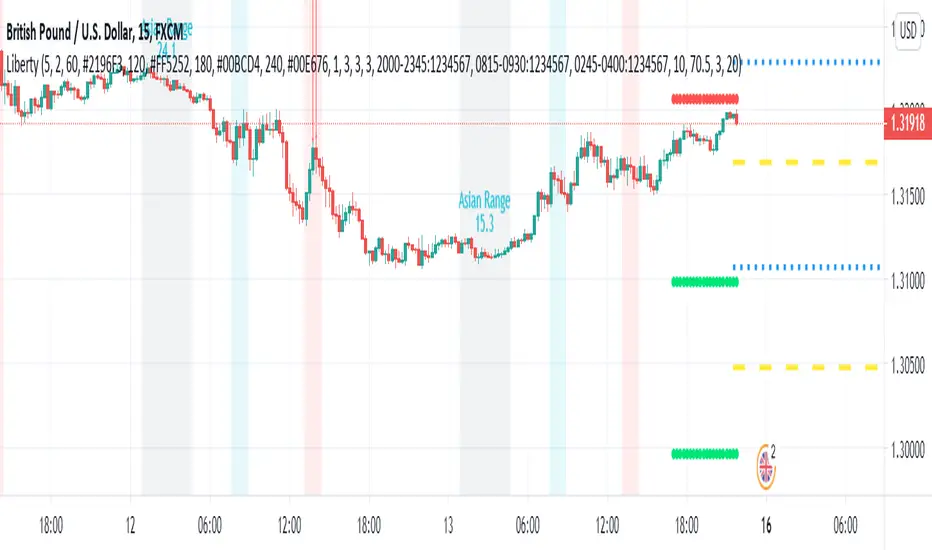
The indicator also detects killzones, which are basically supply and demand zones. We like to think of these as areas of which banks are placing their orders.
The indicator also gives you the Asian range and how many pips the market has moved for the Asian range, that is what determines whether we are in normal market conditions or not.
We also made it to where you can see yesterdays highs and lows, when you understand the market directions then you typically know which swing (high or low) will be broken.
The indicator also has an ADR (Average Day Range) feature where it calculates the "average" amount of pips the market moves per day based on the previous 3-10 days of the market volatility.
The main thing which gives us signal for entry is the New York session Fibonacci levels in which it automatically scans for the nearest 15 minute swing and it'll give you an entry based off of that.
*This indicator in no way is meant to be 100% accurate, please do your own analysis before placing any trades and trade with proper risk, as this market is extremely volatile and risky. Past profits don't guarantee future results*
FOR ACCESS: Please send us a private message to gain access to this indicator.
Invite-only script
Only users approved by the author can access this script. You'll need to request and get permission to use it. This is typically granted after payment. For more details, follow the author's instructions below or contact NoRiskFX directly.
TradingView does NOT recommend paying for or using a script unless you fully trust its author and understand how it works. You may also find free, open-source alternatives in our community scripts.
Author's instructions
Warning: please read our guide for invite-only scripts before requesting access.
Disclaimer
Invite-only script
Only users approved by the author can access this script. You'll need to request and get permission to use it. This is typically granted after payment. For more details, follow the author's instructions below or contact NoRiskFX directly.
TradingView does NOT recommend paying for or using a script unless you fully trust its author and understand how it works. You may also find free, open-source alternatives in our community scripts.
Author's instructions
Warning: please read our guide for invite-only scripts before requesting access.