PROTECTED SOURCE SCRIPT
Updated JamesCart's Feigenbaum Constant/Rate Of Change indicator
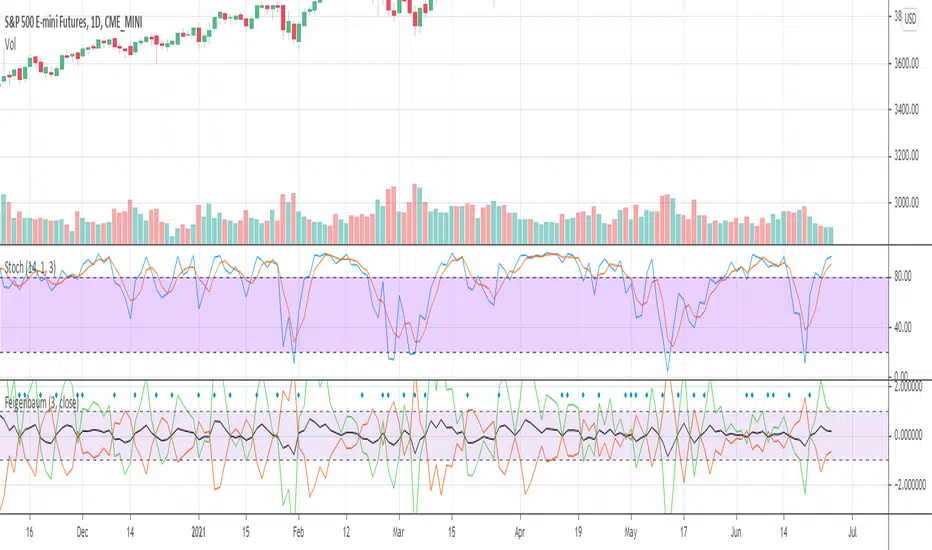
This is an indicator that compares the rate of change as a proportion to the Feigenbaum Constant (The black line). The green line is a positive divergence from the rate of change, the red is a negative divergence from the rate of change. When the Red line is on top and the green line is on the bottom, then that is a bearish trend. When the Green is on top and the red is on bottom, that is a bullish trend. The black line also helps indicate a general bullish or bearish trend based on how it moves.
When the lines "open up" that means a trend is beginning, when the lines close that means the trend is ending. This indicator is a powerful leading indicator and needs sensitive eyes. Every small movement needs to be given consideration.
When the lines "open up" that means a trend is beginning, when the lines close that means the trend is ending. This indicator is a powerful leading indicator and needs sensitive eyes. Every small movement needs to be given consideration.
Release Notes
added resolution gaps to fix issues with custom timeframes. Release Notes
added an area between 1 and -1 to make it easier to visually find large deviations from market noise.Protected script
This script is published as closed-source. However, you can use it freely and without any limitations – learn more here.
Disclaimer
The information and publications are not meant to be, and do not constitute, financial, investment, trading, or other types of advice or recommendations supplied or endorsed by TradingView. Read more in the Terms of Use.
Protected script
This script is published as closed-source. However, you can use it freely and without any limitations – learn more here.
Disclaimer
The information and publications are not meant to be, and do not constitute, financial, investment, trading, or other types of advice or recommendations supplied or endorsed by TradingView. Read more in the Terms of Use.