Hoffman A/D BreakoutStudy based on Rob Hoffman's Accumulation/Distribution Breakout strategy.
- Green circle on the top wick indicates a "Distribution" wick
- Red circle on the bottom wick indicates an "Accumulation" wick
- A distribution wick in an uptrend gets marked as a Key Resistance. This is marked with green crosses
- An Accumulation wick in a downtrend gets marked as a Key Support. This is marked with red crosses
- Breaking above the Key Resistance indicates a buy entry. This is marked by a green background.
- Breaking below the Key Support indicates a sell entry. This is marked by a red background
Accumulation

Williams Accumulation/Distribution (Williams AD) Strategy Accumulation is a term used to describe a market controlled by buyers;
whereas distribution is defined by a market controlled by sellers.
Williams recommends trading this indicator based on divergences:
Distribution of the security is indicated when the security is making
a new high and the A/D indicator is failing to make a new high. Sell.
Accumulation of the security is indicated when the security is making
a new low and the A/D indicator is failing to make a new low. Buy.
WARNING:
- This script to change bars colors.


Bollinger Bands V2 [Super Trend]################################## Anglais ######################################
With the News Bollinger Bands V2 , you can choose the source of the color (Color with Price or Color with the Super Trend ATR).
You can also view the Super Trend on the chart and the configure.
this allows you to quickly identify trends and the acceleration phase and accumulation
Sorry for my basic English
//J.Dow
################################## Français ######################################
Avec les Nouvelles Bollinger Bands V2 , vous pouvez choisir la source de la couleur ( couleur avec le prix ou la couleur avec le Super Tendance ATR ) .
Vous pouvez aussi consulter le Super Tendance sur le graphique et le configure.
cela vous permet d'identifier rapidement les tendances et la phase d'accélération et d'accumulation
//J.Dow


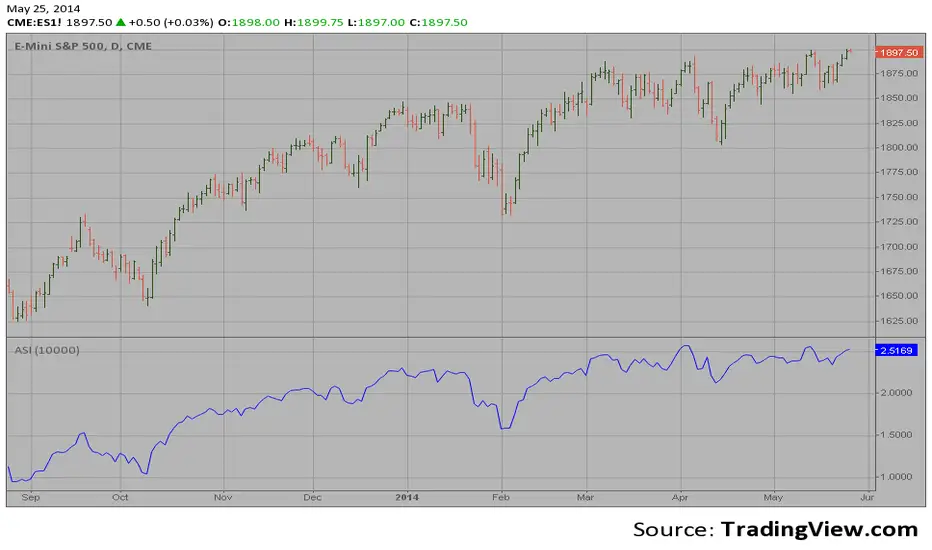
Accumulation Swing Index The Accumulation Swing Index is a cumulative total of the Swing Index.
The Accumulation Swing Index was developed by Welles Wilder.
The SwingIndex function was developed to help cut through the maze of
Open, High, Low and Close prices to indicate the real strength and direction
of the market. The Swing Index function looks at the Open, High, Low and
Close values for a two-bar period. The theory is that there are four cross-bar
and one intra-bar comparisons that are strong indicators of an up or down day.
The Swing Index returns a number between -100 and 100. If the factors point toward
an up day, then the function value will be positive and vice versa. In this way,
the Swing Index gives us definite short-term swing points, and it can be used to
supplement other methods as a breakout indicator. A breakout is indicated when the
value of the Accumulation Swing Index (ASI) exceeds the ASI value on the day when a
previous significant High Swing Point was made. A downside breakout is indicated when
the value of the ASI drops below the ASI value on a day when a previous significant
low swing point was made.
Since only futures have a relative daily limit value, this function only makes sense
when applied to a futures contract. If you use this function and it only plots a zero
flat line, check the Daily Limit value.
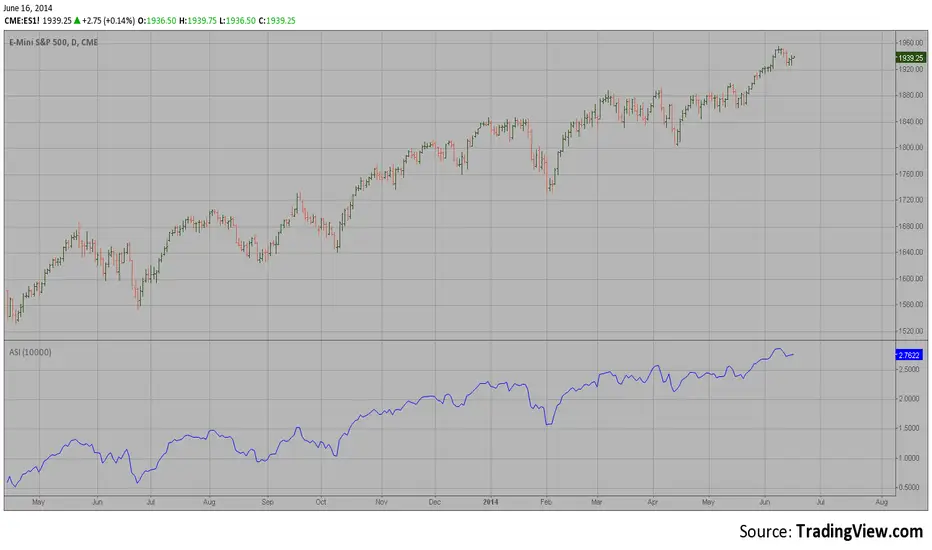
Accumulation Swing Index (ASI) The Accumulation Swing Index is a cumulative total of the Swing Index.
The Accumulation Swing Index was developed by Welles Wilder.
The SwingIndex function was developed to help cut through the maze of
Open, High, Low and Close prices to indicate the real strength and direction
of the market. The Swing Index function looks at the Open, High, Low and
Close values for a two-bar period. The theory is that there are four cross-bar
and one intra-bar comparisons that are strong indicators of an up or down day.
The Swing Index returns a number between -100 and 100. If the factors point toward
an up day, then the function value will be positive and vice versa. In this way,
the Swing Index gives us definite short-term swing points, and it can be used to
supplement other methods as a breakout indicator. A breakout is indicated when the
value of the Accumulation Swing Index (ASI) exceeds the ASI value on the day when a
previous significant High Swing Point was made. A downside breakout is indicated when
the value of the ASI drops below the ASI value on a day when a previous significant
low swing point was made.
Since only futures have a relative daily limit value, this function only makes sense
when applied to a futures contract. If you use this function and it only plots a zero
flat line, check the Daily Limit value.