Fibonacci Pivot Points & Previous D,W&M Highs/LowsIndicator Overview
This indicator combines Fibonacci Pivot Points with previous high and low levels for different timeframes (day, week, month). It plots these levels on the chart to provide traders with key support and resistance areas, making it easier to identify potential trading opportunities.
Features
Fibonacci Pivot Points:
The indicator calculates pivot points based on the high, low, and close prices.
Fibonacci levels are used to determine support (S1, S2, S3, S4, S5) and resistance (R1, R2, R3, R4, R5) levels.
Users can customize the Fibonacci levels for both support and resistance.
Previous Highs and Lows:
The indicator plots previous day, week, and month high and low levels.
Each of these lines can be customized in terms of visibility, color, and width.
This helps traders to see key historical levels that might act as support or resistance in the future.
Inputs and Customization:
Fibonacci Time Frame:
Users can select the timeframe for calculating the pivot points (Daily, Weekly, Monthly).
Fibonacci Levels:
Customizable input fields for each Fibonacci level (R1, R2, R3, R4, R5, S1, S2, S3, S4, S5).
Previous High/Low Lines:
Day Lines:
Options to show or hide previous day's high/low lines.
Customizable color and width for these lines.
Week Lines:
Options to show or hide previous week's high/low lines.
Customizable color and width for these lines.
Month Lines:
Options to show or hide previous month's high/low lines.
Customizable color and width for these lines.
Technical Calculations:
Fibonacci Pivot Points:
Calculated as:
pp = (High + Low + Close) / 3
S1 = pp - ((High - Low) * Fibonacci Level)
R1 = pp + ((High - Low) * Fibonacci Level)
Previous High/Low Levels:
Uses request.security to fetch previous high and low values for the selected timeframe.
Plotted using line.new to draw lines across the chart.
Plotting:
The indicator plots Fibonacci Pivot Points and previous high/low lines on the chart, using distinct colors for each level.
Customizable transparency and linewidths make it easier to visually interpret the levels.
This indicator is particularly useful for traders who rely on technical analysis to identify key support and resistance levels, offering a blend of historical data and Fibonacci-based predictions.
Feel free to ask if you have any specific questions or need further adjustments!
AND

LDO Support and Resistance with Trend LinesUnderstanding the Indicator on Your Chart
Support Lines (Green): These horizontal lines represent price levels where LDO is likely to find buying interest, preventing further declines. They turn a semi-transparent green when the price is above them and blue when below.
Resistance Lines (Blue): These horizontal lines indicate price levels where selling pressure may halt upward movements. They turn a semi-transparent blue when the price is below them and green when above.
Trend Lines (Blue for Resistance, Green for Support): Diagonal lines show the overall trend direction. Blue trend lines indicate resistance (price may struggle to rise above), and green trend lines indicate support (price may find a floor).
Pivots: Small triangles appear above or below candles to mark pivot highs (resistance) and pivot lows (support), helping you identify key turning points.
Customizing the Indicator
You can tweak the indicator’s behavior through the settings panel. Here’s what each input does:
Show Trend Lines? (Default: True)
Enables or disables the display of trend lines on the chart. Set to false to hide trend lines if you only want support/resistance levels.
Choose Higher Time Frame
Select a higher timeframe (e.g., 1H, 4H, 1D) to display support and resistance levels from that timeframe on your current chart (e.g., 5M or 15M).
Pivot Length Settings (Current and Higher Timeframe):
Pivot Length Left Hand Side (Current/HTF): Adjusts how many bars to the left the indicator looks to identify pivot lows (default: 15 for current, 20 for HTF).
Pivot Length Right Hand Side (Current/HTF): Adjusts how many bars to the right the indicator looks to identify pivot highs (default: 10 for current, 15 for HTF).
Increase these values for fewer, more significant pivots; decrease for more frequent pivots.
Pivot Sources (Trend 1 and Trend 2 Pivots):
Select the price source (e.g., low, high) for calculating pivot lows and highs. Default is low for pivot lows and high for pivot highs.
Line Width Settings:
Lower Time Frame Line Width (Default: 5): Sets the thickness of support/resistance lines on the current timeframe.
Higher Time Frame Line Width (Default: 18): Sets the thickness of support/resistance lines on the higher timeframe.
Show Support & Resistance? (Default: True)
Enables or disables the display of horizontal support and resistance lines. Set to false to hide them if you only want trend lines.
Alert Settings (Under “Alerts” Group):
Enable Trend Line Alerts? (Default: True): Turns alerts on or off for trend line hits.
Alert on Resistance Trend Lines? (Default: True): Enables alerts when the price hits resistance trend lines.
Alert on Support Trend Lines? (Default: True): Enables alerts when the price hits support trend lines.
Alert Message: Customize the alert message format (default: “Price hit trend line at {0}”, where {0} is replaced by the price).
Setting Up Alerts
Enable Alerts in the Indicator:
In the indicator settings, ensure “Enable Trend Line Alerts?” is set to true, and choose whether to alert on resistance or support trend lines.
Create a TradingView Alert:
Click the “Alerts” button (bell icon) at the top of the chart.
Select “Create Alert” and choose this indicator from the “Condition” dropdown.
Set the alert frequency (e.g., once per bar, only once), notification method (e.g., email, popup), and save the alert.
Test the Alerts:
Monthly Buy IndicatorIt shows us the the total balance when buying monthly, ploting the total invested amount and total current balance along the time.
Opening the Data Window, it displays the profit (%) and the number of trades.
The "Allow Fractional Purchase" flag can be used to check the the performance of the ticker, disregarding how much the monthly amount is set vs the price of the ticker.
The trades are considering buying the available amount on the 1st candle of each month, at the Open price. The "Total Balance" considers the close price of each candle.

Support and Resistancelookback: This input allows you to specify the number of bars to look back to calculate the support and resistance levels.
support: This is calculated as the lowest low over the specified lookback period.
resistance: This is calculated as the highest high over the specified lookback period.
plot: The support and resistance levels are plotted on the chart with different colors.
bgcolor: This optional feature highlights the support and resistance zones with a semi-transparent background color.

Phase Cross Strategy with Zone### Introduction to the Strategy
Welcome to the **Phase Cross Strategy with Zone and EMA Analysis**. This strategy is designed to help traders identify potential buy and sell opportunities based on the crossover of smoothed oscillators (referred to as "phases") and exponential moving averages (EMAs). By combining these two methods, the strategy offers a versatile tool for both trend-following and short-term trading setups.
### Key Features
1. **Phase Cross Signals**:
- The strategy uses two smoothed oscillators:
- **Leading Phase**: A simple moving average (SMA) with an upward offset.
- **Lagging Phase**: An exponential moving average (EMA) with a downward offset.
- Buy and sell signals are generated when these phases cross over or under each other, visually represented on the chart with green (buy) and red (sell) labels.
2. **Phase Zone Visualization**:
- The area between the two phases is filled with a green or red zone, indicating bullish or bearish conditions:
- Green zone: Leading phase is above the lagging phase (potential uptrend).
- Red zone: Leading phase is below the lagging phase (potential downtrend).
3. **EMA Analysis**:
- Includes five commonly used EMAs (13, 26, 50, 100, and 200) for additional trend analysis.
- Crossovers of the EMA 13 and EMA 26 act as secondary buy/sell signals to confirm or enhance the phase-based signals.
4. **Customizable Parameters**:
- You can adjust the smoothing length, source (price data), and offset to fine-tune the strategy for your preferred trading style.
### What to Pay Attention To
1. **Phases and Zones**:
- Use the green/red phase zone as an overall trend guide.
- Avoid taking trades when the phases are too close or choppy, as it may indicate a ranging market.
2. **EMA Trends**:
- Align your trades with the longer-term trend shown by the EMAs. For example:
- In an uptrend (price above EMA 50 or EMA 200), prioritize buy signals.
- In a downtrend (price below EMA 50 or EMA 200), prioritize sell signals.
3. **Signal Confirmation**:
- Consider combining phase cross signals with EMA crossovers for higher-confidence trades.
- Look for confluence between the phase signals and EMA trends.
4. **Risk Management**:
- Always set stop-loss and take-profit levels to manage risk.
- Use the phase and EMA zones to estimate potential support/resistance areas for exits.
5. **Whipsaws and False Signals**:
- Be cautious in low-volatility or sideways markets, as the strategy may generate false signals.
- Use additional indicators or filters to avoid entering trades during unclear market conditions.
### How to Use
1. Add the strategy to your chart in TradingView.
2. Adjust the input settings (e.g., smoothing length, offsets) to suit your trading preferences.
3. Enable the strategy tester to evaluate its performance on historical data.
4. Combine the signals with your own analysis and risk management plan for best results.
This strategy is a versatile tool, but like any trading method, it requires proper understanding and discretion. Always backtest thoroughly and trade with discipline. Let me know if you need further assistance or adjustments to the strategy!

Liquitive Buy/Sell Dollar AveragerLiquitive Buy/Sell Dollar Averager Indicator
The "Liquitive Buy/Sell Dollar Averager" is a versatile trading tool designed for intraday and multi-timeframe analysis, combining advanced range-bound calculations, RSI normalization, volume spikes, and candle pattern recognition to identify optimal buy and sell conditions. This indicator is particularly suitable for traders employing strategies that focus on dollar-cost averaging, position scaling, and systematic buy/sell decision-making.
Key Features:
Adaptive RSI-Based Levels:
Dynamically calculates inner bounds (IB) and outer bounds (OB) using RSI and price ranges, helping to identify overbought and oversold conditions relative to the price action.
Normalizes RSI values to the price range for seamless visualization overlaid on the chart.
Volume and Candle Analysis:
Detects significant volume spikes relative to a moving average, signaling increased market activity.
Identifies spiking green/red candles to capture momentum-driven price movements.
Dynamic Support and Resistance:
Calculates and plots support and resistance levels based on recent swing highs and lows.
Median and boundary lines help visualize key price levels for decision-making.
Profitability Check:
Buy and Sell Signals:
Checks profitability thresholds based on percentage gains/losses.
Incorporates logic for "time to buy" and "time to sell" using target profit margins.
Implements average move percentage to define realistic thresholds for buy/sell actions.
Time-Based Trading Restrictions:
Configures trading logic to disallow trades after a specific time (e.g., 3:40 PM for intraday sessions).
Ensures logical entry and exit decisions are only made within active trading hours.
Color-Coded Visualization:
Background colors dynamically shift between green (bullish), red (bearish), and neutral, depending on RSI and price position relative to the inner bounds.
Opacity of the background adjusts based on normalized RSI differences to provide a visual cue of market strength.
Customizable Parameters:
Allows user input for key settings like lookback periods, RSI length, percent ranges, volume thresholds, and transparency levels, enabling flexible configuration tailored to individual strategies.
Actionable Alerts and Signals:
Plots "Open Position", "Add to Position", and "Close Position" markers directly on the chart, making it easy to follow systematic trading rules.
How It Works:
Buy Signals:
Triggered when price conditions, volume spikes, and RSI-based thresholds align with profitability metrics.
Designed for dollar-cost averaging, identifying opportunities to add to long positions or open new positions.
Sell Signals:
Evaluates profitability conditions to identify when to close or scale out of positions.
Incorporates real-time evaluation of market momentum and profitability.

Support & Resistance AI LevelScopeSupport & Resistance AI LevelScope
Support & Resistance AI LevelScope is an advanced, AI-driven tool that automatically detects and highlights key support and resistance levels on your chart. This indicator leverages smart algorithms to pinpoint the most impactful levels, providing traders with a precise, real-time view of critical price boundaries. Save time and enhance your trading edge with effortless, intelligent support and resistance identification.
Key Features:
AI-Powered Level Detection: The LevelScope algorithm continuously analyzes price action, dynamically plotting support and resistance levels based on recent highs and lows across your chosen timeframe.
Sensitivity Control: Customize the sensitivity to display either major levels for a macro view or more frequent levels for detailed intraday analysis. Easily adjust to suit any trading style or market condition.
Level Strength Differentiation: Instantly recognize the strength of each level with visual cues based on how often price has touched each one. Stronger levels are emphasized, highlighting areas with higher significance, while weaker levels are marked subtly.
Customizable Visuals: Tailor the look of your chart with customizable color schemes and line thickness options for strong and weak levels, ensuring clear visibility without clutter.
Proximity Alerts: Receive alerts when price approaches key support or resistance, giving you a heads-up for potential market reactions and trading opportunities.
Who It’s For:
Whether you're a day trader, swing trader, or just want a quick, AI-driven way to identify high-probability levels on your chart, Support & Resistance AI LevelScope is designed to keep you focused and informed. This indicator is the perfect addition to any trader’s toolkit, empowering you to make more confident, data-backed trading decisions with ease.
Upgrade your analysis with AI-powered support and resistance—no more manual lines, only smart levels!

Key Levels SetKey Levels Set allows to set key levels as comma separated values, and to detect breaks to the downside and/or upside, taking into account potential gaps between bars.
This indicator can be very handy if you, like me, rely on some key levels that you identified as potential support/resistance from some technical analysis.
Features
+ It allows for key levels to be set as comma separated values.
+ It draws key levels on chart.
+ On close, it identifies highest key level that has been broken to the upside, if any.
+ On close, it identifies lowest key level that has been broken to the downside, if any.
+ In Cross mode, as bar is printing, it also detects highest/lowest key levels being broken to the upside/downside between bar high and low, if any.
+ It plots and labels breaks with current level and next level information.
+ It includes alerts from breaks on close.
+ It includes turn on/off functionality.
Settings
+ {Prices} checkbox: turns on/off entire functionality
+ {Prices} text field: comma separated values for key levels
+ {Breaks on} checkbox: turns on/off breaks detection functionality
+ {Breaks on} options: selects Close or Cross mode

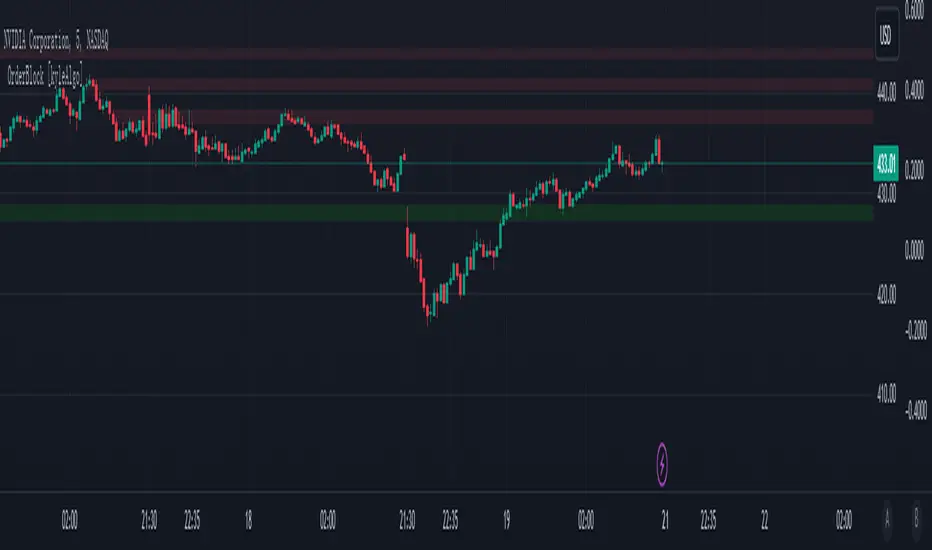
OrderBlock [kyleAlgo]The principle of this indicator
ATR (Average True Range) Setting: The code uses ATR to help calculate the Supertrend indicator.
Supertrend Trend Direction: Identify bullish and bearish trends with the Supertrend method.
Order Block Recognition: This part of the code recognizes and creates order blocks, visualizing them as boxes on the chart. If the number of blocks exceeds the maximum limit, old blocks will be deleted.
Function to prevent overlapping: check whether the new order block overlaps with the existing order block through the isOverlapping function.
Order block color setting: The code sets the color according to whether the block is bullish or bearish, and whether it breaks above or below. Afterwards the color of the existing order blocks will be updated.
Sensitivity settings: Through the input settings of factor and atrPeriod, the sensitivity of Supertrend and the detection of order blocks can be affected.
Visualization: Use TradingView's box.new function to draw and visualize order blocks on the chart.
Practicality:
Support and Resistance Levels: Order blocks may represent areas of support and resistance in the market. By visualizing these areas, traders can better understand when price reversals are likely to occur.
Trading Signals: Traders may be able to identify trading signals based on the color changes of blocks and price breakouts. For example, if the price breaks above a bullish block, this could be a signal to buy.
Risk Management: By using ATR to adjust the sensitivity of Supertrend, the symbol helps traders to adjust their strategies according to market volatility. This can be used as a risk management tool to help identify stop loss and take profit points.
Multi-timeframe analysis: Although the code itself does not implement multi-timeframe analysis directly, it can be done by applying this indicator on different timeframes. This helps to analyze the market from different angles.
Flexibility and Customization: Through sensitivity settings, traders can customize the indicator according to their needs and trading style.
Reduced screen clutter: By removing overlapping order blocks and limiting the maximum number of order blocks, this code helps reduce clutter on charts, allowing traders to analyze the market more clearly.
Overall, this "Pine Script" can be a powerful analytical tool for trend traders and those looking to improve their trading decisions by visualizing key market areas. It can be used alone or combined with other indicators and trading systems for enhanced functionality.
Support and Resistance Backtester [SS]Hey everyone,
Excited to release this indicator I have been working on.
I conceptualized it as an idea a while ago and had to nail down the execution part of it. I think I got it to where I am happy with it, so let me tell you about it!
What it does?
This provides the user with the ability to quantify support and resistance levels. There are plenty of back-test strategies for RSI, stochastics, MFI, any type of technical based indicator. However, in terms of day traders and many swing traders, many of the day traders I know personally do not use or rely on things like RSI, stochastics or MFI. They actually just play the support and resistance levels without attention to anything else. However, there are no tools available to these people who want to, in a way, objectively test their identified support and resistance levels.
For me personally, I use support and resistance levels that are mathematically calculated and I am always curious to see which levels:
a) Have the most touches,
b) Have provided the most support,
c) Have provided the most resistance; and,
d) Are most effective as support/resistance.
And, well, this indicator answers all four of those questions for you! It also attempts to provide some way to support and resistance traders to quantify their levels and back-test the reliability and efficacy of those levels.
How to use:
So this indicator provides a lot of functionality and I think its important to break it down part by part. We can do this as we go over the explanation of how to use it. Here is the step by step guide of how to use it, which will also provide you an opportunity to see the options and functionality.
Step 1: Input your support and resistance levels:
When we open up the settings menu, we will see the section called "Support and Resistance Levels". Here, you have the ability to input up to 5 support and resistance levels. If you have less, no problem, simply leave the S/R level as 0 and the indicator will automatically omit this from the chart and data inclusion.
Step 2: Identify your threshold value:
The threshold parameter extends the range of your support and resistance level by a desired amount. The value you input here should be the value in which you would likely stop out of your position. So, if you are willing to let the stock travel $1 past your support and resistance level, input $1 into this variable. This will extend the range for the assessment and permit the stock to travel +/- your threshold amount before it counts it as a fail or pass.
Step 3: Select your source:
The source will tell the indicator what you want to assess. If you want to assess close, it will look at where the ticker closes in relation to your support and resistance levels. If you want to see how the highs and lows behave around the S/R levels, then change the source to High or Low.
It is recommended to leave at close for optimal results and reliability however.
Step 4: Determine your lookback length:
The lookback length will be the number of candles you want the indicator to lookback to assess the support and resistance level. This is key to get your backtest results.
The recommendation is on timeframes 1 hour or less, to look back 300 candles.
On the daily, 500 candles is recommended.
Step 5: Plot your levels
You will see you have various plot settings available to you. The default settings are to plot your support and resistance levels with labels. This will look as follows:
This will plot your basic support and resistance levels for you, so you do not have to manually plot them.
However, if you want to extend the plotted support and resistance level to visually match your threshold values, you can select the "Plot Threshold Limits" option. This will extend your support and resistance areas to match the designated threshold limits.
In this case on MSFT, I have the threshold limit set at $1. When I select "Plot Threshold Limits", this is the result:
Plotting Passes and Fails:
You will notice at the bottom of the settings menu is an option to plot passes and plot fails. This will identify, via a label overlaid on the chart, where the support and resistance failures and passes resulted. I recommend only selecting one at a time as the screen can get kind of crowded with both on. here is an example on the MSFT chart:
And on the larger timeframe:
The chart
The chart displays all of the results and counts of your support and resistance results. Some things to pay attention to use the chart are:
a) The general success rate as support vs resistance
Rationale: Support levels may act as resistance more often than they do support or vice versa. Let's take a look at MSFT as an example:
The chart above shows the 334.07 level has acted as very strong support. It has been successful as support almost 82% of the time. However, as resistance, it has only been successful 33% of the time. So we could say that 334 is a strong key support level and an area we would be comfortable longing at.
b) The number of touches:
Above you will see the number of touches pointed out by the blue arrow.
Rationale: The number of touches differs from support and resistance. It counts how many times and how frequently a ticker approaches your support and/or resistance area and the duration of time spent in that area. Whereas support and resistance is determined by a candle being either above or below a s/r area, then approaching that area and then either failing or bouncing up/down, the number of touches simply assesses the time spent (in candles) around a support or resistance level. This is key to help you identify if a level has frequent touches/consolidation vs other levels and can help you filter out s/r levels that may not have a lot of touches or are infrequently touched.
Closing comments:
So this is pretty much the indicator in a nutshell. Hopefully you find it helpful and useful and enjoy it.
As always let me know your questions/comments and suggestions below.
As always I appreciate all of you who check out, try out and read about my indicators and ideas. I wish you all the safest trades and good luck!

Manual PnL (Profit and Loss) % Tracker - spot long only
This is a manual profit and loss tracker. It takes the user's manual input of total cost and quantity, and then outputs a table on the bottom right of the chart showing the profit or loss %, average purchase price, gross profit or loss, and market value.
Instructions:
1. Double click the indicator title at the top left of the chart
2. Select the "Inputs" tab and click the empty field next to "Symbol" to enter the traded symbol+exchange. This entry MUST be the same as the chart you are on, for example BTCUSDT/BINANCE (indicator will not display otherwise)
3. Enter the Total Cost and Qty of shares/coins owned
4. Optional - change positive or negative colors
5. Optional - under the "Style" tab, change the color of the average price (AVG) line
Note that for the average price (AVG) line to be shown/hidden you must enable/disable "Indicator and financials labels" in the scales settings.
For crypto or other tickers that have prices in many decimal places I would suggest, for the sake of accuracy, adjusting the decimal places in the code so that for prices under $1 you will display more info.
For example let's say you purchase x number of crypto at a price of 0.031558 you should change the code displaying "0.00" on line 44 to "0.000000"
This will ensure that the output table and plotted line will calculate an average price with the same number of decimals.

Fibonacci Ratios with Volatility(Weekly Time Frame.)Script is based on weekly time Frame. Fib ratios are drawn at the Open of the Market. Open price is compared with Previous week High , low and close. If weekly open is above Previous week high or low, Fib 0 % is plotted above High or the low as the case may be . If weekly open is between previous week high and low Fib 0% is equal to previous week Close and other fib ratios are plotted accordingly. As its vol based, works fantastically. This script is inspired by Fibonacci and Volatility script by PB GHOSH.

PharshK RSI and Zigzag with H/LIt is with RSI level
and Zigzag Pattern that Market goes on Maximum level and Lower Level
And it is also Showing High and Law Level of last Moving Candle so it is easy to entry and Hold

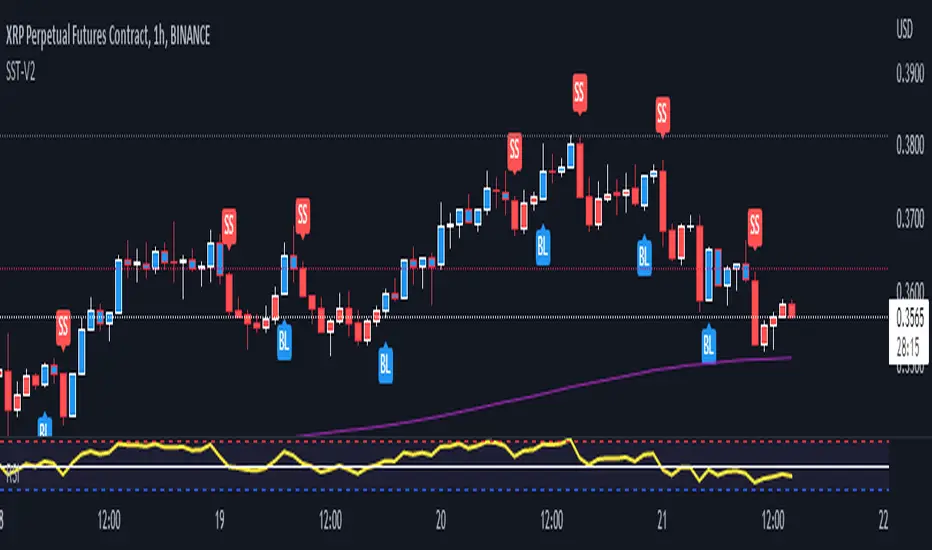
SST-V2this scrips is combination of Moving average that you can alter with buy and Sell signal.
it is easy to use. u can go with the trend as of the bar color turn to blue it is indcate tha ur in bullish trend
and with turn to red it indicate that your in down trend.
Use Ema 200 for trend confluences
hope you like it.
thank's
Sadflute
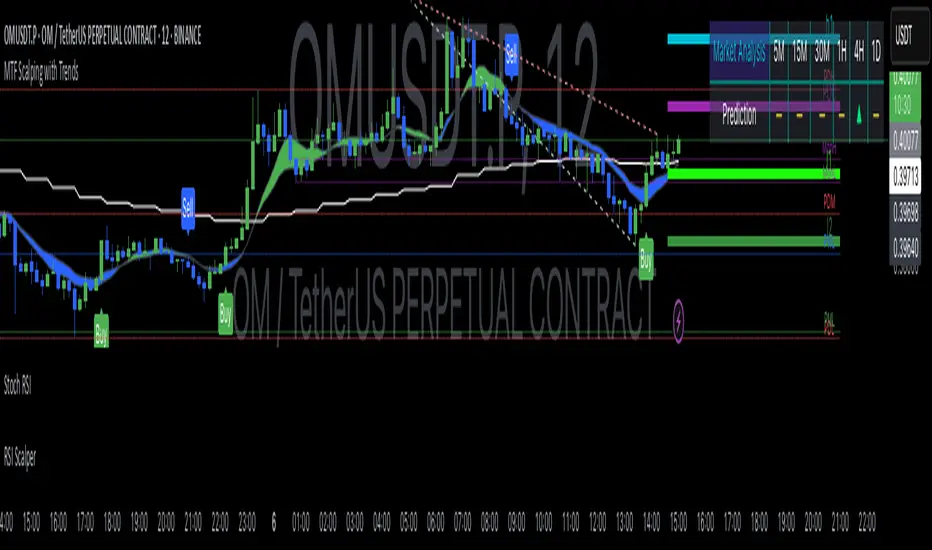
Lune Market Analysis Premium- Version 0.9 -
Lune Algo was developed and built by Lune Trading, utilizing years of their trading expertise. This indicator works on all stocks, cryptos, indices, forex, futures , currencies, ETF's, energy and commodities. All the tools and features you need to assist you on your trading journey. Best of all, Lune Algo is easy to use and many of our tools and strategies have been thoroughly backtested thousands of times to ensure that users have the best experience possible.
Overview
Trade Dashboard—Provides information about the current market conditions, Such as if the market is trending up or down, how much volatility is in the market and even displays information about the current signal.
Trade Statistics—This tool gives you a breakdown of the Statistics of the current selected strategy based on backtests. It tells you the percentage of how often a Take Profit or Stop Loss was hit within a specific time period. Risk and Trade management is very important in trading, and can be the difference between a winning and losing strategy. So we believe that this was mandatory.
Current Features:
Advanced Buy and Sell Signals
Exclusive built-in Strategies
Lune Confidence AI
EK Clouds
Reversal Bands
Vray (Volume Ray)
Divergence Signals
Reversal Signals
Support/Resistance Zones
Built-in Themes
Built-in Risk Management system (take profit/stop loss)
Trade Statistics
Trade Assistance
Trade Dashboard
Advanced Settings
+ More coming soon, Big plans!
Features Breakdown:
Lune Confirmation—Used to help you confirm your trades and trend direction. It uses unique calculations, and its settings can be adjusted to allow traders to adapt the settings to fit their trading style.
Lune Confidence AI—All strategies are equipped with our exclusive built-in Confidence AI. This feature tells you how much confluence there is in a trade. It uses a rating system where signals are given a number from 0 to 5. A rating of 0 indicates that there is not a lot of confluence or confidence in the signal, while a rating of 5 indicates that there is a lot of confidence in the trade. This feature is not perfect and will be improved overtime.
Support/Resistance Zones—Calculates the most important support/resistance levels based on how many times a level has been used as support or resistance. Traders also refer to these as supply and demand zones and key levels.
EK Clouds—Used to further help you confirm trend and was optimized to also be used as support and resistance. This feature is powered by custom moving averages.
Reversal Bands—An optimized and improved version of the infamous Bollinger Bands. When price action takes place within the Reversal Bands it usually indicates that the current symbol is overextended and a reversal is possible.
Vray—Also Known as "Volume Ray", Assists you in better visualizing volume. This helps you find key levels and areas of support that you wouldn't be able to see otherwise. It helps you trade like the institutions.
This indicator's signals DO NOT REPAINT.
If you are using this script you acknowledge past performance is not necessarily indicative of future results and there are many more factors that go into being a profitable trader.

MTF High and Low FractionsMTF High and Low Fractions
Description
An experimental script that prints 1/3, 1/4 and 1/8 levels of the previous timeframe's high and low to the current timeframe. The idea is quite simple. It mirrors the the previous high and low with user selected levels. The default setting is the previous daily high and low but can be customized on user discretion.
New levels are printed after the close of the previous timeframe and open of the new timeframe (user's timeframe setting).
How To Use
Levels should not be used blindly. Levels can be used as confluence when aligned with high probability supply and demand zones, support, resistance, order blocks, and so on.

Support & Resistance[VTA]Description:
This indicator uses pivot points to draw support and resistance for you in different timeframes.
It also shows you the decrease in the increase of the currency compared to the resistance and support line, and you can see the end of the failures by the label.
Manufacturer:
This indicator was designed and developed by the VTA team.

Directional ExpectancyThe Directional Expectancy tool is a volatility based indicator, It is a Directional Correlation to the Volatility given by the Historical Volatility Percentile.
We calculate this correlation function then visually color plot it across a moving average of the HVP.
Use this tool to not only gauge the Historical Volatility that is present as well as the Directional Expectancy of the volatility and price!

ProWaves - [Soldi]ProWaves
Introducing the latest and greatest tool in the DynaPro Trading Tools! ProWaves is a multi timeframe precision trend tool to help traders identify the waves of the market and trade the convergence, exhaustion points, continuation points of multiple timeframes.
By default you will have a 15m, 1h and 2h Wave on your indicator - this is completely customizable by the user! You can choose up to 3 higher timeframes to display the underlaying wave trend.
How Do I Enter Trades?
To bring ProWaves into a full trading system someone could easily use we have to make a trade trigger system for potential entries - an original and unique Trend Bar system to easily signal a trader that there is an entry present. These trend bars use 2 sensitive weighted moving averages based off the HL2 of the candle, we offset them to create a ribbon like effect to help eliminate any false signals
Include this in your own trading strategy or compile it with DynaPro's other institutional caliber tools!
To use ProWaves effectively you will want to understand wave theory first
This indicator is based off the idea of Elliot wave and fractal cycles of the market, to really understand what this indicator is reading you will need to understand what Elliot Wave is along with fractal cycles in the markets.
What Are The Waves Based On
The waves are primarily a Correlation function to make an oscillated value of "trend", by doing so and measuring this across multiple timeframes we are able to gain a sense of clarity on the tops and bottoms of the markets as well as the trends that take place in between!
NOTE
When the Waves are above/below - 0.5/-0.5 then the wave is in an area of significance for either a reversal or to influence a trend - couple this with the precision of the Trend Bars system then you have a great trading system!

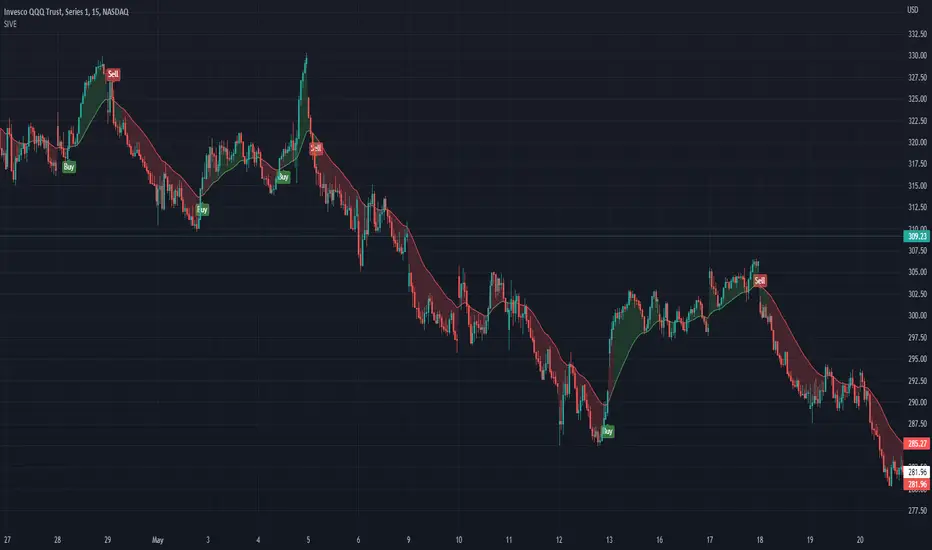
SIVE 2.0 - [Soldi]SIVE 2.0 IS FINALLY HERE, after the long awaited update we are finally able to bring to you SIVE 2.0!
SIVE 1.0 (Systematic Institutional Volatility Expansion) brought a whole new approach to the algorithm and retail trading game on TradingView. Never before have you had access to a quantitative institutional approach like this, after years in development and testing we finally brought SIVE 1.0 to market. With very very high demand, support and so much positive feedback we knew that what we've created really hit the mark for so many traders!
What is SIVE?
SIVE as stated above stands for, Systematic Institutional Volatility Expansion. What this means is we have a highly effective system that reads what institutional algorithms are proven to be looking at. While only providing alerts during periods where Volatility is Expanding
We don't shy away from volatility here, that is where the bread and butter lays. volatility is a double edged sword that not many people know how to effectively use to their advantage. Simply put, because they are told in their retail trading that volatility is risky, and that you should stay away from volatile products. I say embrace it with the right tools.
What Has Changed?
At the core, SIVE 2.0 brings more efficient calculations to the volatility modelling as well as the triggering of trades!
Trend Scalper - This is a sub-set strategy we have included, what it measures is 'Super Trend' with a deviation of 7 and the MTI ribbon crosses. This is to be used as a way to scalp and trade the momentum of the market. I am aware that another brand/community has put this out as a paid feature to their algorithm. Since they didn't want to credit me for my contribution I decided to release it for free and also add it here. This is listed in my scripts as a free to use access.
Volatility Confluence - We have now also added a feature where you can choose how many volatility models you want to be aligned before SIVE calls an alert. There are a total of 9 models we have included, example. You choose 3 'Volatility Confluence', this means that SIVE will only call alerts when 3 of those 9 models agree. This can be very effective if you want to have more refined volatility trades, giving you more confidence that an expansion will take place.
Low Volatility Flashes - You now have the ability to control the low volatility back ground flash feature that was included with SIVE 1.0
Volatility Candles - You can now plot the volatility strength as candles! before you weren't able to see the actual underlaying volatility . Till now, turn this on and watch it turn you candles into a colourful array of the rainbow based on the volatility . Note - You will either need to *bring to front* or turn off the price data to see it
Take Profit System (beta) - Before on SIVE 1.0 and in the beta versions we had an early version of the money management. Where based on the ATR on the trade it would give you a suggested Stop Loss and Take Profit area. Now we have completely over hauled that and re calculated how we approach this also giving the trader 2 different options to choose from for suggested Stop Loss placement. We also included a 'Dynamic Take Profit' system that's based on the MTI to give you momentum based Take Profits. These are still in beta stages so any feedback is much appreciated and as always will be reviewed and considered.
RSI bands - Reverse plot the RSI onto your chart. Plot the over sold and over Bought static lines to price!
Moving Average Filter ( Multi Time Frame ) - Introducing a way further refine the trade alerts and give more power into the traders hands. We know that many many traders like to only trade if example. price is Greater Than 200 EMA. We wanted to give traders a choice to refine the trade alerts based on this information. You can choose between 'Price vs MA' - which is explained in that example just provided. The other option is 'MA vs MA', this allows you to filter out trades based on if a Moving Average of your choice(MA1) is Greater than MA2. With all this we also provided Multi Time Frame accessibility to just further give the trader more control and range. You also have the ability to just plot the Moving averages and not filter the trades at all!
Kill Zone / Time Sessions - Including another free script that has already been posted to my account. This script is also unique as it plots the specified time zones 24 hours in advanced . If you trade example. 'New York Session', Instead of using an indicator that only shows you after the fact it happens. You can now plot that time zone 24 Hours in advanced and watch how price trades to it and interacts with it. It has 4 completely customizable Time Zone slots. Please adjust to your time zone and desired sessions.
Here are some examples of SIVE working across various charts with the different features
USDCAD - 1 Hour
Take Profit System
XAUUSD ( Gold ) - 15 min
Trend Scalper System
US30(Dow Jones) - 15 min
Volatility Candles + Low Volatility Flashes
BTCUSD ( Bitcoin ) - 1 hour
Support / Resistance + Dashboard + Multi Time Frame MTI
USOIL (WTI Crude Oil ) - 5m
Kill Zones + Moving Average Filter
APPL( Apple ) - 1 hour
Moving Average Filter

SIVE 1.0 [Soldi]SIVE 1.0
What is SIVE?
SIVE stands for Systematic Institutional Volatility Expansion, SIVE uses a variety of different statistical indicators to gauge volatility along with trend correlation and other measures to filter and define a price move. This system was originally set out to redefine what a 'Trend Following System' could be; we achieved more than just that. We had created what is considered to be one of the first retail quantitative trading system, that incorporates trend following mechanics as well as trend reversal techniques. All while being aligned/correlated to trend and volatility . Something truly powerful to put into the hands of the every day trader, demystifying what quant trading can be while easily presenting it in a way where even your mom could learn how to use the system without being overwhelmed.
What makes this different from any other trading system?
SIVE raises the bar on what traditional indicators and trading systems can do, traditionally you have lagging indicators that only tell you what happened in the past with no correlation to the market or what can happen in the future. Really providing little to no statistical value, yet completely idolized by the retail world. Where SIVE exceeds these systems is all in the math and the application of those formulas to the time/price, finding the synchronicities to exploit for profits as well as exploiting the high probabilities of non-random events. How we do it? well that's in the secret crabby patty formula.
Where we are now, and where we plan to go
SIVE as it stands right now is the very first iteration of the retail quantitative trading system, it is performing exceptionally well but we aren't take that as our standard as we want to always raise the bar. as it stands, we are already working on the updates to come that will dwarf anything we've done in the past.
Our goal with SIVE is to be able to provide an easy to learn and easy to profit trading system that will provide the retail public with a trust worthy system to use. In the future our updates will carry heavier weight on key aspects like Risk to Reward, Win rates and capturing those big parabolic movements that everyone dreams of. Far fetched? for the traditional indicator junkies, but for a Quant it is just a matter of time.
What does it perform best on?
Simply put, yes... We set out to create this to be used for any trading instrument and any timeframe. Intraday timeframes have been shown to give more trades and typically higher reward trades as your able to execute with a high degree of accuracy 1:2 is very modest and can easily be achieved but we have also seen so so many trades run higher than 1:10 and even 1:20!! but as you already may know the market doesn't always give those favorable conditions to trade that high of a Risk to Reward all the time.
Stocks, Crypto, Forex, Metals, Energies, Indices, etc. are all tradeable with SIVE
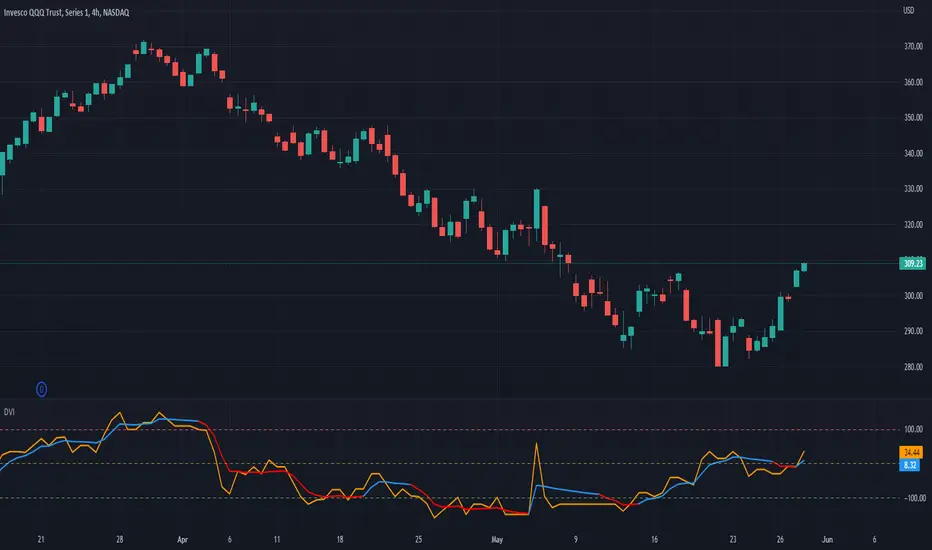
Directional Volatility Index (DVI) - SoldiDirectional Volatility Oscillator
What the DVI does is it measure 9 different volatility models based on their directional correlation and then scores that. While it calculated the volatility it also measures and scores 5 different indicators to find the likeliness of a retail position. That way the Oscillated value being plotted is that of an accurate modelled nature. This indicator aims to measure and score the directional volatility across the 9 different volatility models and then plots it as an oscillator. Included in that calculation is a measure of the likeliness of a retail traders position.
This can be used to gauge liquidity sweeps in a strategy like Smart Money Concepts. As, all the retail money is long - expect a sweep of the lows or equal highs. etc. more so you can also use this as a market meter like RSI , if the market is Over bought or Over sold, the DVI value will be over 100 or under -100 - or this tool can be used to gauge the underlaying trend!
Examples
Here is an example on BTCUSD - 1d
- as you can see there is significant trend when the DVI is crossed
Here is that same example on BTCUSD - 1d zoomed into 4h
- as you can see there is significant trend when the DVI is crossed
Log OscillatorThe Log Oscillator measures the mean of logarithmic returns, given this data you can assume market expectancy in returns of the mean. When seeing positive Means you can assume positive returns will follow positive returns if positive autocorrelation is present. Vice versa for the other event of negative returns.
How you can effectively use this indicator and oscillator is by looking at a higher time frame and if the oscillator is positive, you can go to a lower timeframe and try to trade in that direction of the market as the expected returns are positive in nature.
You can also spot trend divergences very well as the trend continues but the returns are dropping that means the returns are mean reverting and can have a potential to flip to the other side
