Trend Scanner ProTrend Scanner Pro, Robust Trend Direction and Strength Estimator
Trend Scanner Pro is designed to evaluate the current market trend with maximum robustness, providing both direction and strength based on statistically reliable data.
This indicator builds upon the core logic of a previous script I developed, called Best SMA Finder. While the original script focused on identifying the most profitable SMA length based on backtested trade performance, Trend Scanner Pro takes that foundation further to serve a different purpose: analyzing and quantifying the actual trend state in real time.
It begins by testing hundreds of SMA lengths, from 10 to 1000 periods. Each one is scored using a custom robustness formula that combines profit factor, number of trades, and win rate. Only SMAs with a sufficient number of trades are retained, ensuring statistical validity and avoiding curve fitting.
The SMA with the highest robustness score is selected as the dynamic reference point. The script then calculates how far the price deviates from it using rolling standard deviation, assigning a trend strength score from -5 (strong bearish) to +5 (strong bullish), with 0 as neutral.
Two detection modes are available:
Slope mode, based on SMA slope reversals
Bias mode, based on directional shifts relative to deviation zones
Optional features:
Deviation bands for visual structure
Candle coloring to reflect trend strength
Compact table showing real-time trend status
This tool is intended for traders who want an adaptive, objective, and statistically grounded assessment of market trend conditions.
Bands and Channels

Commodity Trend Reactor [BigBeluga]
🔵 OVERVIEW
A dynamic trend-following oscillator built around the classic CCI, enhanced with intelligent price tracking and reversal signals.
Commodity Trend Reactor extends the traditional Commodity Channel Index (CCI) by integrating trend-trailing logic and reactive reversal markers. It visualizes trend direction using a trailing stop system and highlights potential exhaustion zones when CCI exceeds extreme thresholds. This dual-level system makes it ideal for both trend confirmation and mean-reversion alerts.
🔵 CONCEPTS
Based on the CCI (Commodity Channel Index) oscillator, which measures deviation from the average price.
Trend bias is determined by whether CCI is above or below user-defined thresholds.
Trailing price bands are used to lock in trend direction visually on the main chart.
Extreme values beyond ±200 are treated as potential reversal zones.
🔵 FEATURES\
CCI-Based Trend Shifts:
Triggers a bullish bias when CCI crosses above the upper threshold, and bearish when it crosses below the lower threshold.
Adaptive Trailing Stops:
In bullish mode, a trailing stop tracks the lowest price; in bearish mode, it tracks the highest.
Top & Bottom Markers:
When CCI surpasses +200 or drops below -200, it plots colored squares both on the oscillator and on price, marking potential reversal zones.
Background Highlights:
Each time a trend shift occurs, the background is softly colored (lime for bullish, orange for bearish) to highlight the change.
🔵 HOW TO USE
Use the oscillator to monitor when CCI crosses above or below threshold values to detect trend activation.
Enter trades in the direction of the trailing band once the trend bias is confirmed.
Watch for +200 and -200 square markers as warnings of potential mean reversals.
Use trailing stop areas as dynamic support/resistance to manage stop loss and exit strategies.
The background color changes offer clean confirmation of trend transitions on chart.
🔵 CONCLUSION
Commodity Trend Reactor transforms the simple CCI into a complete trend-reactive framework. With real-time trailing logic and clear reversal alerts, it serves both momentum traders and contrarian scalpers alike. Whether you’re trading breakouts or anticipating mean reversions, this indicator provides clarity and structure to your decision-making.

2-Day Volume Weighted Average Price (VWAP)This indicator extends TradingView’s built-in VWAP by calculating a volume-weighted average price over a continuous two-day window (yesterday + today), anchoring VWAP at the start of yesterday’s session and carrying it through to today’s close, but only plotting the segment that falls within the current trading session—yesterday’s data feeds into the calculation to ensure today’s VWAP reflects the prior session’s volume and price action, while the line drawn on your chart always begins at today’s session open.
Standard Deviation Bands: Optional ±1σ, ±2σ, and ±3σ envelopes, exactly as in the default VWAP, but based on the rolling two-day data.

QQQ Strategy v2 ESL | easy-peasy-x This is a strategy optimized for QQQ (and SPY) for the 1H timeframe. It significantly outperforms passive buy-and-hold approach. With settings adjustments, it can be used on various assets like stocks and cryptos and various timeframes, although the default out of the box settings favor QQQ 1H.
The strategy uses various triggers to take both long and short trades. These can be adjusted in settings. If you try a different asset, see what combination of triggers works best for you.
Some of the triggers employ LuxAlgo's Ultimate RSI - shoutout to him for great script, check it out here .
Other triggers are based on custom signed standard deviation - basically the idea is to trade Bollinger Bands expansions (long to the upside, short to the downside) and fade or stay out of contractions.
There are three key moving averages in the strategy - LONG MA, SHORT MA, BASIC MA. Long and Short MAs are guides to eyes on the chart and also act as possible trend filters (adjustable in settings). Basic MA acts as guide to eye and a possible trade trigger (adjustable in settings).
There are a few trend filters the strategy can use - moving average, signed standard deviation, ultimate RSI or none. The filters act as an additional condition on triggers, making the strategy take trades only if both triggers and trend filter allows. That way one can filter out trades with unfavorable risk/reward (for instance, don't long if price is under the MA200). Different trade filters can be used for long and short trades.
The strategy employs various stop loss types, the default of which is a trailing %-based stop loss type. ATR-based stop loss is also available. The default 1.5% trailing stop loss is suitable for leveraged trading.
Lastly, the strategy can trigger take profit orders if certain conditions are met, adjustable in settings. Also, it can hold onto winning trades and exit only after stop out (in which case, consecutive triggers to take other positions will be ignored until stop out).
Let me know if you like it and if you use it, what kind of tweaks would you like to see.
With kind regards,
easy-peasy-x

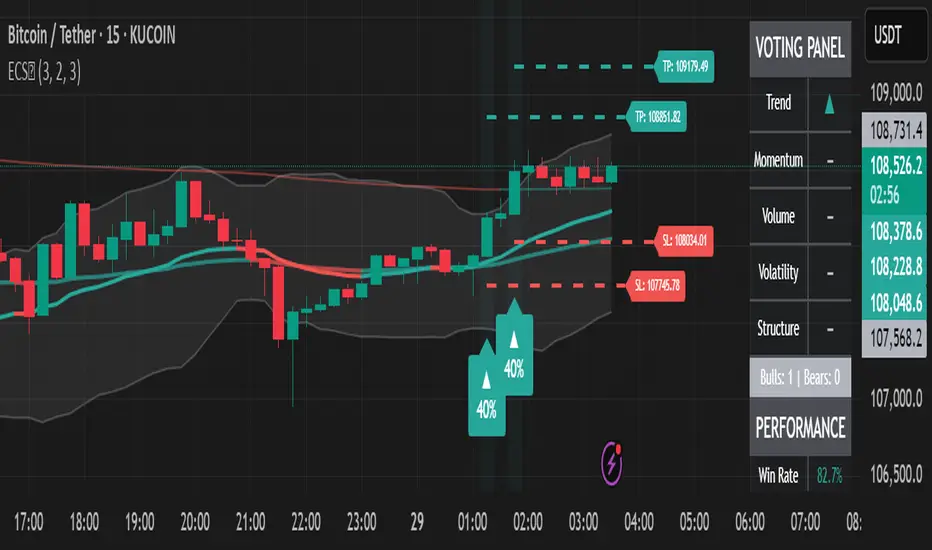
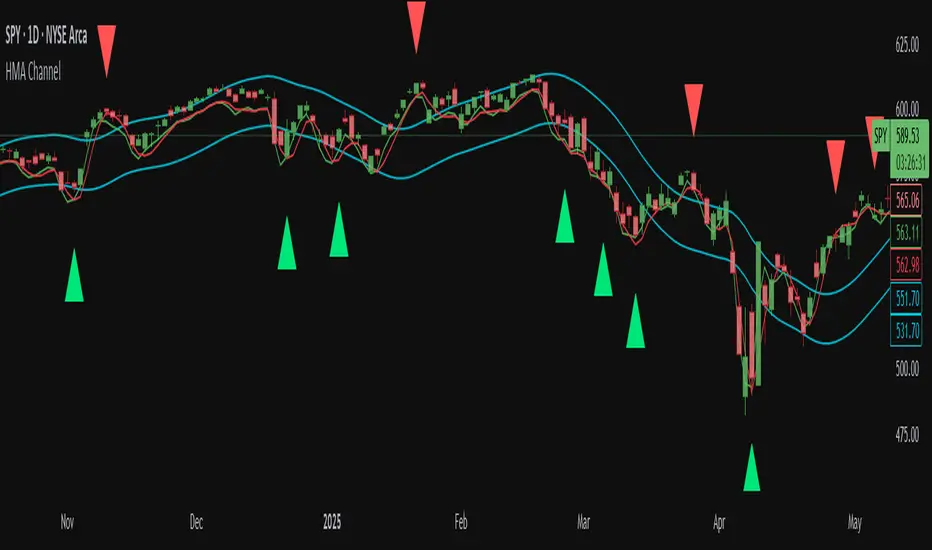
Ensemble Consensus System
The Ensemble Consensus System (ECS) brings a **Random Forest-style ensemble vote** to Pine Script: five orthogonal "expert" strategies each cast a bull/bear vote (+1/-1/0), and only high-confidence consensus moves become signals—dramatically reducing noise while capturing strong directional moves.
## What Makes This Original
ECS is the first Pine Script indicator to implement true machine learning-style ensemble voting. Rather than relying on a single methodology, five independent experts analyze different market dimensions:
• **Trend Expert**: Multi-timeframe EMA alignment analysis
• **Momentum Expert**: RSI/MACD/Stochastic confluence with consistency filters
• **Volume Expert**: Proprietary volume pressure + OBV confirmation
• **Volatility Expert**: Bollinger Band mean reversion opportunities
• **Structure Expert**: Adaptive pivot-based support/resistance detection
## How It Works
The system requires consensus among experts, with an **adaptive threshold** based on market volatility:
| Volatility Regime | ATR/Close | Votes Required |
|-------------------|-----------|----------------|
| Low Volatility | <1% | 2+ |
| Normal Markets | 1-2% | 3+ |
| High Volatility | >2% | 4+ |
This dynamic adjustment prevents overtrading in choppy conditions while maintaining responsiveness during strong trends.
## Key Features
### Signals
• **Visual entry points** with strength percentage (60% = 3/5 experts agree)
• **Adaptive thresholds** that adjust to market conditions
• **Multi-expert consensus** reduces false signals
### Risk Control
• **Dynamic stop-loss/take-profit** based on ATR
• **Regime-adjusted targets** (±50% in volatile markets)
• **Visual SL/TP lines** with exact price labels
### Analytics
• **Real-time vote panel** showing each expert's stance
• **Performance tracking** with win rate and P/L
• **Market regime indicator** (Trending/Ranging/Volatile)
• **Light Mode** for better performance on slower systems
## How to Use
1. **Apply ECS** to a liquid instrument on 15m-4H timeframe (best: 1H)
2. **Wait for signal** - green ▲ for long, red ▼ for short with strength %
3. **Verify votes** - check panel to see which experts agree
4. **Execute trade** using the displayed SL/TP levels
5. **Monitor regime** - be cautious if market regime changes
### Quick Start Settings
• **Standard Trading**: Use defaults (3 votes, adaptive mode ON)
• **Conservative**: Increase to 4 votes minimum
• **Aggressive**: Reduce to 2 votes, tighten stops
## Important Limitations
• **Chart Types**: Not compatible with Renko/Heikin-Ashi
• **Volume Data**: Requires reliable volume (forex pairs may underperform)
• **News Events**: Signals may lag during gaps/major announcements
• **Processing**: Heavy calculations - use Light Mode if needed
## Settings Guide
**Ensemble Controls**
• `Minimum Votes` (default: 3): Base threshold before volatility adjustment
• `Adaptive Mode` (default: ON): Auto-adjusts threshold by market volatility
**Visual Options**
• `Vote Panel`: Live expert voting display
• `Performance Stats`: Win rate and trade tracking
• `Light Mode`: Disables heavy visuals for speed
**Risk Parameters**
• `Stop Multiplier` (default: 2.0): ATR multiple for stop-loss
• `TP Multiplier` (default: 3.0): ATR multiple for take-profit
• `Dynamic TP` (default: ON): Adjusts targets by market regime
## Troubleshooting
**Too few signals?**
→ Lower minimum votes or check if market is ranging
**Indicator running slow?**
→ Enable Light Mode, disable performance tracking
**Weird volume votes?**
→ Verify your symbol has accurate volume data
## Technical Concepts
The ensemble approach mimics **Random Forest algorithms** where multiple decision trees vote on outcomes. By requiring agreement among experts using orthogonal methodologies, ECS filters out signals that would fail under different market lenses. The adaptive threshold addresses fixed-parameter weakness by dynamically adjusting selectivity based on volatility.
• Adaptive pivot lookback for dynamic structure detection
• Safe volume pressure calculation preventing division errors
• Momentum consistency filter reducing choppy false signals
• Unified dashboard merging vote panel + performance stats
• Regime-based dynamic take-profit adjustment
*Educational indicator demonstrating ensemble methods in Pine Script. No guarantee of future performance. Always use proper risk management and position sizing.*
SD Median NUPL-Z🧠 Overview
SD Median NUPL-Z is a trend-following indicator that leverages a normalized version of Bitcoin’s Net Unrealized Profit/Loss (NUPL) metric, filtered through a median-based volatility band. Unlike traditional NUPL which is often used to spot extremes, this indicator is designed to identify sustained directional trends — entering only when both on-chain momentum and price structure align.
🧩 Key Features
Z-Scored NUPL Trend Engine: Normalizes NUPL using rolling mean and standard deviation to create a smoothed trend signal.
Price Structure Filter: Implements a median-based price band to avoid false entries during short-term volatility.
Custom Thresholds: User-defined thresholds determine when the trend signal is strong enough to justify a long or short directional bias.
Directional Candle Coloring: Reinforces current trend regime visually with aqua (bullish) and red (bearish) plots and candles.
Optimized for BTC: Uses Bitcoin’s Market Cap and Realized Cap to construct the NUPL input.
🔍 How It Works
On-Chain Core: NUPL is calculated as the percentage of unrealized profit in the market: (Market Cap - Realized Cap) / Market Cap * 100.
Z-Score Transformation: The raw NUPL value is normalized using a rolling average and standard deviation over a set window (default 134 days), producing the NUPL-Z series.
Median-Based Price Filter: A rolling 50th percentile (median) of price is used alongside its own standard deviation to create upper and lower bounds.
These bounds define a "volatility corridor" around price; the trend signal is only acted upon if price confirms by staying outside these bands.
Signal Logic:
A Long signal is triggered when NUPL-Z rises above the long threshold and price is not below the lower band.
A Short signal is triggered when NUPL-Z falls below the short threshold.
State Variable (CD): Tracks the current market regime, used to control plotting and color changes.
🔁 Use Cases & Applications
Momentum-Based Trend Following: Helps traders align with directional moves backed by both on-chain sentiment and supportive price structure.
Filtered Entry Timing: Reduces premature or noise-based entries by requiring price confirmation before committing to NUPL-based signals.
Best Suited for BTC: This tool is designed specifically around Bitcoin’s on-chain metrics and is not intended for altcoins or low-volume assets.
✅ Conclusion
SD Median NUPL-Z repurposes a traditionally cyclical valuation tool into a modern trend-following signal by combining statistical normalization with dynamic price structure filtering. It offers a more robust way to participate in high-conviction directional trends, reducing the likelihood of entering during short-lived counter moves.
⚠️ Disclaimer
The content provided by this indicator is for educational and informational purposes only. Nothing herein constitutes financial or investment advice. Trading and investing involve risk, including the potential loss of capital. Always backtest and apply risk management suited to your strategy.

SD Median MVRV-Z🧠 Overview
SD Median MVRV-Z is a trend-following indicator that uses on-chain valuation signals as a supportive filter. It blends the momentum of the MVRV Z-score with a dynamic median-based price structure to provide cleaner, more reliable directional signals. This tool is designed to identify when price and trend align with favorable broader context — not to pinpoint overbought or oversold extremes.
🧩 Key Features
Trend-Following Core: Signals are built around directional strength, not reversion.
MVRV Z-Score Momentum: Utilizes the statistical momentum of Market Cap vs Realized Cap as a macro trend driver.
Rolling Median Filter: Applies a price-based condition to ensure trend signals are not triggered during short-term counter-moves or noise.
Threshold Customization: Input controls allow traders to define the strength required to trigger long or short signals.
Dynamic Visualization: Candle coloring and filled zones provide instant feedback on current market regime.
🔍 How It Works
Trend Signal: The MVRV ratio is normalized via Z-scoring to produce a momentum-like signal based on how far current valuation deviates from its rolling average.
Price Filter: A rolling median and standard deviation of price define an upper and lower band. These serve to filter out MVRV-Z signals that occur when price is moving against the perceived direction.
Signal Logic:
Long signal = MVRV-Z above threshold and price is not in the lower volatility band.
Short signal = MVRV-Z below threshold, regardless of price band (more aggressive condition).
Directional Engine (CD): Encodes the market regime state (1 for long, -1 for short, 0 for neutral), and drives all visual outputs.
🔁 Use Cases & Applications
Momentum Confirmation: Identify when on-chain momentum and price structure both confirm a trend direction.
Reduced Whipsawing: Filter out weak or conflicting trend signals that would otherwise lead to false entries.
Best Suited for BTC: This indicator is specifically tailored for Bitcoin, using BTC’s Market Cap and Realized Cap data from on-chain sources.
✅ Conclusion
SD Median MVRV-Z is a trend-centric tool that ensures directional conviction by requiring agreement between price structure and underlying market momentum. It is not meant to detect tops or bottoms, but instead to help traders participate in sustainable moves with greater confidence.
⚠️ Disclaimer
The content provided by this indicator is for educational and informational purposes only. Nothing herein constitutes financial or investment advice. Trading and investing involve risk, including the potential loss of capital. Always backtest and apply risk management suited to your strategy.

Dynamic Range Filter with Trend Candlesticks (Zeiierman)█ Overview
Dynamic Range Filter with Trend Candlesticks (Zeiierman) is a volatility-responsive trend engine that adapts in real-time to market structure, offering a clean and intelligent visualization of directional bias. It blends dynamic range calculation with customizable smoothing techniques and layered trend confirmation logic, making it ideal for traders who rely on clear trend direction, structural range analysis, and momentum-based candlestick signals.
By measuring scaled volatility over configurable lengths and applying advanced moving average techniques, this indicator filters out market noise while preserving true directional intent. Complementing this, a dual-trend system (range-based and candle-based) enhances clarity and responsiveness, particularly during shifting market conditions.
█ How It Works
⚪ Scaled Volatility Band Calculation
At the core lies a volatility engine that constructs adaptive range bands around price using smoothed high/low calculations. The bands are dynamically adjusted using:
High/Low Smoothing – Applies a moving average to the raw high and low data before calculating the range.
Scaled Range Volatility – A 2.618 multiplier scales the distance between smoothed highs and lows, forming a responsive volatility envelope.
Band Multiplier – Controls how wide the upper/lower range bands extend from the mean.
This filtering process minimizes false signals and highlights only structurally meaningful moves.
⚪ Multi-Type Smoothing Engine
Users can choose from a wide array of smoothing algorithms for trend construction, including:
HMA (default), SMA, EMA, RMA
KAMA – Adapts to market volatility using efficiency ratios.
VIDYA – Momentum-sensitive smoothing using CMO logic.
FRAMA – Dynamically adjusts to fractal dimension in price.
Super Smoother – Ideal for eliminating aliasing in range signals.
This provides the trader with fine-tuned control over reactivity vs. smoothness.
⚪ Trend Detection (Dual Engine)
The indicator includes two independent trend tracking systems:
Main Trend Filter – Based on adaptive volatility band shifts.
Candle Trend Filter – A second-tier confirmation using smoothed candle data, ideal for directional candles and confirmation entries.
█ How to Use
⚪ Trend Confirmation
Use the Trend Line and colored candlesticks for high-probability entries in the trend direction. The more trend layers that align, the higher the confidence.
⚪ Reversal Zones
When the price reaches the outer bands or fails to break them, look for candle color shifts or a crossover in the range to anticipate possible reversals or consolidations.
█ Settings
Scaled Volatility Length – Controls the lookback used to stabilize the base volatility band.
MA Type & Length – Choose and fine-tune the smoothing method (HMA, EMA, KAMA, etc.)
High/Low Smoother – Pre-smoothing for structural high/low banding.
Band Multiplier – Adjusts the width of the dynamic bands.
Trend Length (Candles) – Length used for candle-based trend confirmation.
-----------------
Disclaimer
The content provided in my scripts, indicators, ideas, algorithms, and systems is for educational and informational purposes only. It does not constitute financial advice, investment recommendations, or a solicitation to buy or sell any financial instruments. I will not accept liability for any loss or damage, including without limitation any loss of profit, which may arise directly or indirectly from the use of or reliance on such information.
All investments involve risk, and the past performance of a security, industry, sector, market, financial product, trading strategy, backtest, or individual's trading does not guarantee future results or returns. Investors are fully responsible for any investment decisions they make. Such decisions should be based solely on an evaluation of their financial circumstances, investment objectives, risk tolerance, and liquidity needs.

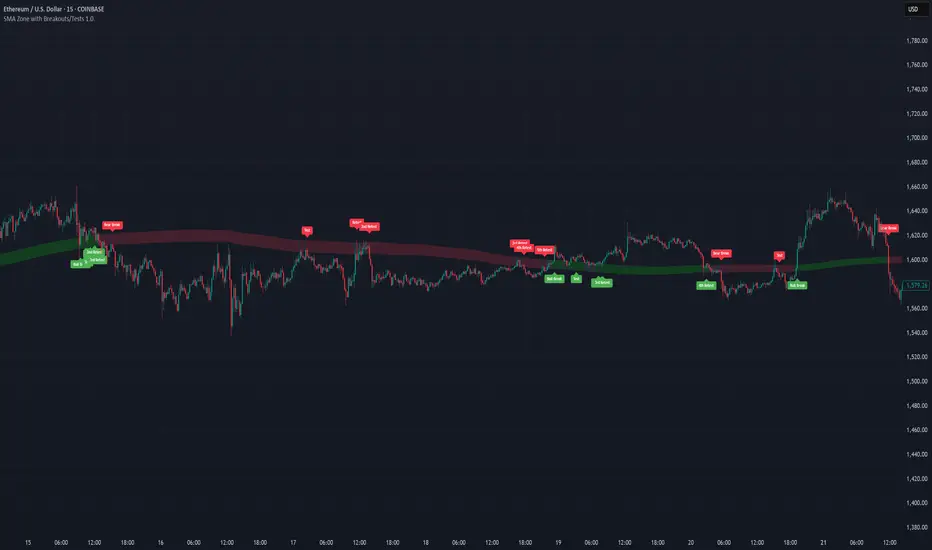
SMA Zone with Breakouts/Tests 1.0.This indicator plots a dynamic “SMA Zone” between two simple moving averages (one applied to lows, one to highs) and highlights key interaction points with the zone:
Breakouts
Bull Break: price closes above the upper SMA
Bear Break: price closes below the lower SMA
Requires confirmation via either above-average volume or an unusually wide bar (spread > ATR) closing near its extreme
Tests & Retests
After a breakout, the first re-entry into the zone edge is labeled “Test,” subsequent re-entries are numbered “Retest,” “2nd Retest,” etc.
Zone Weakening: each additional Test/Retest signifies diminished zone strength—fewer reliable boundaries remain (Traditional S/R theory)
Alerts
Fires a unified “Zone Signal” alert on every Break, Test, and Retest (set condition to “Any alert() function call”).
Disclaimer:
This is not financial advice and should not be used as a standalone trading signal.
It’s designed to draw your attention to important price-zone interactions so you can manually tune in.
The logic can be further enhanced or combined with other indicators/algorithms as part of a more complex trading system.
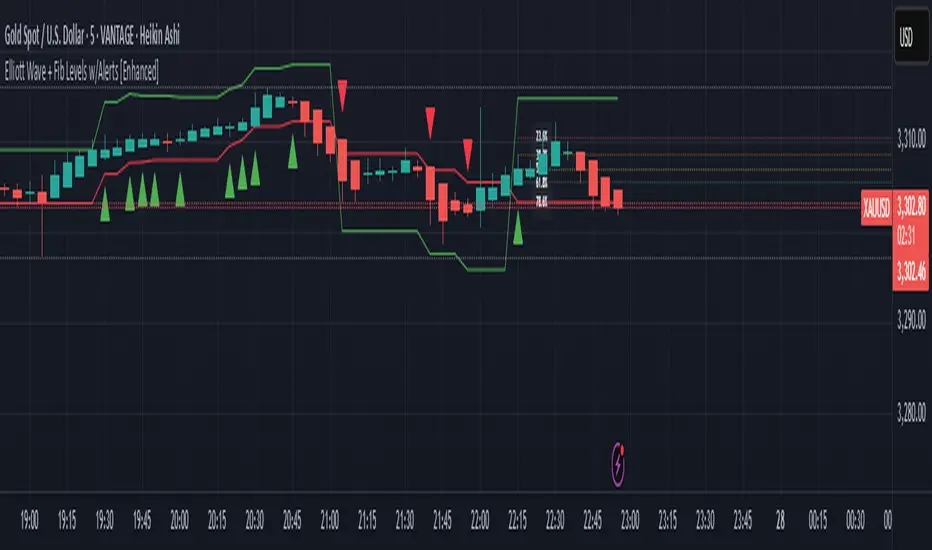
Elliott Wave + Fib Levels w/Alerts [Enhanced]Elliott Wave + Fibonacci Levels with Alerts
This powerful TradingView indicator combines Elliott Wave detection with customizable Fibonacci retracement levels to help identify key price zones and potential trade opportunities. It automatically detects bullish and bearish waves based on recent highs and lows, with an optional EMA filter to improve trend accuracy.
Key features include:
Dynamic detection of Elliott Waves based on configurable wave length.
Visualization of Fibonacci retracement levels on detected waves, with customizable percentage levels and optional labels for clarity.
ATR-based automatic calculation of stop loss and take profit levels with adjustable multipliers.
Real-time alerts triggered on new wave formations, indicating bullish or bearish setups with precise entry price details.
Clean plotting of entry signals, stop loss, and take profit zones directly on the chart.
User-friendly input controls to tailor the indicator to your trading style, including options to toggle EMA filtering, Fibonacci level display, and alert activation.
Ideal for traders looking to combine classic wave analysis with Fibonacci support/resistance levels and actionable trade alerts, this indicator streamlines technical analysis and trade management in one easy-to-use tool.
Super Arma Institucional PRO v6.3Super Arma Institucional PRO v6.3
Description
Super Arma Institucional PRO v6.3 is a multifunctional indicator designed for traders looking for a clear and objective analysis of the market, focusing on trends, key price levels and high liquidity zones. It combines three essential elements: moving averages (EMA 20, SMA 50, EMA 200), dynamic support and resistance, and volume-based liquidity zones. This integration offers an institutional view of the market, ideal for identifying strategic entry and exit points.
How it Works
Moving Averages:
EMA 20 (orange): Sensitive to short-term movements, ideal for capturing fast trends.
SMA 50 (blue): Represents the medium-term trend, smoothing out fluctuations.
EMA 200 (red): Indicates the long-term trend, used as a reference for the general market bias.
Support and Resistance: Calculated based on the highest and lowest prices over a defined period (default: 20 bars). These dynamic levels help identify zones where the price may encounter barriers or supports.
Liquidity Zones: Purple rectangles are drawn in areas of significantly above-average volume, indicating regions where large market participants (institutional) may be active. These zones are useful for anticipating price movements or order absorption.
Purpose
The indicator was developed to provide a clean and institutional view of the market, combining classic tools (moving averages and support/resistance) with modern liquidity analysis. It is ideal for traders operating swing trading or position trading strategies, allowing to identify:
Short, medium and long-term trends.
Key support and resistance levels to plan entries and exits.
High liquidity zones where institutional orders can influence the price.
Settings
Show EMA 20 (true): Enables/disables the 20-period EMA.
Show SMA 50 (true): Enables/disables the 50-period SMA.
Show EMA 200 (true): Enables/disables the 200-period EMA.
Support/Resistance Period (20): Sets the period for calculating support and resistance levels.
Liquidity Sensitivity (20): Period for calculating the average volume.
Minimum Liquidity Factor (1.5): Multiplier of the average volume to identify high liquidity zones.
How to Use
Moving Averages:
Crossovers between the EMA 20 and SMA 50 may indicate short/medium-term trend changes.
The EMA 200 serves as a reference for the long-term bias (above = bullish, below = bearish).
Support and Resistance: Use the red (resistance) and green (support) lines to identify reversal or consolidation zones.
Liquidity Zones: The purple rectangles highlight areas of high volume, where the price may react (reversal or breakout). Consider these zones to place orders or manage risks.
Adjust the parameters according to the asset and timeframe to optimize the analysis.
Notes
The chart should be configured only with this indicator to ensure clarity.
Use on timeframes such as 1 hour, 4 hours or daily for better visualization of liquidity zones and support/resistance levels.
Avoid adding other indicators to the chart to keep the script output easily identifiable.
The indicator is designed to be clean, without explicit buy/sell signals, following an institutional approach.
This indicator is perfect for traders who want a visually clear and powerful tool to trade based on trends, key levels and institutional behavior.

SMA50 ATR%SMA50 ATR% Zones Indicator
Overview:
The "SMA50 ATR%" indicator is designed to provide dynamic zones above and below a Simple Moving Average (SMA) based on multiples of the Average True Range (ATR). These zones can help traders identify potential areas of interest for entries, profit-taking, and stop-loss placement by visualizing how far the price has deviated from its medium-term mean (SMA) relative to its recent volatility (ATR).
Key Features:
Central SMA: Plots a customizable Simple Moving Average (default 50-period) as the baseline.
ATR-Based Zones: Calculates and displays distinct zones by adding or subtracting multiples of the ATR (default 10-period) from the SMA.
Color-Coded Visuals: Each zone type is clearly differentiated by color and shading intensity, providing an intuitive visual guide.
Current Zone Label: Displays the specific ATR multiple zone the current price is trading in, offering quick insight into the market's current position relative to the zones.
Zone Breakdown:
The indicator plots the following zones:
Entry Zones (Green Shades):
+1x ATR to +2x ATR above SMA
+2x ATR to +3x ATR above SMA
+3x ATR to +4x ATR above SMA
The green shades become progressively lighter as they move further from the SMA, with the zone closest to the SMA being the darkest green.
Hold Zones (Yellow Shades):
+4x ATR to +5x ATR above SMA (Darker Yellow)
+5x ATR to +6x ATR above SMA (Lighter Yellow)
Sell Zones (Red Shades):
+6x ATR to +7x ATR above SMA
+7x ATR to +8x ATR above SMA
+8x ATR to +9x ATR above SMA
+9x ATR to +10x ATR above SMA
+10x ATR to +11x ATR above SMA
The red shades become progressively darker as they move further from the +6x ATR level, with the +10x to +11x ATR zone being the darkest red.
Stop Loss Zones (Red Shades):
-1x ATR below SMA (Lighter Red)
-1x ATR to -2x ATR below SMA (Darker Red)
How to Use:
Potential Entry Areas: The green "Entry Zones" might indicate areas where the price has pulled back towards the SMA but is still showing strength, or areas where a breakout above the SMA is gaining momentum relative to volatility.
Potential Overbought/Hold Areas: The yellow "Hold Zones" could suggest that the price is becoming extended from its mean, warranting caution or a "hold" approach for existing positions.
Potential Profit-Taking/Sell Areas: The red "Sell Zones" might highlight significantly overbought conditions where the price has moved multiple ATRs above the SMA, potentially signaling areas for profit-taking or considering short entries.
Potential Stop-Loss Areas: The red "Stop Loss Zones" below the SMA can help define areas where a breakdown below the moving average, considering volatility, might invalidate a bullish bias.
Customization:
SMA Length: Adjust the period for the Simple Moving Average (Default: 50).
ATR Length: Adjust the period for the Average True Range calculation (Default: 10).
Show Current Zone Label: Toggle the visibility of the on-screen label that displays the current price's ATR zone.
SMA Line Width: Customize the thickness of the SMA line.
Label Position & Size: Control the placement and text size of the current zone label for optimal chart readability.
Disclaimer:
This indicator is a tool for technical analysis and should not be considered as financial advice. Always use risk management and combine with other analysis methods before making trading decisions.

Hull MA Channel with Filtered CrossoversI've created an indicator that let's you create a HMA channel with 2 displaced HMA (A/B). As well as a HMA crossover set (C/D).
Here's how it works:
The HMA crossovers from C and D will not signal unless they are outside of the channel of A and B. As a matter of fact, NO buy signal whatsoever will occur above the channel and NO sell signal will occur below the channel.
The crossover HMA pair (C/D) can have their lengths adjusted to the 0.00 decimal point for VERY fine tuning of the crossovers.
(edit-it doesn't fine tune to the .00. This must not be a feature that is able to be utilized. I tried) The length adjustment still works to the nearest whole number. The .00 are mute :(
In keeping with that same logic, you can adjust the displacement of the channel independently to the 0.00 decimal, again for VERY fine tuning.
This is great for reversals while eliminating noise from false signals, keeping the chart nice and clean. Should be used in combination with other indicators for the best confirmations.
RRC Sniper SetupRRC Sniper Setup, this looks at candles this way:
Go to Market Scanner
Create New Scan → "RRC Sniper Setup"
Add filters listed below with timeframe logic (e.g. 1m/5m)
Run scan on:
Your Watchlist
SPY 500
QQQ 100
AI/Momentum names
1. Reclaim Filter
Find price breaking back above a key level (VWAP or EMA113)
Last 1m Close > EMA 113 (1m)
OR
Last 5m Close > VWAP
2. Retrace Filter
Price pulls back into the zone and holds within a tight range
Current Price < VWAP * 1.0025
AND
Current Price > VWAP * 0.9975
AND
Volume (Current Candle) < Volume (Previous Candle)
✅ 3. Confirm Filter
Price begins moving back up with confirmation candle and volume
Last Candle Close > Last Candle Open
AND
Volume (Current Candle) > Volume (Previous Candle)

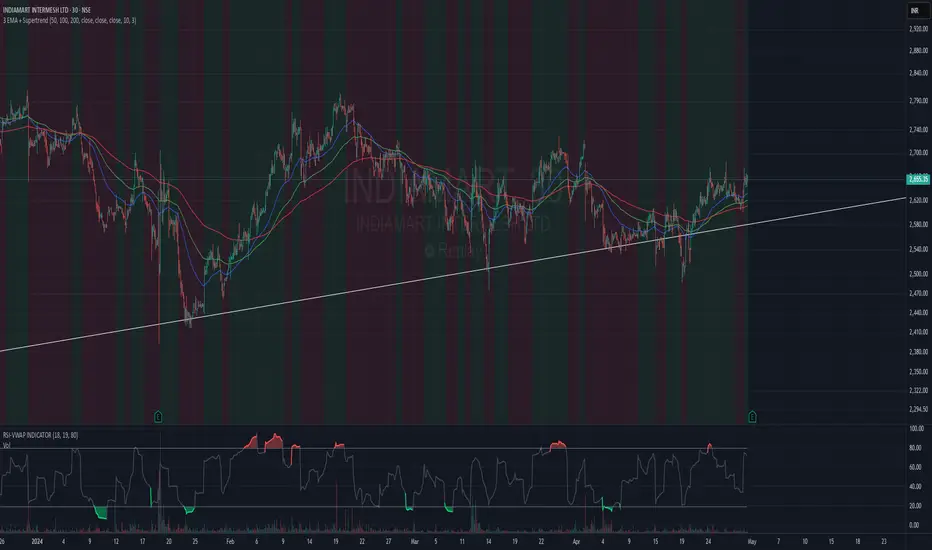
3 EMA + SupertrendThree EMAs: Helps you identify the general trend direction and potential crossovers.
When the Fast EMA crosses above the Medium or Slow EMAs, it may indicate a bullish trend, and vice versa for bearish trends.
Supertrend: Works as a trend filter. You can use it to identify overall market conditions:
When the Supertrend is green, it indicates an uptrend.
When the Supertrend is red, it indicates a downtrend.
Combination: The EMAs help you confirm the trend, and the Supertrend can act as a filter or confirmation tool for your entries and exits.
Potential Strategy Idea:
Long Entry: When the Fast EMA crosses above the Medium EMA, and the Supertrend is green.
Short Entry: When the Fast EMA crosses below the Medium EMA, and the Supertrend is red.
Exit: You can use either the Supertrend turning from green to red (for long exits) or vice versa.
SOXL Trend Surge v3.0.2 – Profit-Only RunnerSOXL Trend Surge v3.0.2 – Profit-Only Runner
This is a trend-following strategy built for leveraged ETFs like SOXL, designed to ride high-momentum waves with minimal interference. Unlike most short-term scalping scripts, this model allows trades to develop over multiple days to even several months, capitalizing on the full power of extended directional moves — all without using a stop-loss.
🔍 How It Works
Entry Logic:
Price is above the 200 EMA (long-term trend confirmation)
Supertrend is bullish (momentum confirmation)
ATR is rising (volatility expansion)
Volume is above its 20-bar average (liquidity filter)
Price is outside a small buffer zone from the 200 EMA (to avoid whipsaws)
Trades are restricted to market hours only (9 AM to 2 PM EST)
Cooldown of 15 bars after each exit to prevent overtrading
Exit Strategy:
Takes partial profit at +2× ATR if held for at least 2 bars
Rides the remaining position with a trailing stop at 1.5× ATR
No hard stop-loss — giving space for volatile pullbacks
⚙️ Strategy Settings
Initial Capital: $500
Risk per Trade: 100% of equity (fully allocated per entry)
Commission: 0.1%
Slippage: 1 tick
Recalculate after order is filled
Fill orders on bar close
Timeframe Optimized For: 45-minute chart
These parameters simulate an aggressive, high-volatility trading model meant for forward-testing compounding potential under realistic trading costs.
✅ What Makes This Unique
No stop-loss = fewer premature exits
Partial profit-taking helps lock in early wins
Trailing logic gives room to ride large multi-week moves
Uses strict filters (volume, ATR, EMA bias) to enter only during high-probability windows
Ideal for leveraged ETF swing or position traders looking to hold longer than the typical intraday or 2–3 day strategies
⚠️ Important Note
This is a high-risk, high-reward strategy meant for educational and testing purposes. Without a stop-loss, trades can experience deep drawdowns that may take weeks or even months to recover. Always test thoroughly and adjust position sizing to suit your risk tolerance. Past results do not guarantee future returns. Backtest range: May 8, 2020 – May 23, 2025

True Range eXpansion🕯️ TRX — True Range eXpansion
Clean Candle Bodies · Volatility Bands · Adaptive Range Envelope System
Not your grandfather’s candles. Not your brokerage’s bands.
----------------------------------------------------
TRX begins with a simple concept: visualize the true range of every candle, without the noise of flickering wicks.
From there, it grows into a fully adaptive price visualization framework.
What started as a candle-only visualizer evolved into a modular, user-controlled price engine.
From wickless candle clarity to dynamic volatility envelopes, TRX adapts to you.
There are plenty of band and channel indicators out there — Bollinger, Keltner, Donchian, Envelope, the whole crew.
But none of them are built on the true candle range, adaptive ATR shaping, and full user control like TRX.
This isn’t just another indicator — it’s a new framework.
Most bands and channels are based on close price and statistical deviation — useful, but limited.
TRX uses the full true range of each candle as its foundation, then applies customizable smoothing and directional ATR scaling to form a dynamic, volatility-reactive envelope.
The result? Bands that breathe with the market — not lag behind it.
----------------------------------------------------
🔧 Core Features:
🕯️ True Range Candles — Each candle is plotted from low to high, body-only, colored by open/close.
📈 Adjustable High/Low Moving Averages — Select your smoothing style: SMA, EMA, WMA, RMA, or HMA.
🌬️ ATR-Based Expansion — Bands dynamically breathe based on market volatility.
🔀 Per-Band Multipliers — Fine-tune expansion individually for the upper and lower bands.
⚖️ Basis Line — Optional centerline between bands for structure tracking and equilibrium zones.
🎛️ Full Visual Control — Width, transparency, color, on/off toggles for each element.
----------------------------------------------------
🧠 Default Use Case:
With the included default settings, TRX behaves like an evolved Bollinger Band system — based on True Range candle structure, not just close price and standard deviation.
----------------------------------------------------
🔄 How to Zero Out the Bands (for Minimalist Use):
Want just candles? A clean MA? Single band? You got it.
➤ Use TRX like a clean moving average:
• Set ATR Multiplier to 0
• Set both Band ATR Adjustments to 0
• Leave the Basis Line ON or OFF — your call
➤ Show only candles (no bands at all):
• Turn off "Show High/Low MAs"
• Turn off Basis Line
➤ Single-line ceiling or floor tracking:
• Set one band’s Transparency to 100
• Use the remaining band as a price envelope or support/resistance guide
----------------------------------------------------
🧬 Notes:
TRX can be made:
• Spiky or silky (via smoothing & ATR)
• Wide or tight (via multipliers)
• Subtle or aggressive (via color/transparency)
• Clean as a compass or dirty as a chaos meter
Built by accident. Tuned with intention.
Released to the world as one of the most adaptable and expressive visual overlays ever made.
Created by Sherlock_MacGyver

Mad Trading Scientist - Guppy MMA with Bollinger Bands📘 Indicator Name:
Guppy MMA with Bollinger Bands
🔍 What This Indicator Does:
This TradingView indicator combines Guppy Multiple Moving Averages (GMMA) with Bollinger Bands to help you identify trend direction and volatility zones, ideal for spotting pullback entries within trending markets.
🔵 1. Guppy Multiple Moving Averages (GMMA):
✅ Short-Term EMAs (Blue) — represent trader sentiment:
EMA 3, 5, 8, 10, 12, 15
✅ Long-Term EMAs (Red) — represent investor sentiment:
EMA 30, 35, 40, 45, 50, 60
Usage:
When blue (short) EMAs are above red (long) EMAs and spreading → Strong uptrend
When blue EMAs cross below red EMAs → Potential downtrend
⚫ 2. Bollinger Bands (Volatility Envelopes):
Length: 300 (captures the longer-term price range)
Basis: 300-period SMA
Upper & Lower Bands:
±1 Standard Deviation (light gray zone)
±2 Standard Deviations (dark gray zone)
Fill Zones:
Highlights standard deviation ranges
Emphasizes extreme vs. normal price moves
Usage:
Price touching ±2 SD bands signals potential exhaustion
Price reverting to the mean suggests pullback or re-entry opportunity
💡 Important Note: Use With Momentum Filter
✅ For superior accuracy, this indicator should be combined with your invite-only momentum filter on TradingView.
This filter helps confirm whether the trend has underlying strength or is losing momentum, increasing the probability of successful entries and exits.
🕒 Recommended Timeframe:
📆 1-Hour Chart (60m)
This setup is optimized for short- to medium-term swing trading, where Guppy structures and Bollinger reversion work best.
🔧 Practical Strategy Example:
Long Trade Setup:
Short EMAs are above long EMAs (strong uptrend)
Price pulls back to the lower 1 or 2 SD band
Momentum filter confirms bullish strength
Short Trade Setup:
Short EMAs are below long EMAs (strong downtrend)
Price rises to the upper 1 or 2 SD band
Momentum filter confirms bearish strength

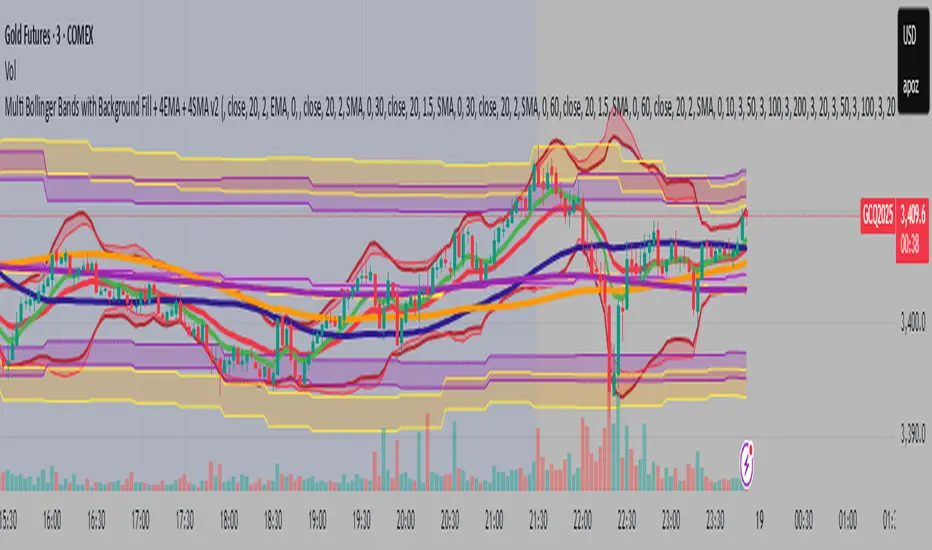
Multi Bollinger Bands with Background FillMulti Bollinger Bands with Background Fill
多組帶狀背景布林通道
This indicator plots six independent Bollinger Bands channels on the price chart, each fully configurable with customizable period length, standard deviation, and colors for upper, lower, and middle bands. Users can choose to display or hide each channel and its middle band independently.
A distinctive feature of this tool is the option to enable colored background fills between paired Bollinger Bands (channels 1&2, 3&4, and 5&6) to visually highlight volatility zones, improving the clarity of price action and aiding in multi-timeframe volatility analysis.
Key Features:
Six independent Bollinger Bands channels with separate visibility toggles.
Adjustable length and standard deviation for each channel.
Option to display or hide the middle band (basis) for each channel.
Unique colored background fills between paired upper and lower bands for enhanced visual interpretation.
Custom color settings for each band and background for better differentiation.
This indicator is designed for traders looking for advanced multi-layered volatility insights and clearer visual guidance when analyzing price behavior across different timeframes. It is suitable for various trading strategies including trend analysis and volatility-based setups.
Bollinger Bands [LePasha]Bollinger Bands : Advanced Volatility Analysis Made Simple
Discover a refined take on Bollinger Bands that offers clearer market insights and deeper volatility understanding — perfect for traders seeking precision and confidence.
What Is the Bollinger Bands Indicator?
The Bollinger Bands indicator is a powerful, overlay chart tool designed to help traders visualize price volatility and identify potential market extremes more effectively.
Unlike classic Bollinger Bands which use just two standard deviation bands, this enhanced version employs multiple deviation levels around a simple moving average (SMA) to give a richer picture of market dynamics.
Key Features
Multiple Deviation Bands: Instead of only ±2 standard deviations, it uses three extended levels: 2.5, 3.0, and 3.5 standard deviations to highlight subtle and extreme price movements.
Color-coded Volatility Zones: Each band range is filled with translucent red or teal shades to help traders visually grasp the intensity of price moves.
Customizable Length and Toggle: Adjust the length of the bands and enable or disable the indicator easily through inputs.
Why Three Deviation Levels?
Traditional Bollinger Bands (±2 standard deviations) cover approximately 95% of price action, but markets often present significant moves beyond this range that are important to identify for better risk management and trading decisions.
The three deviation levels serve distinct purposes:
Deviation Level Approximate Purpose Market Insight Provided
±2.5 SD Captures strong but fairly common moves Entry/exit trigger zones for trending moves
±3.0 SD Highlights more extreme, less frequent moves Indicates breakout strength or overextension
±3.5 SD Marks rare and extreme price deviations Signals potential reversal or exhaustion
This graduated scale allows traders to differentiate between normal volatility, strong momentum, and possible exhaustion—making it easier to tailor trading decisions according to market context.
How to Use Bollinger Bands
Identify Volatility Zones:
Observe how price interacts with the colored bands:
Price touching or crossing the ±2.5 SD band may indicate a strong move is underway.
Price breaching the ±3.0 or ±3.5 SD bands signals rare, extreme market conditions, which could be either a breakout or a setup for reversal.
Combine With Trend Analysis:
Use in conjunction with trend indicators like moving averages or volume to confirm the direction or strength of moves indicated by the bands.
Adjust Your Stops and Targets:
The layered bands help you set more intelligent stop losses and take profit zones by understanding how far price can reasonably stray.
Visual Clarity for Market Phases:
The shaded fills between bands give intuitive visual cues of volatility expansion and contraction phases.
Why Traders Choose Bollinger Bands
Greater Precision: More nuanced volatility detection than traditional Bollinger Bands.
Visual Elegance: Soft translucent fills and clear band lines reduce clutter while delivering maximum insight.
User-Friendly: Easy to toggle and adjust with minimal setup.
Versatile: Effective across assets, timeframes, and trading styles.
Final Thoughts
The Bollinger Bands indicator is more than just a volatility tool — it's your visual guide to understanding how extreme price moves develop in real-time. Whether you’re entering new trades, managing risk, or hunting reversals, this indicator equips you with superior clarity and confidence.
Add Bollinger Bands to your TradingView toolkit and see volatility like never before.

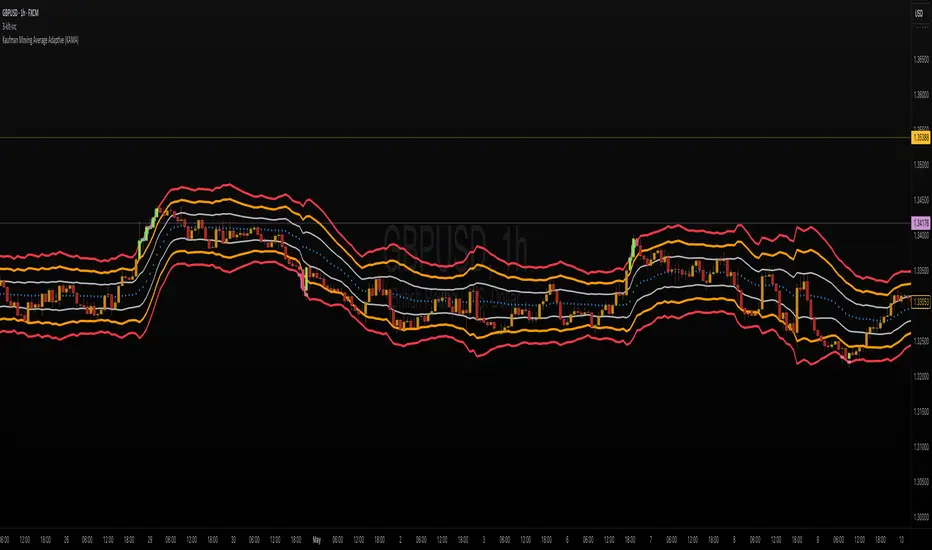
ka66: Triple Keltner Around SourceThis is an indicator-on-indicator which draws Keltner Bands (ATR Bands) around any selected Basis Source, instead of hardcoding a moving average, etc. This allows you to put bands around any sort of esoteric moving average of your choice, or even just around price data like OHLC, HLC3, and so on.
It's an enhancement on my prior Multi ATR Channels script at
Written in Pine v6 and allowing custom timeframe selection.
For example, the published chart shows the bands place around a Kaufman Adaptive Moving Average (KAMA), plotted in blue dots.
You would use it for anything that you would use plain Keltners for:
Mean Reversion
Breakouts
Take Profit and Stop Loss Estimation
But with any basis that you deem more suitable for your purposes.
Range Filter Strategy with ATR TP/SLHow This Strategy Works:
Range Filter:
Calculates a smoothed average (SMA) of price
Creates upper and lower bands based on standard deviation
When price crosses above upper band, it signals a potential uptrend
When price crosses below lower band, it signals a potential downtrend
ATR-Based Risk Management:
Uses Average True Range (ATR) to set dynamic take profit and stop loss levels
Take profit is set at entry price + (ATR × multiplier) for long positions
Stop loss is set at entry price - (ATR × multiplier) for long positions
The opposite applies for short positions
Input Parameters:
Adjustable range filter length and multiplier
Customizable ATR length and TP/SL multipliers
All parameters can be optimized in TradingView's strategy tester
You can adjust the input parameters to fit your trading style and the specific market you're trading. The ATR-based exits help adapt to current market volatility.

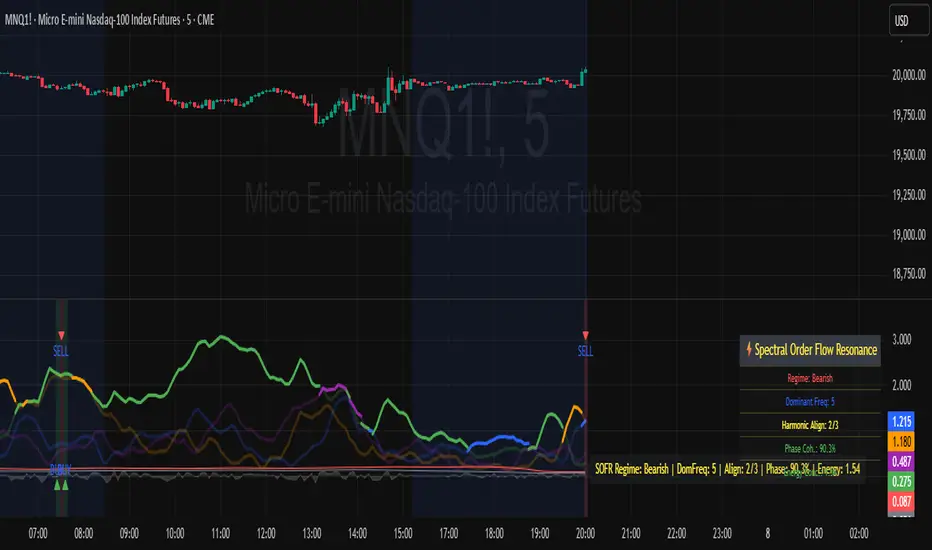
Spectral Order Flow Resonance (SOFR) Spectral Order Flow Resonance (SOFR)
See the Market’s Hidden Rhythms—Trade the Resonance, Not the Noise!
The Spectral Order Flow Resonance (SOFR) is a next-generation tool for traders who want to go beyond price and volume, tapping into the underlying “frequency signature” of order flow itself. Instead of chasing lagging signals or reacting to surface-level volatility, SOFR lets you visualize and quantify the real-time resonance of market activity—helping you spot when the crowd is in sync, and when the regime is about to shift.
What Makes SOFR Unique?
Not Just Another Oscillator:
SOFR doesn’t just measure momentum or volume. It applies spectral analysis (using Fast Fourier Transform) to normalized order flow, extracting the dominant cycles and their resonance strength. This reveals when the market is harmonizing around key frequencies—often the precursor to major moves.
Regime Detection, Not Guesswork:
By tracking harmonic alignment and phase coherence across multiple Fibonacci-based frequencies, SOFR identifies when the market is entering a bullish, bearish, or neutral resonance regime. This is visualized with a dynamic dashboard and info line, so you always know the current state at a glance.
Dynamic Dashboard:
The on-chart dashboard color-codes each key metric—regime, dominant frequency, harmonic alignment, phase coherence, and energy concentration—so you can instantly gauge the strength and direction of the current resonance. No more guesswork or clutter.
Universal Application:
Works on any asset, any timeframe, and in any market—futures, stocks, crypto, forex. If there’s order flow, SOFR can reveal its hidden structure.
How Does It Work?
Order Flow Normalization:
SOFR calculates the net buying/selling pressure and normalizes it using a rolling mean and standard deviation, making the signal robust across assets and timeframes.
Spectral Analysis:
The script applies FFT to the normalized order flow, extracting the magnitude and phase of several key frequencies (typically Fibonacci numbers). This allows you to see which cycles are currently dominating the market.
Resonance & Regime Logic:
When multiple frequencies align and exceed a dynamic resonance threshold, and phase coherence is high, SOFR detects a “resonance regime”—bullish, bearish, or neutral. This is when the market is most likely to experience a strong, sustained move.
Visual Clarity:
The indicator plots each frequency’s magnitude, highlights the dominant one, and provides a real-time dashboard with color-coded metrics for instant decision-making.
SOFR Dashboard Metrics Explained
Regime:
What it means: The current “state” of the market as detected by SOFR—Bullish, Bearish, or Neutral.
Why it matters: The regime tells you whether the market’s order flow is resonating in a way that favors upward moves (Bullish), downward moves (Bearish), or is out of sync (Neutral). This helps you align your trades with the prevailing market force, or stand aside when there’s no clear edge.
Dominant Freq:
What it means: The most powerful frequency (cycle length, in bars) currently detected in the order flow.
Why it matters: Markets often move in cycles. The dominant frequency shows which cycle is currently driving price action, helping you time entries and exits with the market’s “heartbeat.”
Harmonic Align:
What it means: The number of key frequencies (out of 3) that are currently in resonance (above threshold).
Why it matters: When multiple frequencies align, it signals that different groups of traders (with different time horizons) are acting in concert. This increases the probability of a strong, sustained move.
Phase Coh.:
What it means: A measure (0–100%) of how “in sync” the phases of the key frequencies are.
Why it matters: High phase coherence means the market’s cycles are reinforcing each other, not cancelling out. This is a classic signature of trending or explosive moves.
Energy Conc.:
What it means: The concentration of spectral energy in the dominant frequency, relative to the average.
Why it matters: High energy concentration means the market’s activity is focused in one cycle, increasing the odds of a decisive move. Low concentration means the market is scattered and less predictable.
How to Use
Bullish Regime:
When the dashboard shows a green regime and high harmonic alignment, the market is in a bullish resonance—look for long opportunities or trend continuations.
Bearish Regime:
When the regime is red and alignment is high, the market is in a bearish resonance—look for short opportunities or trend continuations.
Neutral Regime:
When the regime is gray or alignment is low, the market is out of sync—consider waiting for clearer signals or using other tools.
Combine with Your Strategy:
Use SOFR as a confirmation tool, a filter for trend/range conditions, or as a standalone regime detector. The dashboard’s color-coded metrics help you instantly spot when the market is entering or exiting resonance.
Inputs Explained
FFT Window Length :
Controls the number of bars used for spectral analysis. Higher values smooth the signal, lower values make it more sensitive.
Order Flow Period:
Sets the lookback for normalizing order flow. Shorter periods react faster, longer periods are smoother.
Fibonacci Frequencies:
Choose which cycles to analyze. Default values (5, 8, 13) capture common market rhythms.
Resonance Threshold:
Sets how strong a frequency’s signal must be to count as “in resonance.” Lower for more signals, higher for stricter filtering.
Signal Smoothing & Amplify:
Fine-tune the display for your chart and asset.
Dashboard & Info Line Toggles:
Show or hide the on-chart dashboard and info line as needed.
Why This Matters
Most indicators show you what just happened. SOFR shows you when the market is entering a state of resonance—when crowd behavior is most likely to produce powerful, sustained moves. By visualizing the hidden structure of order flow, you gain a tactical edge over traders who only see the surface.
For educational purposes only. Not financial advice. Always use proper risk management.
Use with discipline. Trade your edge.
— Dskyz, for DAFE Trading Systems