Ichimoku Cloud MAThis chart has a combination of the Ichimoku cloud and Moving Average. This is solely for education and I am not responsible for any losses to users' investments.
Bands and Channels

D-LevelsThis indicator accepts a comma-separated list of price ranges as input and visualizes each range as a distinct zone on the chart, using randomized colors for distinction.

RSI Shift Zone [ChartPrime]OVERVIEW
RSI Shift Zone is a sentiment-shift detection tool that bridges momentum and price action. It plots dynamic channel zones directly on the price chart whenever the RSI crosses above or below critical thresholds (default: 70 for overbought, 30 for oversold). These plotted zones reveal where market sentiment likely flipped, helping traders pinpoint powerful support/resistance clusters and breakout opportunities in real time.
⯁ HOW IT WORKS
When the RSI crosses either the upper or lower level:
A new Shift Zone channel is instantly formed.
The channel’s boundaries anchor to the high and low of the candle at the moment of crossing.
A mid-line (average of high and low) is plotted for easy visual reference.
The channel remains visible on the chart for at least a user-defined minimum number of bars (default: 15) to ensure only meaningful shifts are highlighted.
The channel is color-coded to reflect bullish or bearish sentiment, adapting dynamically based on whether the RSI breached the upper or lower level. Labels with actual RSI values can also be shown inside the zone for added context.
⯁ KEY TECHNICAL DETAILS
Uses a standard RSI calculation (default length: 14).
Detects crossovers above the upper level (trend strength) and crossunders below the lower level (oversold exhaustion).
Applies the channel visually on the main chart , rather than only in the indicator pane — giving traders a precise map of where sentiment shifts have historically triggered price reactions.
Auto-clears the zone when the minimum bar length is satisfied and a new shift is detected.
⯁ USAGE
Traders can use these RSI Shift Zones as powerful tactical levels:
Treat the channel’s high/low boundaries as dynamic breakout lines — watch for candles closing beyond them to confirm fresh trend continuation.
Use the midline as an equilibrium reference for pullbacks within the zone.
Visual RSI value labels offer quick checks on whether the zone formed due to extreme overbought or oversold conditions.
CONCLUSION
RSI Shift Zone transforms a simple RSI threshold crossing into a meaningful structural tool by projecting sentiment flips directly onto the price chart. This empowers traders to see where momentum-based turning points occur and leverage those levels for breakout plays, reversals, or high-confidence support/resistance zones — all in one glance.

VectorTraderMBK 714 vertical linesVectorTraderMBK 714 vertical lines.
This TradingView indicator allows you to mark two customizable times on your chart with vertical red lines. Designed to work seamlessly on 5-minute timeframes, it draws precise vertical lines at the exact UTC times you specify in the indicator’s settings.
Key Features:
User-friendly inputs to set the hour and minute for two separate vertical lines
Automatically plots vertical lines at the selected UTC times every trading day
Compatible with charts set to the UTC timezone (UTC+0)
Lines extend vertically across the entire visible chart for easy visual reference
Ideal for marking important market sessions, news events, or specific trading windows
Use this indicator to visually track critical time points on your charts and improve your trading timing
How it works.
To setup the 714 Method,
1.Go to Indicator settings
2. Change Value of First Line Hour to 7
3. Change Value of Secound Line Hour to 8
4. Save as defaults.

Custom MA Crossover with Labels/*
This indicator displays two customizable moving averages (Fast and Slow),
defaulting to 10-period and 100-period respectively.
Key Features:
- You can choose between Simple Moving Average (SMA) or Exponential Moving Average (EMA).
- When the Fast MA crosses above the Slow MA, a green "BUY" label appears below the candle.
- When the Fast MA crosses below the Slow MA, a red "SELL" label appears above the candle.
- Alerts are available for both Buy and Sell crossovers.
Usage:
- Helps identify trend direction and potential entry/exit points.
- Commonly used in trend-following strategies and crossover systems.
- Suitable for all timeframes and assets.
Tip:
- You can adjust the Fast and Slow MA periods to fit your trading strategy.
- Try using this with volume or momentum indicators for confirmation.
*/

Customizable Donchian Channel with Offset Lines What makes it special for you:
- You control the offset percentages, so if someday 60/40 makes more sense—just tweak it!
- All line colors are fully customizable to suit your visual styling or layer coordination.
- Built for clarity and flexibility, right in line with your scripting ethos!
Want to add dashed lines or scale price markers in lakhs and crores next? Let’s keep sculpting!

Momentum_EMABand📢 Reposting this script as the previous version was shut down due to house rules. Follow for future updates.
The Momentum EMA Band V1 is a precision-engineered trading indicator designed for intraday traders and scalpers. This first version integrates three powerful technical tools — EMA Bands, Supertrend, and ADX — to help identify directional breakouts while filtering out noise and choppy conditions.
How the Indicator Works – Combined Logic
This script blends distinct but complementary tools into a single, visually intuitive system:
1️⃣ EMA Price Band – Dynamic Zone Visualization
Plots upper and lower EMA bands (default: 9-period) to form a dynamic price zone.
Green Band: Price > Upper Band → Bullish strength
Red Band: Price < Lower Band → Bearish pressure
Yellow Band: Price within Band → Neutral/consolidation zone
2️⃣ Supertrend Overlay – Reliable Trend Confirmation
Based on customizable ATR length and multiplier, Supertrend adds a directional filter.
Green Line = Uptrend
Red Line = Downtrend
3️⃣ ADX-Based No-Trade Zone – Choppy Market Filter
Manually calculated ADX (default: 14) highlights weak trend conditions.
ADX below threshold (default: 20) + Price within Band → Gray background, signaling low-momentum zones.
Optional gray triangle marker flags beginning of sideways market.
Why This Mashup & How the Indicators Work Together
This mashup creates a high-conviction, rules-based breakout system:
Supertrend defines the primary trend direction — ensuring trades are aligned with momentum.
EMA Band provides structure and timing — confirming breakouts with retest logic, reducing false entries.
ADX measures trend strength — filtering out sideways markets and enhancing trade quality.
Each component plays a specific role:
✅ Supertrend = Trend bias
✅ EMA Band = Breakout + Retest validation
✅ ADX = Momentum confirmation
Together, they form a multi-layered confirmation model that reduces noise, avoids premature entries, and improves trade accuracy.
💡 Practical Application
Momentum Breakouts: Enter when price breaks out of EMA Band with Supertrend confirmation
Avoid Whipsaws: Skip trades during gray-shaded low-momentum periods
Intraday Scalping Edge: Tailored for lower timeframes (5min–15min) where noise is frequent
⚠️ Important Disclaimer
This is Version 1 — expect future enhancements based on trader feedback.
This tool is for educational purposes only. No indicator guarantees profitability. Use with proper risk management and strategy validation.

Fractal Flow BandsFractal Flow Bands
A high-precision trend-following system combining HalfTrend logic with ALMA smoothing — built for clarity, speed, and smart alerts.
🔷 What is Fractal Flow Bands?
Fractal Flow Bands merges the best of both worlds:
HalfTrend for accurate trend detection
ALMA (Arnaud Legoux Moving Average) for smooth, low-lag confirmation
This unique synergy delivers clean, non-repainting Buy/Sell signals, filtering out market noise and keeping your chart crystal clear.
🔍 How It Works
Blue HalfTrend Line + Green ALMA Crossover → BUY
Red HalfTrend Line + Red ALMA Crossover → SELL
You get only ONE alert per trend change, eliminating spammy notifications. Perfect for swing traders, scalpers, and trend followers alike.
⚙️ Core Features
✅ Dual Confirmation Engine
ALMA must confirm HalfTrend — no single-line tricks here.
✅ One Alert per Trend Shift
Clean signals, no noise, no repeats.
✅ Visual Clarity
Color-coded trends. No channels, ribbons, or clutter.
✅ Customizable Settings
Tune HalfTrend amplitude and ALMA smoothness to your strategy.
🎯 Best For
Swing traders wanting confirmation before entries
Scalpers needing fast, accurate signal flow
Anyone who hates messy charts but loves sharp decisions
🛠 Settings Explained
Setting Description
HT Amplitude Controls HalfTrend sensitivity
ALMA Length / Offset / Sigma Adjusts the smoothness of ALMA
Source Choose price source (Close, Open, etc.)
Display Toggles Enable/disable arrows and ribbons
Colors Fully customizable trend color schemes
✅ Built-in Alerts — So you never miss a signal again.
⚡ Lag-free performance — Works on multiple timeframes.
📈 Real strategy-ready code — Not just another repainting overlay.

Engulfing RSI EMA tohungmc tkEngulfing RSI EMA Indicator
This indicator combines the 200-period EMA, RSI, and Engulfing candlestick patterns to generate buy and sell signals:
Buy Signal: Triggered when a Bullish Engulfing candle forms, RSI is above a user-defined threshold (default 50), and the price is above the EMA (default 200).
Sell Signal: Triggered when a Bearish Engulfing candle forms, RSI is below a user-defined threshold (default 50), and the price is below the EMA (default 200).
Features:
Customizable EMA length (default 200).
Adjustable RSI period (default 14) and thresholds for buy/sell signals.
Visual signals with green upward triangles for buy and red downward triangles for sell.
Alerts for both buy and sell signals.
How to Use:
Add the indicator to your chart.
Adjust EMA length, RSI period, and RSI thresholds in the settings.
Set up alerts for "Buy Signal" or "Sell Signal" to receive notifications.
Ideal for traders looking to combine trend, momentum, and candlestick patterns for better decision-making.

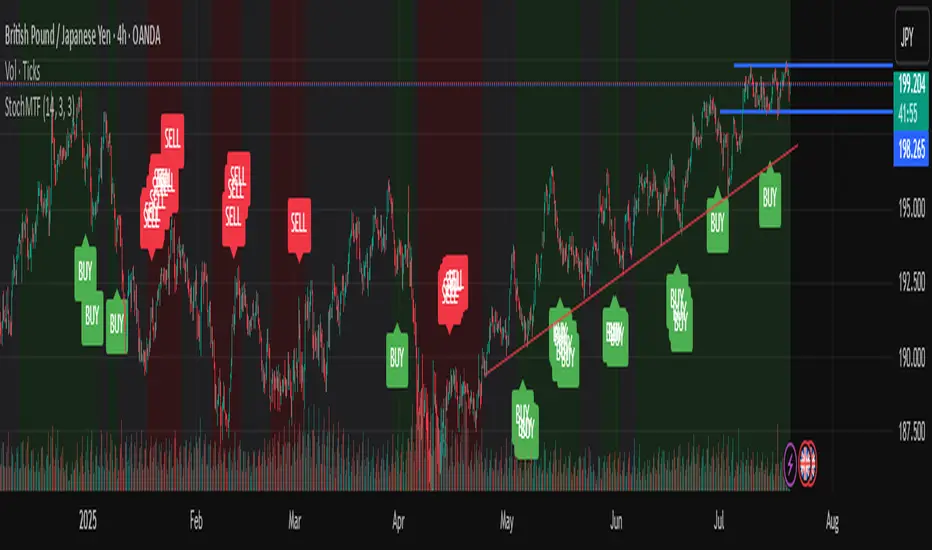
Stochastic Trend Signal with MTF FilterMulti-Timeframe Stochastic Trend Filter – Real Signals with Confirmation Candles
This script is a multi-timeframe Stochastic trend filter designed to help traders identify reliable BUY/SELL signals based on both momentum and higher-timeframe trend context.
It combines three key components:
Entry Signal Logic:
Entry is based on the Stochastic Oscillator (%K, 14,3), where overbought/oversold conditions are detected in the current chart's timeframe.
A green (bullish) candle following a red candle with %K below 20 can trigger a BUY signal.
A red (bearish) candle following a green candle with %K above 80 can trigger a SELL signal.
Trend Confirmation – Daily Filter:
The script uses Stochastic on the 1D (Daily) timeframe to determine whether short-term momentum aligns with a broader daily trend.
BUY signals are only allowed if the Daily %K is above 50.
SELL signals are only allowed if the Daily %K is below 50.
Long-Term Trend Filter – Weekly Stochastic:
A second filter uses Weekly %K:
BUY signals are suppressed if the Weekly trend is bearish (Weekly %K < 50) while Daily %K is bullish (> 50).
SELL signals are suppressed if the Weekly trend is bullish (Weekly %K > 50) while Daily %K is bearish (< 50).
🖼️ The chart background changes color to visually assist users:
Green background: bullish alignment on Daily and Weekly Stochastic.
Red background: bearish alignment.
Gray background: trend conflict (Daily and Weekly disagree).
✅ This script is ideal for swing traders or position traders who want to enter with confirmation while avoiding false signals during trend conflict zones.
🔔 Alerts are provided for BUY and SELL signals once all conditions are met.
How to use:
Apply on timeframe (4H recommended).
Add alerts for "BUY Alert" and "SELL Alert".
Use background color and plotted labels as entry filters.
Disclaimer: This is not financial advice. Always use proper risk management and test on demo accounts first.
Alprof Strategyyou can get strategy by TS this strategy you can get a entry point
you can get strategy by TS this strategy you can get a entry point
you can get strategy by TS this strategy you can get a entry point
you can get strategy by TS this strategy you can get a entry point
you can get strategy by TS this strategy you can get a entry point
you can get strategy by TS this strategy you can get a entry point

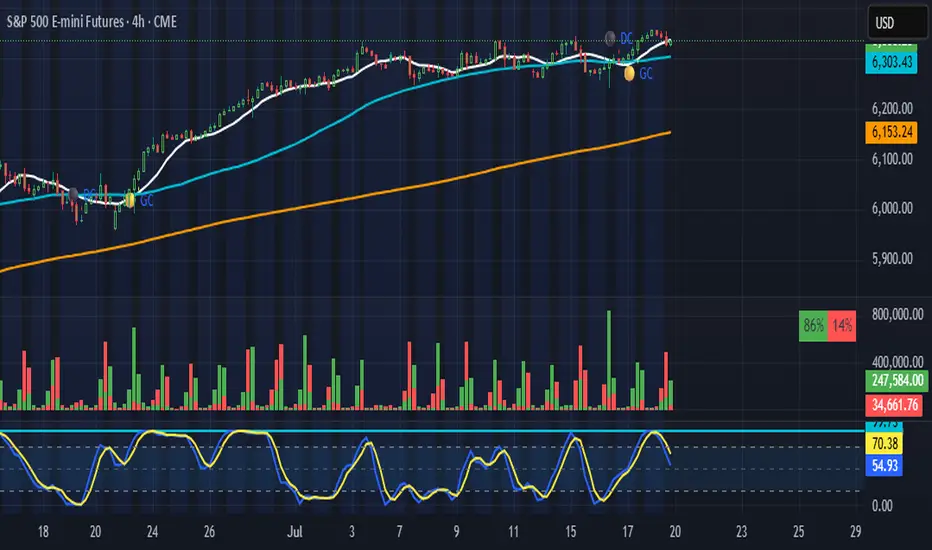
Multi-Indicator AI TableV10Multiple signal generator with table. Exclusive formularies make up the signals generated and shown in the table. Some are long term signals, and some are short term signals. "Ai Says" is a collaboration of all signals within the script. In the settings menu, you can eliminate the charting of any of the signals, but the table will always show the signals. The freshest signal is always the top signal in the indicator group. You know the newest signal by the number in the bar column. This can be used on Cryptocurrencies, Currencies, Stocks and Efts (and other investments). It is a tool and not trading advice. It is a guide to assist your trading decisions.

Indian Stocks Daily, Weekly, Monthly, All-Time High-LowDaily high, low, last week high low, current week high low, current month high low.

Confluence AVWAP Breakout RibbonThis advanced indicator overlays up to five Anchored VWAPs—Daily Session, Weekly, Monthly, Prior Swing High, and Prior Swing Low—directly onto your chart. It highlights a "confluence ribbon" between these levels, visually mapping the real-time price zone where institutional activity may cluster. The ribbon is colored dynamically so you can instantly spot which side of value price is breaking towards.
How it works:
• The script automatically recalculates each selected VWAP anchor in real time.
• For swing-high and swing-low anchors, it starts a new VWAP every time a new price swing is confirmed.
• You can enable or disable any anchor via the script’s Inputs panel to suit your trading style or asset.
Entry Signals:
• A long breakout (green up-arrow) triggers only on the first candle that closes above all active VWAP anchors.
• A short breakout (red down-arrow) triggers only on the first close below all active anchors.
• These signals help confirm when price makes a decisive move out of a key value zone, filtering out false or weak breakouts.
How to use:
Add the indicator to any chart or timeframe.
In the Inputs, choose which VWAP anchors to activate.
Watch for the ribbon color and width: a wider ribbon means more confluence between price zones.
Trade signals (arrows) are only painted on the first candle to break out above or below all anchors, making them easy to see and avoiding repaint.
Optional: Set up alerts using the built-in TradingView alerts for each breakout direction.
Customization:
• Toggle each anchor on/off for your preferred strategy.
• Adjust the swing length for pivots.
• Change ribbon opacity for better chart visibility.
Why it’s unique:
• Most VWAP scripts only plot a single line, or show basic session anchors.
• This indicator lets you stack up to five important VWAP anchors and requires consensus: price must clear all active anchors in one move to signal a breakout.
• The live ribbon and dynamic visuals provide clear confluence zones and breakout cues that go beyond traditional VWAP use.
Best practices:
• Works well on all major assets (stocks, crypto, FX, indices) and all chart timeframes.
• For highest reliability, use two or more anchors at a time.
• Consider using alongside your preferred trend or volatility filter.
For educational and research purposes only. This is not financial advice or a recommendation to buy or sell. Always use proper risk management and test before live trading.

Alternate Hourly HighlightAlternate Hourly Highlight
This indicator automatically highlights every alternate one-hour window on your chart, making it easy to visually identify and separate each trading hour. The background alternates color every hour, helping traders spot hourly cycles, session changes, or develop time-based trading strategies.
Works on any timeframe.
No inputs required—just add to your chart and go!
Especially useful for intraday traders who analyze price action, volatility, or volume by the hour.
For custom colors or session windows, feel free to modify the script!

3 EMA trong 1 NTT CAPITALThe 3 EMA in 1 NTT CAPITAL indicator provides an overview of the market trend with three EMAs of different periods, helping to identify entry and exit points more accurately, thus supporting traders in making quick and effective decisions.

📊 Bot-Activated Signal OverlayWest Coast SPECS is an automated signal intelligence bot designed to capitalize on macro themes—especially weak-dollar rotations across sectors like commodities, energy, gold, and emerging markets.
🔍 What It Does
Scans small-cap tickers (<$2B market cap) for high-probability entries
Detects RSI and Stochastic divergence with volume confirmation
Integrates options flow intel (Volume ≥ 2× Open Interest)
Filters signals by trend alignment using 10, 50, and 200-day MAs
Exports signals for TradingView overlays, Google Sheets, and Discord alerts
⚙️ Signal Engine
Custom Python logic pulls real-time price and options data and runs multi-layered filters:
Liquidity checks via volume spikes
Momentum alignment (MA crossovers, price zones)
Bullish or Bearish classification with sector tags
📡 Bot Deployment
🔗 Webhook-ready Flask server
🤖 Discord bot (!scan command) posts daily signals into your channel
📤 Pine Script overlay visualizes confirmed setups in TradingView
📈 Optional Streamlit dashboard tracks DXY, sector ETFs, and macro rotation
🎯 Strategy Focus
West Coast SPECS thrives on:
Dollar downtrends
Commodity surges
Rotation into under-the-radar small caps with momentum
This isn't just a bot—it's your tactical macro wingman with surgical market entry logic. Built for traders who want precision, context, and speed.
TeeLek-HedgingLineXThis indicator is suitable for use with charts that are Down Trend and are about to change to Sideway or Up Trend. It works opposite to another indicator that I created called TeeLek Hedging Line.
Calculation method :
We will use the Highest value of 600 candlesticks in the past to create the average line. After that, we will create the All Time Low line.
How to use :
It is used to tell that this point is the lowest historical High value. This means that this is the point where the best Short buyers start to reach the loss point. At the same time, it is the point where the worst Long buyers start to make a profit. Therefore, it is suitable to be the point of changing from Down Trend to Up Trend.
There are 2 lines that are used to divide the range. If the graph is at the bottom, it will be Down Trend. If the graph is in the middle, it will be Sideway. And if the graph is at the top of both lines, it will be Up Trend.
//-------------------------------------------------------------------
อินดิเคเตอร์นี้ เหมาะสำหรับใช้กับกราฟที่เป็น Down Trend และกำลังจะเปลี่ยนเป็น Sideway หรือ Up Trend จะทำงานตรงข้ามกับ อินดิเคเตอร์อีกตัวที่ผมสร้างขึ้นมา ที่ชื่อว่า TeeLek Hedging Line
วิธีการคำนวณ
เราจะใช้ค่า Highest 600 แท่งเทียนย้อนหลัง ในการสร้างเส้นค่าเฉลี่ย หลังจากนั้น ก็จะสร้างเส้น All Time Low ขึ้นมา
วิธีใช้งาน
เอาไว้บอกว่า จุดนี้คือ ค่า High ย้อนหลังที่ต่ำที่สุด หมายความว่า นี่คือจุดที่คนซื้อ Short ที่ดีที่สุดก็เริ่มถึงจุดขาดทุน ขณะเดียวกัน ก็เป็นจุดที่คนที่ซื้อ Long ที่แย่ที่สุด เริ่มกำไร จึงเหมาะจะเป็นจุดเปลี่ยนจาก Down Trend ไปเป็น Up Trend
มี 2 เส้น ก็เอาไว้ใช้แบ่งช่วง ถ้ากราฟอยู่ด้านล่าง จะเป็น Down Trend ถ้ากราฟอยู่ระหว่างกลางก็จะเป็น Sideway และถ้ากราฟอยู่ด้านบนของทั้งสองเส้น ก็จะเป็น Up Trend

Previous-Day High–Low BoxThe indicator automatically plots a translucent box covering the entire previous trading day’s high-to-low range—with dashed extension lines at those levels and a date watermark centered inside—so you can instantly see yesterday’s key price boundaries on any intraday chart.

PK's Buffer Zones with Extra Zone + EMA + VWAPuse as support and resistance. for any market and stocks.

SMA Crossover with Background ShadingThis application is to identify when to buy or when to sell upon satisfying the condition on this script.

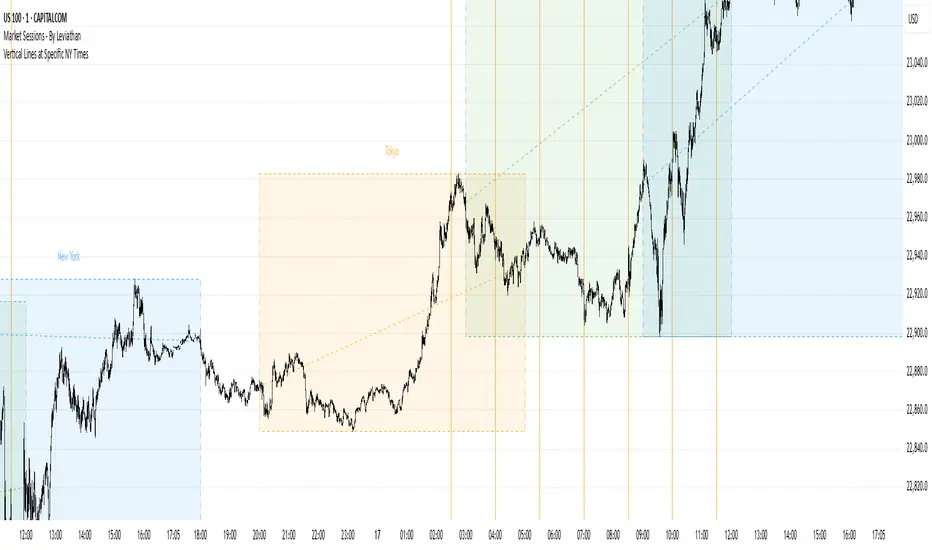
Vertical Lines at Specific NY Timesthese time zones indicates london session and new york session accumulation manipulation and distribution at than spesific time zones
NEOs TDI + Sharkfin ScannerTDI + alert scanner for sharkfins use with Fibs and or support resistance for confluence
