Money Moves Breakout PRO – By Money Moves//@version=5
indicator("Money Moves Breakout PRO – By Money Moves", overlay=true, max_boxes_count=2)
// ------ USER SETTINGS ------
sessionStartHour = input.int(11, "London Start Hour (IST)", minval=0, maxval=23)
sessionStartMin = input.int(30, "London Start Min (IST)", minval=0, maxval=59)
boxMinutes = input.int(15, "Box Candle Minutes", minval=1, maxval=5000)
showBox = input(true, "Show Breakout Box")
emaLength = input.int(20, "EMA Length")
useVolumeConfirm = input(true, "Use Volume Confirmation")
ist_offset = 5.5 // IST = UTC+5:30
barTime = time + int(ist_offset * 3600000)
boxStartSec = sessionStartHour * 3600 + sessionStartMin * 60
boxEndSec = boxStartSec + boxMinutes * 60
currentSecOfDay = ((barTime % 86400000) / 1000)
// ----- LONDON BOX -----
isBox = currentSecOfDay >= boxStartSec and currentSecOfDay < boxEndSec
isBoxPrev = currentSecOfDay >= boxStartSec and currentSecOfDay < boxEndSec
boxStartBar = not isBoxPrev and isBox
boxEndBar = isBoxPrev and not isBox
var float boxHigh = na
var float boxLow = na
var int boxBarIdx = na
var box sessionBox = na
if boxStartBar
boxHigh := high
boxLow := low
boxBarIdx := bar_index
if isBox and not na(boxHigh)
boxHigh := math.max(boxHigh, high)
boxLow := math.min(boxLow, low)
if boxEndBar and showBox
sessionBox := box.new(left=boxBarIdx, right=bar_index, top=boxHigh, bottom=boxLow, border_color=color.rgb(255, 226, 59), bgcolor=color.new(#ebff3b, 66))
// --- EMA & Volume ---
emaValue = ta.ema(close, emaLength)
avgVol = ta.sma(volume, 1000)
volCond = useVolumeConfirm ? (volume > avgVol) : true
// --- Only first breakout + Confirmation ---
var bool brokenHigh = false
var bool brokenLow = false
firstBreakUp = false
firstBreakDn = false
if boxEndBar
brokenHigh := false
brokenLow := false
// Upar ka breakout: close boxHigh se upar, EMA 20 ke upar, volume confirmation
if not isBox and not isBoxPrev and not na(boxHigh ) and not brokenHigh and close > boxHigh and close > emaValue and volCond
firstBreakUp := true
brokenHigh := true
// Niche ka breakout: close boxLow se niche, EMA 20 ke niche, volume confirmation
if not isBox and not isBoxPrev and not na(boxLow ) and not brokenLow and close < boxLow and close < emaValue and volCond
firstBreakDn := true
brokenLow := true
plotshape(firstBreakUp, style=shape.triangleup, location=location.belowbar, color=color.green, size=size.normal, text="BUY")
plotshape(firstBreakDn, style=shape.triangledown, location=location.abovebar, color=color.red, size=size.normal, text="SELL")
// Show EMA on chart for visual trend confirmation
plot(emaValue, color=color.blue, linewidth=2, title="EMA 20")
Bill Williams Indicators

ICT Concepts [LuxAlgo//@version=5
indicator("Full Entry: RSI + EMA + CHoCH + FVG + TP/SL", overlay=true)
rsiPeriod = 14
emaPeriod = 50
tpPerc = 1.5
slPerc = 1.0
is15min = timeframe.period == "15" // يشتغل فقط على فريم 15 دقيقة
rsi = ta.rsi(close, rsiPeriod)
ema = ta.ema(close, emaPeriod)
// قمة وقاع سابقة
ph = ta.highest(high, 20)
pl = ta.lowest(low, 20)
// CHoCH
bullCHoCH = close > ph and close > ema
bearCHoCH = close < pl and close < ema
// FVG حساب
fvgUp = low > high
fvgDn = high < low
fvgHigh = high
fvgLow = low
touchFVGUp = fvgUp and low <= fvgHigh and low >= fvgLow
touchFVGDown = fvgDn and high >= fvgLow and high <= fvgHigh
// دخول فقط بفريم 15 دقيقة + لمس FVG
longEntry = is15min and bullCHoCH and rsi < 35 and touchFVGUp
shortEntry = is15min and bearCHoCH and rsi > 65 and touchFVGDown
// TP/SL
longTP = close * (1 + tpPerc / 100)
longSL = close * (1 - slPerc / 100)
shortTP = close * (1 - tpPerc / 100)
shortSL = close * (1 + slPerc / 100)
// إشارات دخول
plotshape(longEntry, location=location.belowbar, color=color.green, style=shape.labelup, text="BUY")
plotshape(shortEntry, location=location.abovebar, color=color.red, style=shape.labeldown, text="SELL")
// TP / SL
plot(longEntry ? longTP : na, style=plot.style_cross, color=color.green)
plot(longEntry ? longSL : na, style=plot.style_cross, color=color.red)
plot(shortEntry ? shortTP : na, style=plot.style_cross, color=color.red)
plot(shortEntry ? shortSL : na, style=plot.style_cross, color=color.green)
// EMA
plot(ema, title="EMA 50", color=color.orange)
// FVG رسم
boxFVG = fvgUp or fvgDn
var box fvgBox = na
if boxFVG
fvgBox := box.new(left=bar_index, top=fvgHigh, right=bar_index + 3, bottom=fvgLow, border_color=color.gray, bgcolor=color.new(color.gray, 85))
// تنبيهات
alertcondition(longEntry, title="Buy Signal", message="Buy: CHoCH + RSI + EMA + FVG")
alertcondition(shortEntry, title="Sell Signal", message="Sell: CHoCH + RSI + EMA + FVG")

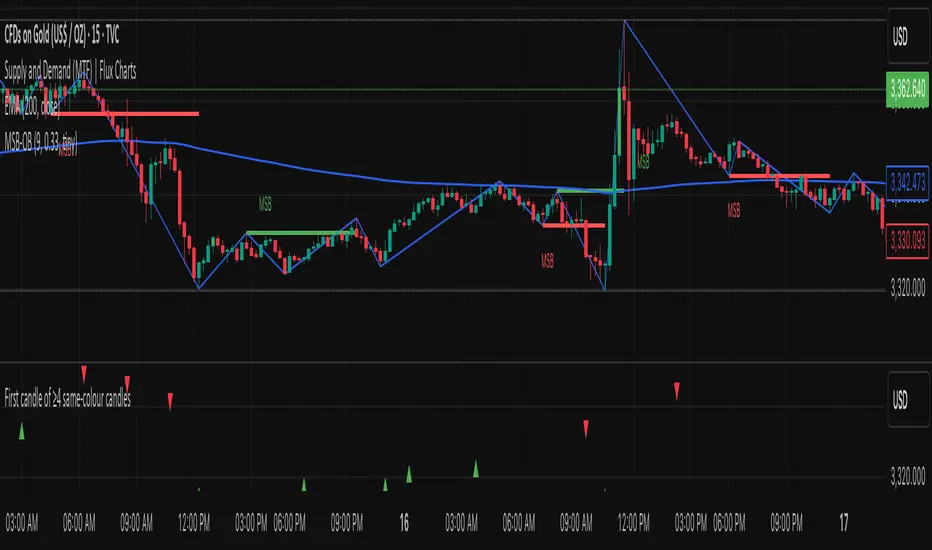
SMC Liquidity Sweep + OB [Fixed]This is a Smart Money Concept (SMC) backtest-ready strategy built to identify high-probability reversal points using two key institutional principles: liquidity sweep and order block confirmation. Designed specifically for pairs like XAUUSD, this system detects where the market sweeps resting liquidity (e.g., stop hunts above recent highs or below recent lows) and looks for a clean reversal candle (order block) to confirm the trap and trigger precise entries.
Unlike BOS or FVG-based models, this version focuses purely on stop-hunt logic and clean price action to simulate institutional behavior—ideal for Smart Money and ICT-style traders who want clear, non-repainting, high-RR setups.
🔍 How the Strategy Works
Liquidity Sweep Detection
The strategy monitors the chart for price breaking above recent swing highs or below recent swing lows (based on a customizable lookback window). This acts as a trigger for a potential trap or liquidity raid.
Order Block Confirmation
After a sweep is detected, the system waits for a confirming candle — a reversal (engulfing-type) candle that acts as an order block:
For longs: a bullish candle that closes higher than the previous bearish candle’s high
For shorts: a bearish candle that closes lower than the previous bullish candle’s low
Entry & Risk Management
Once confirmation is valid, a market entry is placed:
Stop Loss (SL): A fixed pip distance below/above the entry candle
Take Profit (TP): Calculated based on a user-defined Risk-Reward Ratio (e.g., 1:2, 1:3)
Trades are managed automatically and logged into the Strategy Tester with full visibility
🔧 Strategy Parameters
Setting Description
Stop Loss (Pips) Fixed SL distance from entry to protect capital
Risk/Reward Ratio Dynamically calculates TP relative to SL (e.g., RR 2.0 = TP 2x SL)
Liquidity Lookback How many candles back to evaluate swing highs/lows for potential sweeps
Order Block Filter Validates entry only after candle confirmation post-sweep
Direction Filter Supports both long and short signals or one-sided entry filters
📈 Use Case & Optimization
This strategy works best when applied to:
XAUUSD, NAS100, BTCUSD, US30, and high-volatility pairs
Timeframes like 5m, 15m, 1H, where sweeps and reversals are more visible
Traders who follow ICT, SMC, or price action frameworks
Reversal or continuation traders looking for clean execution after liquidity grabs
Because it uses pure price action and logical candle structures, it avoids lag and repainting found in indicator-based systems.
💡 Smart Money Concept Logic Used
Liquidity Grab: Detects stop hunts above recent highs/below lows
Order Block Entry: Entry confirmed only after strong reversal candle at sweep zone
High RR Control: SL and TP customizable to reflect real trading plans
Non-Repainting Structure: All entries are based on confirmed candle closes
📊 Built-in Backtesting Features
Plots trades visually with entry arrows and signal labels
Uses strategy.entry() and strategy.exit() for full testing accuracy
Outputs full performance metrics: win rate, profit factor, drawdown, etc.
All parameters tunable from the settings panel
📎 Release Notes
v1.0
Core SMC strategy with liquidity sweep + OB entry logic
Fully backtestable with fixed SL & dynamic TP
Plots buy/sell signals visually
Optimized for metals, indices, and crypto
⚠️ Disclaimer
This TradingView script is intended for educational and research purposes only. It is not financial advice or a live signal system. Always backtest on your own charts, confirm entries with your personal analysis, and apply strict risk management.

First candle of ≥4 same‑colour candlesClassifies each candle as bullish or bearish. A candle is considered bullish when the closing price is above the opening price, and bearish when the closing price is below the opening price
investopedia.com
; traditional charts depict bullish candles in green or white and bearish candles in red or black
investopedia.com
.
Counts consecutive candles of the same colour. Whenever a green candle appears, it increments a “bull run” counter; the counter resets to zero on a red candle. Likewise, it maintains a “bear run” counter that increments on red candles and resets on green candles.
Detects long runs of momentum. If a run of green candles reaches four or more bars, the indicator marks the very first candle of that sequence with a small green triangle below the bar. Similarly, if a run of red candles reaches four or more bars, it marks the first candle of that bearish run with a red triangle above the bar. Only the initial bar of each qualifying run is highlighted, even if the run later extends to five, six, or more candles.
XAUUSD Smart Money Sweep StrategyThis is a custom-built Smart Money Concept (SMC) strategy for XAUUSD that detects liquidity sweeps at key swing levels and confirms entries using momentum-based reversal candles. It simulates institutional behavior by entering trades only when price grabs liquidity (stop hunts above highs or below lows), then shows strong rejection in the opposite direction.
The strategy uses precise entry logic, fixed stop loss, and a customizable risk-to-reward ratio for dynamic take-profit targeting. All trades are fully backtestable using TradingView’s built-in strategy() functions.
This approach is ideal for Smart Money traders looking to exploit price inefficiencies without relying on BOS or FVG logic.
🔑 Key Features:
Liquidity Sweep Logic: Detects price sweeping above recent highs or below recent lows, simulating stop hunts and liquidity grabs.
Candle Confirmation Filter: Confirms entry only if a strong reversal candle (momentum shift) forms after the sweep, avoiding weak entries.
Full Backtest Engine: Uses TradingView's strategy.entry() and strategy.exit() to simulate trades with real SL/TP tracking.
Custom Risk Management: Adjustable stop loss (in pips) and risk-to-reward (RR) ratio allow you to shape trade outcomes and optimize strategy performance.
Non-Repainting Logic: All entries are based on closed candles, meaning the signals never repaint and are reliable for testing and execution.
⚙️ Settings:
Setting Description
Liquidity Lookback Number of candles to look back for swing highs/lows to determine sweeps
Stop Loss (pips) Distance below/above entry where SL is placed (fixed pip SL)
Risk/Reward Ratio Multiplies SL to calculate TP (e.g., 1:2 = 2x SL as TP)
Entry Logic Requires sweep + a momentum candle (e.g., bullish close after a sweep down)
📊 How It Works:
The strategy scans recent price action using a lookback range to find the highest high and lowest low (liquidity zones).
If price sweeps above the high or below the low, this triggers a potential entry condition.
A momentum candle confirmation must follow immediately:
For long trades: bullish candle (close > open, and close > previous close)
For short trades: bearish candle (close < open, and close < previous close)
If confirmed, the strategy:
Enters the trade
Places a fixed stop loss in pips
Sets a dynamic TP using the RR ratio
All trades are logged and visualized in the Strategy Tester panel for performance review.
📌 Optimized For:
XAUUSD (Gold) on 15m, 30m, and 1H timeframes
Smart Money / ICT / Liquidity-based trading styles
Traders who prefer reversal setups after liquidity raids
Systems focused on precise execution and high-RR setups
📎 Release Notes:
v1.0 – First release featuring liquidity sweep detection, candle confirmation logic, SL/TP execution, and Strategy Tester support. Clean structure designed for real-world backtesting on volatile instruments like gold.
⚠️ Disclaimer:
This script is for educational and research purposes only. It does not constitute financial advice or signal services. Always validate strategy results with manual backtesting and apply proper risk management.

3 EMA trong 1 NTT CAPITALThe 3 EMA in 1 NTT CAPITAL indicator provides an overview of the market trend with three EMAs of different periods, helping to identify entry and exit points more accurately, thus supporting traders in making quick and effective decisions.

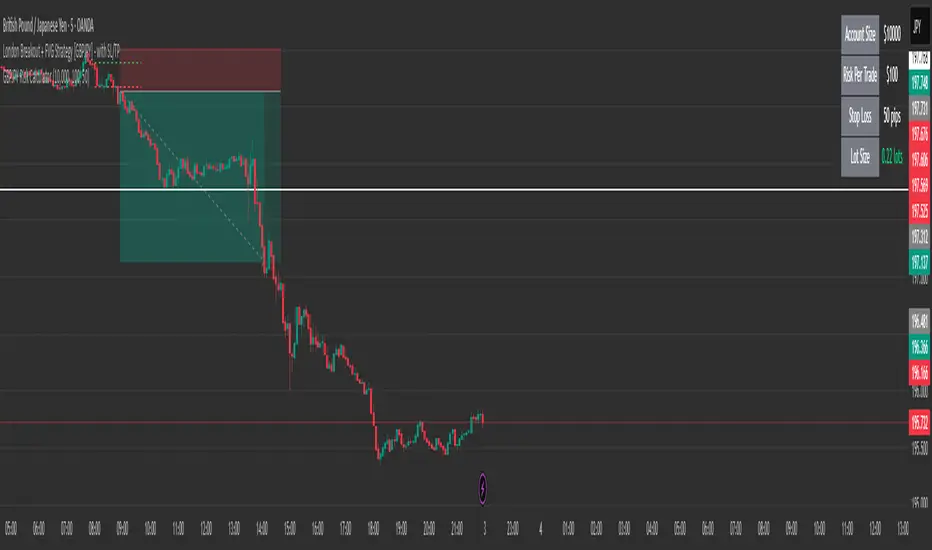

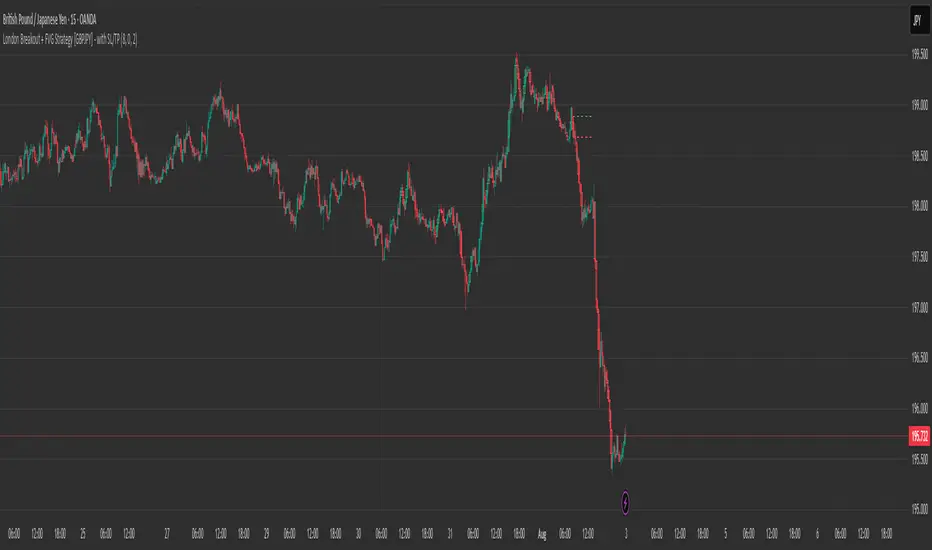
London Breakout + FVG Strategy [GBPJPY] - with SL/TPMarks the London open high and low on 15 min time frame, ads fvg on 5 min for orders
Mr. Posman Signal Scalping v2.0//@version=6
indicator('Mr. Posman Signal Scalping v2.0', overlay = true)
// === Input Parameter
macd_fast = input.int(12, title = 'MACD Fast')
macd_slow = input.int(26, title = 'MACD Slow')
macd_signal = input.int(9, title = 'MACD Signal')
rsi_length = input.int(14, title = 'RSI Length')
ema_fast_len = input.int(50, title = 'EMA 50')
ema_slow_len = input.int(200, title = 'EMA 200')
rsi_buy_level = input.int(40, title = 'RSI Buy Level')
rsi_sell_level = input.int(60, title = 'RSI Sell Level')
// === Indicator Calculation
= ta.macd(close, macd_fast, macd_slow, macd_signal)
rsi = ta.rsi(close, rsi_length)
ema_fast = ta.ema(close, ema_fast_len)
ema_slow = ta.ema(close, ema_slow_len)
// === Trend Filter
trend_up = ema_fast > ema_slow
trend_down = ema_fast < ema_slow
// === Sinyal Beli
buy_condition = ta.crossover(macdLine, signalLine) and rsi < rsi_buy_level and close > ema_fast and trend_up
// === Sinyal Jual
sell_condition = ta.crossunder(macdLine, signalLine) and rsi > rsi_sell_level and close < ema_fast and trend_down
// === Plot Sinyal
plotshape(buy_condition, title = 'BUY Signal', location = location.belowbar, color = color.lime, style = shape.labelup, text = 'BUY', textcolor = color.black)
plotshape(sell_condition, title = 'SELL Signal', location = location.abovebar, color = color.red, style = shape.labeldown, text = 'SELL', textcolor = color.white)
// === EMA Lines
plot(ema_fast, title = 'EMA 50', color = color.orange)
plot(ema_slow, title = 'EMA 200', color = color.teal)
// === Alerts
alertcondition(buy_condition, title = 'Buy Alert', message = 'Mr. Posman BUY Signal - BTC Scalping')
alertcondition(sell_condition, title = 'Sell Alert', message = 'Mr. Posman SELL Signal - BTC Scalping')

Chaos Volume Trend //Chaos Volume Trend不公开提供,请在网站 okx.tw 购买
//Chaos Volume Trend不公開提供,請在網站 okx.tw 購買
//Chaos Volume Trend is not publicly available. Please purchase it on the website okx.tw

BTC Scalping Signals//@version=5
indicator("BTC Scalping Signals", overlay=true)
// === Indikator Utama ===
= ta.macd(close, 12, 26, 9)
ema50 = ta.ema(close, 50)
ema200 = ta.ema(close, 200)
vol = volume
avgVol = ta.sma(vol, 20)
// === Filter Trend & Volume ===
bullTrend = ema50 > ema200
bearTrend = ema50 < ema200
volOK = vol > avgVol
// === Sinyal Scalping ===
buySignal = ta.crossover(macdLine, signalLine) and bullTrend and volOK
sellSignal = ta.crossunder(macdLine, signalLine) and bearTrend and volOK
// === Tampilkan Tanda di Chart ===
plotshape(buySignal, title="BUY", location=location.belowbar, style=shape.labelup, text="BUY", color=color.green, textcolor=color.white, size=size.small)
plotshape(sellSignal, title="SELL", location=location.abovebar, style=shape.labeldown, text="SELL", color=color.red, textcolor=color.white, size=size.small)
// === Tambahan Visual ===
plot(ema50, title="EMA 50", color=color.teal)
plot(ema200, title="EMA 200", color=color.orange)
// === Alert untuk Webhook / Telegram ===
alertcondition(buySignal, title="Scalp BUY Alert", message="SCALPING BTC - BUY at {{close}}")
alertcondition(sellSignal, title="Scalp SELL Alert", message="SCALPING BTC - SELL at {{close}}")

Ichimoku Cloud Buy & Custom EMA Exit [With Volume and Filters]1BUY STRATEGY USING ICHIMOKU CLOUD, Ichimoku Cloud Buy with good risk reward ratio

Relative Strength vs Nifty//@version=5
indicator("Relative Strength vs Nifty", overlay=false)
symbol = "NSE:NIFTY"
nifty_close = request.security(symbol, timeframe.period, close)
rs = close / nifty_close
plot(rs, title="Relative Strength", color=color.blue)

Fraktály a Trendovkyal shlash dlka sklhsda hasd klnasdnlkcalknacs 654 as64asd 65ads 156as 13ads 32asd 165as


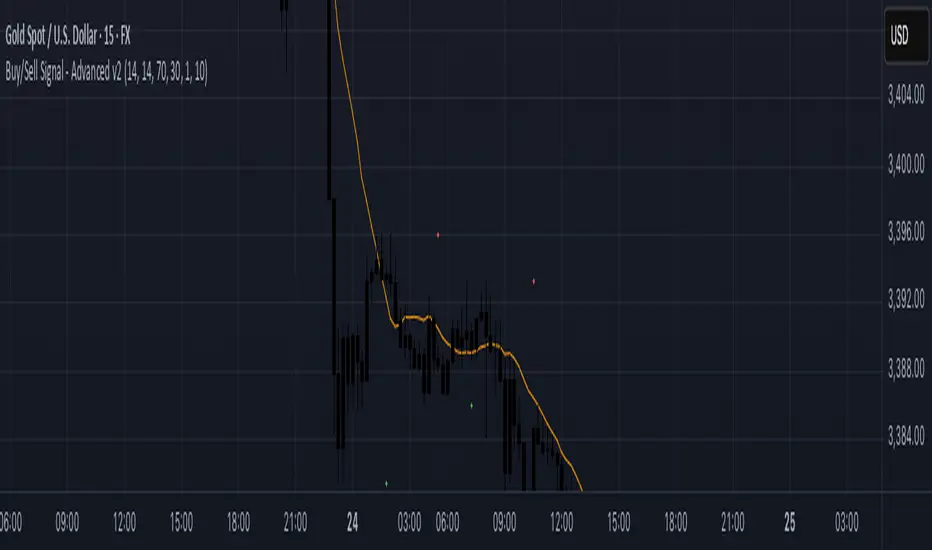
Buy/Sell Signal - Advanced v2The Buy/Sell Signal – Advanced v2 indicator is a powerful tool designed for traders who seek more reliable and filtered entries. This indicator combines classic technical analysis with modern enhancements to reduce noise and false signals. It generates Buy signals when a bullish candle closes above the 14-period Simple Moving Average (SMA), the RSI is below the oversold threshold (default: 30), and trading volume is higher than the 20-period average—indicating strong momentum and potential reversal from a discounted price zone. Conversely, a Sell signal appears when a bearish candle closes below the SMA, RSI is above the overbought level (default: 70), and volume exceeds its average—signaling potential weakness after a price rally.
In addition to entry signals, the indicator automatically plots dynamic support and resistance levels using pivot highs and lows. These levels help traders identify key zones for confirmation, breakout, or rejection. The SMA provides trend direction context, while the volume and RSI filters act as safeguards to avoid trading in low-quality conditions.
Ideal for scalpers and intraday traders on 5-minute to 1-hour timeframes, this indicator helps capture trend continuations and early reversals with confidence. For best results, use the signals in conjunction with multi-timeframe analysis and price action confirmation. This tool is especially effective on assets like XAUUSD, forex pairs, and indices.
SCTI-RSKSCTI-RSK 是一个多功能技术指标合集,整合了多种常用技术指标于一个图表中,方便交易者综合分析市场状况。该指标包含以下五个主要技术指标模块,每个模块都可以单独显示或隐藏:
Stoch RSI - 随机相对强弱指数
KDJ - 随机指标
RSI - 相对强弱指数
CCI - 商品通道指数
Williams %R - 威廉指标
主要特点
模块化设计:每个指标都可以单独开启或关闭显示
交叉信号可视化:Stoch RSI和KDJ的金叉/死叉信号有彩色填充标识
多时间框架分析:支持不同长度的参数设置
直观界面:清晰的参数分组和颜色区分
适用场景
趋势判断
超买超卖区域识别
交易信号确认
多指标共振分析
English Description
SCTI-RSK is a comprehensive technical indicator that combines multiple popular indicators into a single chart for traders to analyze market conditions holistically. The indicator includes the following five main technical indicator modules, each can be toggled on/off individually:
Stoch RSI - Stochastic Relative Strength Index
KDJ - Stochastic Oscillator
RSI - Relative Strength Index
CCI - Commodity Channel Index
Williams %R - Williams Percent Range
Key Features
Modular Design: Each indicator can be shown or hidden independently
Visual Crossover Signals: Golden/Death crosses are highlighted with color fills for Stoch RSI and KDJ
Multi-Timeframe Analysis: Supports different length parameters
Intuitive Interface: Clear parameter grouping and color differentiation
Use Cases
Trend identification
Overbought/Oversold zone recognition
Trade signal confirmation
Multi-indicator confluence analysis
参数说明 (Parameter Explanation)
指标参数分为6个主要组别:
基础指标设置 - 控制各指标的显示/隐藏
Stoch RSI 设置 - 包括K值、D值、RSI长度等参数
KDJ 设置 - 包括周期、信号线等参数
RSI 设置 - 包括RSI长度、中期长度等参数
CCI 设置 - 包括CCI长度、中期长度等参数
Williams %R 设置 - 包括长度参数
使用建议 (Usage Suggestions)
初次使用时,可以先开启所有指标观察它们的相互关系
根据个人交易风格调整各指标的长度参数
关注多指标同时发出信号时的交易机会
结合价格行为和其他分析工具确认信号
更新日志 (Changelog)
v1.0 初始版本,整合五大技术指标

Williams Alligator with Background ColoringThe Benefits of the Williams Alligator – Without the “Spaghetti” on Your Chart
If you're one of those traders who prefer a clean, well-structured chart but don't want to miss out on the advantages of the Williams Alligator, this script is the perfect solution.
It includes all the features of the original TradingView script plus a background color feature based on your custom parameters:
Green when all candles are above the Alligator lines
Red when all candles are below all lines
Gray for everything in between
Feel free to customize the colors and transparency to your liking.
Happy Trading!
Stock Table aiTrendviewProfessional Stock Market Monitoring Table (Pine Script v5)
This indicator is a real-time multi-asset monitoring table designed for professional traders, analysts, and portfolio managers using TradingView. Built with Pine Script v5, it enables users to track up to 10 instruments (stocks, indices, forex pairs, cryptocurrencies, or commodities) in a unified table embedded directly into the chart. It is intended to streamline portfolio monitoring, cross-market analysis, and rapid visual comparison of asset performance.
The core logic of this script involves retrieving live price data through TradingView’s request.security() function for each of the selected symbols. It calculates both absolute price change and percentage price change relative to the previous bar close. This ensures users can see real-time movements in each asset’s price. These calculations are updated at the close of every bar to optimize performance and reduce processing load using the barstate.islast condition.
The display structure is dynamically generated using table.new() and related functions. Internally, the script stores symbol and price data in arrays for efficient processing. Symbols are cleaned to remove exchange prefixes (e.g., "NASDAQ:", "BINANCE:") so only the ticker name is displayed. Based on the selected layout (1 to 5 columns), the table auto-adjusts its row structure to maintain clarity and symmetry. Each cell reflects the ticker symbol, current price, and changes, with conditional formatting applied to indicate price movement direction using green (positive), red (negative), or neutral colors.
Users can customize many visual elements including text size, color themes, transparency, table position, and whether headers are shown. The script includes built-in fallbacks for invalid symbols or empty data, ensuring robustness and uninterrupted performance during live market hours.
Use cases include:
Intraday traders monitoring multiple instruments simultaneously.
Swing traders assessing relative strength and correlation.
Portfolio managers scanning asset performance without switching charts.
Analysts preparing multi-asset presentations or watchlists.
To use the tool:
Paste the Pine Script into the Pine Editor.
Add the script to the chart.
Enter your desired symbols via the input fields.
Customize table position, layout, size, and color to suit your workspace.
This script does not provide trade signals or financial advice. It is purely a market visualization and data presentation tool. All calculations are based on live chart data and are synchronized with the chart’s timeframe.
Disclaimer from aiTrendview:
This script is a visual tool developed for market awareness and comparative observation. It does not constitute financial advice or guarantee trading results. aiTrendview and its affiliates are not responsible for any losses arising from decisions made based on this tool. All trading involves risk, and past performance is not indicative of future results. Always consult with a qualified financial advisor before making trading decisions.

HMM Adaptive BB & Regime Signals1. Install the Indicator
Open TradingView and load the chart for your chosen symbol.
Click the Pine Editor tab at the bottom.
Delete any existing code, paste in the full Pine Script.
Click Save, give it a name (e.g. “HMM Adaptive BB”), then click Add to Chart.
If the script compiles correctly, you’ll immediately see:
An orange upper/lower Bollinger-style channel
A blue SMA basis line
Shaded background indicating the current regime

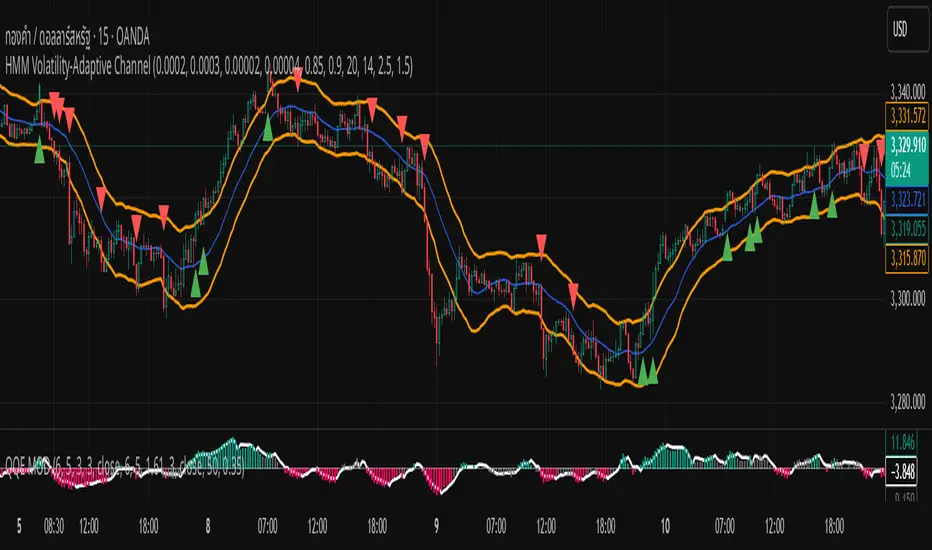
HMM Volatility-Adaptive ChannelChannel Lines (orange)
Upper = SMA + ATR × dynamic multiplier
Lower = SMA − ATR × dynamic multiplier
Background Shade
Light green = High-Volatility regime (pₕ > 0.5)
Light red = Low-Volatility regime (pₕ ≤ 0.5)
Breakout Signals
BUY marker (▲) when close crosses above the upper line
SELL marker (▼) when close crosses below the lower line