AO/AC Zones (Log Price)William's AO/AC Zones scaled to work with log-price AO/AC indicators.
When the log AO and log AC are green = price bar is painted green
When the log AO and log AC are different = price bar painted gray
When the log AO and log AC are red = price bar painted red
Useful for seeing when momentum is beginning to increase or decrease, and direction on the AO/AC could be changing. Can also be used with William's standard entry and exit signals. Works with the log indicators, made for volatile and long-term charts which exhibit logarithmic trends.
Bill Williams Indicators

TLP Swing Chart V2thanks
// This source code is subject to the terms of the Mozilla Public License 2.0 at mozilla.org
// Sửa đổi trên code gốc của © meomeo105
// © meomeo105
//@version=5
indicator('TLP Swing Chart V2', shorttitle='TLP Swing V2', overlay=true, max_lines_count=500)
//-----Input-------
customTF = input.timeframe(defval="",title = "Show Other TimeFrame")
showTLP = input.bool(false, 'Show TLP', inline = "TLP1")
colorTLP = input.color(color.aqua, '', inline = "TLP1")
showSTLP = input.bool(true, 'Show TLP Swing', inline = "Swing1")
colorSTLP = input.color(color.aqua, '', inline = "Swing1")
showLabel = input.bool(true, 'Show Label TimeFrame')
lineSTLP = input.string(title="",options= ,defval="(─)", inline = "Swing1")
lineStyleSTLP = lineSTLP == "(┈)" ? line.style_dotted : lineSTLP == "(╌)" ? line.style_dashed : line.style_solid
//IOSB
IOSB = "TLPInOutSideBarSetting"
ISB = input(true,group =IOSB, title="showISB")
colorISB = input.color(color.rgb(250, 171, 0), inline = "ISB")
OSB = input(true,group =IOSB, title="showOSB")
colorOSB = input.color(color.rgb(56, 219, 255), inline = "OSB")
ZoneColor = input(defval = color.new(color.orange, 90),group =IOSB, title = "Background Color")
BorderColor = input(defval = color.new(color.orange, 100),group =IOSB, title = "Border Color")
/////////////////
var aCZ = array.new_float(0)
float highest = high
float lowest = low
if (array.size(aCZ) > 0)
highest := array.get(aCZ, 0)
lowest := array.get(aCZ, 1)
insideBarCondtion = low >= lowest and low <= highest and high >= lowest and high <= highest
if ( insideBarCondtion == true )
array.push(aCZ, high )
array.push(aCZ, low )
if( array.size(aCZ) >= 2 and insideBarCondtion == false )
float maxCZ = array.max(aCZ)
float minCZ = array.min(aCZ)
box.new(bar_index - (array.size(aCZ) / 2) - 1, maxCZ, bar_index - 1, minCZ, bgcolor = ZoneColor, border_color = BorderColor)
array.clear(aCZ)
//////////////////////////Global//////////////////////////
var arrayLineTemp = array.new_line()
// Funtion
f_resInMinutes() =>
_resInMinutes = timeframe.multiplier * (
timeframe.isseconds ? 1. / 60. :
timeframe.isminutes ? 1. :
timeframe.isdaily ? 1440. :
timeframe.isweekly ? 10080. :
timeframe.ismonthly ? 43800. : na)
// Converts a resolution expressed in minutes into a string usable by "security()"
f_resFromMinutes(_minutes) =>
_minutes < 1 ? str.tostring(math.round(_minutes*60)) + "S" :
_minutes < 60 ? str.tostring(math.round(_minutes)) + "m" :
_minutes < 1440 ? str.tostring(math.round(_minutes/60)) + "H" :
_minutes < 10080 ? str.tostring(math.round(math.min(_minutes / 1440, 7))) + "D" :
_minutes < 43800 ? str.tostring(math.round(math.min(_minutes / 10080, 4))) + "W" :
str.tostring(math.round(math.min(_minutes / 43800, 12))) + "M"
f_tfRes(_res,_exp) =>
request.security(syminfo.tickerid,_res,_exp,lookahead=barmerge.lookahead_on)
var label labelError = label.new(bar_index, high, text = "", color = #00000000, textcolor = color.white,textalign = text.align_left)
sendError(_mmessage) =>
label.set_xy(labelError, bar_index + 3, close )
label.set_text(labelError, _mmessage)
var arrayLineChoCh = array.new_line()
var label labelTF = label.new(time, close, text = "",color = color.new(showSTLP ? colorSTLP : colorTLP,95), textcolor = showSTLP ? colorSTLP : colorTLP,xloc = xloc.bar_time, textalign = text.align_left)
//////////////////////////TLP//////////////////////////
var arrayXTLP = array.new_int(5,time)
var arrayYTLP = array.new_float(5,close)
var arrayLineTLP = array.new_line()
int drawLineTLP = 0
_high = high
_low = low
_close = close
_open = open
if(customTF != timeframe.period)
_high := f_tfRes(customTF,high)
_low := f_tfRes(customTF,low)
_close := f_tfRes(customTF,close)
_open := f_tfRes(customTF,open)
highPrev = _high
lowPrev = _low
// drawLineTLP => 2:Tiếp tục 1:Đảo chiều; // Outsidebar 2:Tiếp tục 3:Tiếp tục và Đảo chiều 4 : Đảo chiều 2 lần
drawLineTLP := 0
if(_high > highPrev and _low > lowPrev )
if(array.get(arrayYTLP,0) > array.get(arrayYTLP,1))
if(_high <= high)
array.set(arrayXTLP, 0, time)
array.set(arrayYTLP, 0, _high )
drawLineTLP := 2
else
array.unshift(arrayXTLP,time)
array.unshift(arrayYTLP,_high )
drawLineTLP := 1
else if(_high < highPrev and _low < lowPrev )
if(array.get(arrayYTLP,0) > array.get(arrayYTLP,1))
array.unshift(arrayXTLP,time)
array.unshift(arrayYTLP,_low )
drawLineTLP := 1
else
if(_low >= low)
array.set(arrayXTLP, 0, time)
array.set(arrayYTLP, 0, _low )
drawLineTLP := 2
else if(_high >= highPrev and _low < lowPrev or _high > highPrev and _low <= lowPrev )
if(array.get(arrayYTLP,0) > array.get(arrayYTLP,1))
if(_high >= array.get(arrayYTLP,0) and array.get(arrayYTLP,1) < _low )
if(_high <= high)
array.set(arrayXTLP, 0, time)
array.set(arrayYTLP, 0, _high )
drawLineTLP := 2
else if(_high >= array.get(arrayYTLP,0) and array.get(arrayYTLP,1) > _low )
if(_close < _open)
if(_high <= high)
array.set(arrayXTLP, 0, time)
array.set(arrayYTLP, 0, _high )
array.unshift(arrayXTLP,time)
array.unshift(arrayYTLP,_low )
drawLineTLP := 3
else
array.unshift(arrayXTLP,time)
array.unshift(arrayYTLP,_low )
array.unshift(arrayXTLP,time)
array.unshift(arrayYTLP,_high )
drawLineTLP := 4
else if(array.get(arrayYTLP,0) < array.get(arrayYTLP,1))
if(_low <= array.get(arrayYTLP,0) and _high < array.get(arrayYTLP,1))
if(_low >= low)
array.set(arrayXTLP, 0, time)
array.set(arrayYTLP, 0, _low )
drawLineTLP := 2
else if(_low <= array.get(arrayYTLP,0) and _high > array.get(arrayYTLP,1))
if(_close > _open)
if(_low >= low)
array.set(arrayXTLP, 0, time)
array.set(arrayYTLP, 0, _low )
array.unshift(arrayXTLP,time)
array.unshift(arrayYTLP,_high )
drawLineTLP := 3
else
array.unshift(arrayXTLP,time)
array.unshift(arrayYTLP,_high )
array.unshift(arrayXTLP,time)
array.unshift(arrayYTLP,_low )
drawLineTLP := 4
else if((_high <= highPrev and _low >= lowPrev ))
highPrev := highPrev
lowPrev := lowPrev
if(f_resInMinutes() < f_tfRes(customTF,f_resInMinutes()) and drawLineTLP == 0)
if(array.get(arrayYTLP,0) > array.get(arrayYTLP,1))
if(array.get(arrayYTLP,0) <= high)
array.set(arrayXTLP, 0, time)
drawLineTLP := 2
else
if(array.get(arrayYTLP,0) >= low)
array.set(arrayXTLP, 0, time)
drawLineTLP := 2
if((showSTLP or showTLP) and f_resInMinutes() <= f_tfRes(customTF,f_resInMinutes()))
if(drawLineTLP == 2)
if(array.size(arrayLineTLP) >0)
line.set_xy2(array.get(arrayLineTLP,0),array.get(arrayXTLP,0),array.get(arrayYTLP,0))
else
array.unshift(arrayLineTLP,line.new(array.get(arrayXTLP,1),array.get(arrayYTLP,1),array.get(arrayXTLP,0),array.get(arrayYTLP,0), color = colorTLP,xloc = xloc.bar_time, style = lineStyleSTLP))
else if(drawLineTLP == 1)
array.unshift(arrayLineTLP,line.new(array.get(arrayXTLP,1),array.get(arrayYTLP,1),array.get(arrayXTLP,0),array.get(arrayYTLP,0), color = colorTLP,xloc = xloc.bar_time, style = lineStyleSTLP))
else if(drawLineTLP == 3)
if(array.size(arrayLineTLP) >0)
line.set_xy2(array.get(arrayLineTLP,0),array.get(arrayXTLP,1),array.get(arrayYTLP,1))
else
array.unshift(arrayLineTLP,line.new(array.get(arrayXTLP,2),array.get(arrayYTLP,2),array.get(arrayXTLP,1),array.get(arrayYTLP,1), color = colorTLP,xloc = xloc.bar_time, style = lineStyleSTLP))
array.unshift(arrayLineTLP,line.new(array.get(arrayXTLP,1),array.get(arrayYTLP,1),array.get(arrayXTLP,0),array.get(arrayYTLP,0), color = colorTLP,xloc = xloc.bar_time, style = lineStyleSTLP))
else if(drawLineTLP == 4)
array.unshift(arrayLineTLP,line.new(array.get(arrayXTLP,2),array.get(arrayYTLP,2),array.get(arrayXTLP,1),array.get(arrayYTLP,1), color = colorTLP,xloc = xloc.bar_time, style = lineStyleSTLP))
array.unshift(arrayLineTLP,line.new(array.get(arrayXTLP,1),array.get(arrayYTLP,1),array.get(arrayXTLP,0),array.get(arrayYTLP,0), color = colorTLP,xloc = xloc.bar_time, style = lineStyleSTLP))
//////////////////////////Swing TLP//////////////////////////
var arrayXSTLP = array.new_int(5,time)
var arrayYSTLP = array.new_float(5,close)
var arrayLineSTLP = array.new_line()
int drawLineSTLP = 0
int drawLineSTLP1 = 0
if(showSTLP)
if(math.max(array.get(arrayYSTLP,0),array.get(arrayYSTLP,1)) < math.min(array.get(arrayYTLP,0),array.get(arrayYTLP,1)) or math.min(array.get(arrayYSTLP,0),array.get(arrayYSTLP,1)) > math.max(array.get(arrayYTLP,0),array.get(arrayYTLP,1)))
//Khởi tạo bắt đầu
drawLineSTLP1 := 5
array.set(arrayXSTLP, 0, array.get(arrayXTLP,1))
array.set(arrayYSTLP, 0, array.get(arrayYTLP,1))
array.unshift(arrayXSTLP,array.get(arrayXTLP,0))
array.unshift(arrayYSTLP,array.get(arrayYTLP,0))
// drawLineSTLP kiểm tra điểm 1 => 13:Tiếp tục có sóng hồi // 12|19(reDraw):Tiếp tục không có sóng hồi // 14:Đảo chiều
if(array.get(arrayXTLP,0) == array.get(arrayXTLP,1))
if(array.get(arrayXSTLP,0) >= array.get(arrayXTLP,2) and array.get(arrayYSTLP,0) != array.get(arrayYTLP,1) and ((array.get(arrayYTLP,1) > array.get(arrayYTLP,2) and array.get(arrayYSTLP,0) > array.get(arrayYSTLP,1)) or (array.get(arrayYTLP,1) < array.get(arrayYTLP,2) and array.get(arrayYSTLP,0) < array.get(arrayYSTLP,1))))
drawLineSTLP1 := 12
array.set(arrayXSTLP, 0, array.get(arrayXTLP,1))
array.set(arrayYSTLP, 0, array.get(arrayYTLP,1))
else if(array.get(arrayXSTLP,0) <= array.get(arrayXTLP,2))
if((array.get(arrayYSTLP,0) > array.get(arrayYSTLP,1) and array.get(arrayYTLP,1) < array.get(arrayYSTLP,1)) or (array.get(arrayYSTLP,0) < array.get(arrayYSTLP,1) and array.get(arrayYTLP,1) > array.get(arrayYSTLP,1)))
drawLineSTLP1 := 14
array.unshift(arrayXSTLP,array.get(arrayXTLP,1))
array.unshift(arrayYSTLP,array.get(arrayYTLP,1))
else if((array.get(arrayYSTLP,0) > array.get(arrayYSTLP,1) and array.get(arrayYTLP,1) > array.get(arrayYSTLP,0)) or (array.get(arrayYSTLP,0) < array.get(arrayYSTLP,1) and array.get(arrayYTLP,1) < array.get(arrayYSTLP,0)))
drawLineSTLP1 := 13
_max = math.min(array.get(arrayYSTLP,0),array.get(arrayYSTLP,1))
_min = math.max(array.get(arrayYSTLP,0),array.get(arrayYSTLP,1))
_max_idx = 0
_min_idx = 0
for i = 2 to array.size(arrayXTLP)
if(array.get(arrayXSTLP,0) >= array.get(arrayXTLP,i))
break
if(_min > array.get(arrayYTLP,i))
_min := array.get(arrayYTLP,i)
_min_idx := array.get(arrayXTLP,i)
if(_max < array.get(arrayYTLP,i))
_max := array.get(arrayYTLP,i)
_max_idx := array.get(arrayXTLP,i)
if(array.get(arrayYSTLP,0) > array.get(arrayYSTLP,1))
array.unshift(arrayXSTLP,_min_idx)
array.unshift(arrayYSTLP,_min)
else if(array.get(arrayYSTLP,0) < array.get(arrayYSTLP,1))
array.unshift(arrayXSTLP,_max_idx)
array.unshift(arrayYSTLP,_max)
array.unshift(arrayXSTLP,array.get(arrayXTLP,1))
array.unshift(arrayYSTLP,array.get(arrayYTLP,1))
if(f_resInMinutes() < f_tfRes(customTF,f_resInMinutes()))
if(array.get(arrayYSTLP,0) == array.get(arrayYTLP,1) and array.get(arrayXSTLP,0) != array.get(arrayXTLP,1))
array.set(arrayXSTLP, 0, array.get(arrayXTLP,1))
drawLineSTLP1 := 19
if(f_resInMinutes() <= f_tfRes(customTF,f_resInMinutes()))
if(drawLineSTLP1 == 12 or drawLineSTLP1 == 19)
if(array.size(arrayLineSTLP) >0)
line.set_xy2(array.get(arrayLineSTLP,0),array.get(arrayXSTLP,0),array.get(arrayYSTLP,0))
else
array.unshift(arrayLineSTLP,line.new(array.get(arrayXSTLP,1),array.get(arrayYSTLP,1),array.get(arrayXSTLP,0),array.get(arrayYSTLP,0), color = colorSTLP,xloc = xloc.bar_time))
else if(drawLineSTLP1 == 14)
array.unshift(arrayLineSTLP,line.new(array.get(arrayXSTLP,1),array.get(arrayYSTLP,1),array.get(arrayXSTLP,0),array.get(arrayYSTLP,0), color = colorSTLP,xloc = xloc.bar_time))
else if(drawLineSTLP1 == 13)
array.unshift(arrayLineSTLP,line.new(array.get(arrayXSTLP,2),array.get(arrayYSTLP,2),array.get(arrayXSTLP,1),array.get(arrayYSTLP,1), color = colorSTLP,xloc = xloc.bar_time))
array.unshift(arrayLineSTLP,line.new(array.get(arrayXSTLP,1),array.get(arrayYSTLP,1),array.get(arrayXSTLP,0),array.get(arrayYSTLP,0), color = colorSTLP,xloc = xloc.bar_time))
else if(drawLineSTLP1 == 15)
if(array.size(arrayLineSTLP) >0)
line.set_xy2(array.get(arrayLineSTLP,0),array.get(arrayXSTLP,1),array.get(arrayYSTLP,1))
else
array.unshift(arrayLineSTLP,line.new(array.get(arrayXSTLP,2),array.get(arrayYSTLP,2),array.get(arrayXSTLP,1),array.get(arrayYSTLP,1), color = colorSTLP,xloc = xloc.bar_time))
array.unshift(arrayLineSTLP,line.new(array.get(arrayXSTLP,1),array.get(arrayYSTLP,1),array.get(arrayXSTLP,0),array.get(arrayYSTLP,0), color = colorSTLP,xloc = xloc.bar_time))
// drawLineSTLP kiểm tra điểm 0 => 3:Tiếp tục có sóng hồi // 2|9(reDraw):Tiếp tục không có sóng hồi // 4:Đảo chiều
if(array.get(arrayXSTLP,0) >= array.get(arrayXTLP,1) and array.get(arrayYSTLP,0) != array.get(arrayYTLP,0) and ((array.get(arrayYTLP,0) > array.get(arrayYTLP,1) and array.get(arrayYSTLP,0) > array.get(arrayYSTLP,1)) or (array.get(arrayYTLP,0) < array.get(arrayYTLP,1) and array.get(arrayYSTLP,0) < array.get(arrayYSTLP,1))))
drawLineSTLP := 2
array.set(arrayXSTLP, 0, array.get(arrayXTLP,0))
array.set(arrayYSTLP, 0, array.get(arrayYTLP,0))
else if(array.get(arrayXSTLP,0) <= array.get(arrayXTLP,1))
if((array.get(arrayYSTLP,0) > array.get(arrayYSTLP,1) and array.get(arrayYTLP,0) < array.get(arrayYSTLP,1)) or (array.get(arrayYSTLP,0) < array.get(arrayYSTLP,1) and array.get(arrayYTLP,0) > array.get(arrayYSTLP,1)))
drawLineSTLP := 4
array.unshift(arrayXSTLP,array.get(arrayXTLP,0))
array.unshift(arrayYSTLP,array.get(arrayYTLP,0))
else if((array.get(arrayYSTLP,0) > array.get(arrayYSTLP,1) and array.get(arrayYTLP,0) > array.get(arrayYSTLP,0)) or (array.get(arrayYSTLP,0) < array.get(arrayYSTLP,1) and array.get(arrayYTLP,0) < array.get(arrayYSTLP,0)))
drawLineSTLP := 3
_max = math.min(array.get(arrayYSTLP,0),array.get(arrayYSTLP,1))
_min = math.max(array.get(arrayYSTLP,0),array.get(arrayYSTLP,1))
_max_idx = 0
_min_idx = 0
for i = 1 to array.size(arrayXTLP)
if(array.get(arrayXSTLP,0) >= array.get(arrayXTLP,i))
break
if(_min > array.get(arrayYTLP,i))
_min := array.get(arrayYTLP,i)
_min_idx := array.get(arrayXTLP,i)
if(_max < array.get(arrayYTLP,i))
_max := array.get(arrayYTLP,i)
_max_idx := array.get(arrayXTLP,i)
if(array.get(arrayYSTLP,0) > array.get(arrayYSTLP,1))
array.unshift(arrayXSTLP,_min_idx)
array.unshift(arrayYSTLP,_min)
else if(array.get(arrayYSTLP,0) < array.get(arrayYSTLP,1))
array.unshift(arrayXSTLP,_max_idx)
array.unshift(arrayYSTLP,_max)
array.unshift(arrayXSTLP,array.get(arrayXTLP,0))
array.unshift(arrayYSTLP,array.get(arrayYTLP,0))
if(f_resInMinutes() < f_tfRes(customTF,f_resInMinutes()))
if(array.get(arrayYSTLP,0) == array.get(arrayYTLP,0) and array.get(arrayXSTLP,0) != array.get(arrayXTLP,0))
array.set(arrayXSTLP, 0, array.get(arrayXTLP,0))
drawLineSTLP := 9
if(f_resInMinutes() <= f_tfRes(customTF,f_resInMinutes()))
if(drawLineSTLP == 2 or drawLineSTLP == 9)
if(array.size(arrayLineSTLP) >0)
line.set_xy2(array.get(arrayLineSTLP,0),array.get(arrayXSTLP,0),array.get(arrayYSTLP,0))
else
array.unshift(arrayLineSTLP,line.new(array.get(arrayXSTLP,1),array.get(arrayYSTLP,1),array.get(arrayXSTLP,0),array.get(arrayYSTLP,0), color = colorSTLP,xloc = xloc.bar_time))
else if(drawLineSTLP == 4)
array.unshift(arrayLineSTLP,line.new(array.get(arrayXSTLP,1),array.get(arrayYSTLP,1),array.get(arrayXSTLP,0),array.get(arrayYSTLP,0), color = colorSTLP,xloc = xloc.bar_time))
else if(drawLineSTLP == 3)
array.unshift(arrayLineSTLP,line.new(array.get(arrayXSTLP,2),array.get(arrayYSTLP,2),array.get(arrayXSTLP,1),array.get(arrayYSTLP,1), color = colorSTLP,xloc = xloc.bar_time))
array.unshift(arrayLineSTLP,line.new(array.get(arrayXSTLP,1),array.get(arrayYSTLP,1),array.get(arrayXSTLP,0),array.get(arrayYSTLP,0), color = colorSTLP,xloc = xloc.bar_time))
else if(drawLineSTLP == 5)
if(array.size(arrayLineSTLP) >0)
line.set_xy2(array.get(arrayLineSTLP,0),array.get(arrayXSTLP,1),array.get(arrayYSTLP,1))
else
array.unshift(arrayLineSTLP,line.new(array.get(arrayXSTLP,2),array.get(arrayYSTLP,2),array.get(arrayXSTLP,1),array.get(arrayYSTLP,1), color = colorSTLP,xloc = xloc.bar_time))
array.unshift(arrayLineSTLP,line.new(array.get(arrayXSTLP,1),array.get(arrayYSTLP,1),array.get(arrayXSTLP,0),array.get(arrayYSTLP,0), color = colorSTLP,xloc = xloc.bar_time))
///////////////////////Other//////////////////////////////////
if(f_resInMinutes() <= f_tfRes(customTF,f_resInMinutes()))
if(showSTLP)
if(showLabel and (barstate.islast or barstate.islastconfirmedhistory))
texLabel = f_resInMinutes() == f_tfRes(customTF,f_resInMinutes()) ? f_resFromMinutes(f_resInMinutes()) : f_resFromMinutes(f_tfRes(customTF,f_resInMinutes()))
label.set_xy(labelTF,array.get(arrayXSTLP,0),array.get(arrayYSTLP,0))
label.set_text(labelTF,texLabel)
label.set_style(labelTF,array.get(arrayYSTLP,0) < array.get(arrayYSTLP,1) ? label.style_label_upper_right : label.style_label_lower_right)
if(not showTLP)
arrayLineTemp := array.copy(arrayLineTLP)
for itemArray in arrayLineTemp
if(line.get_x1(itemArray) < array.get(arrayXSTLP,0))
line.delete(itemArray)
array.remove(arrayLineTLP,array.indexof(arrayLineTLP, itemArray))
//Inside Bars - Outside Bars
insideBar() => ISB and high <= high and low >= low ? 1 : 0
outsideBar() => OSB and (high > high and low < low ) ? 1 : 0
//Inside and Outside Bars
barcolor(insideBar() ? color.new(colorISB,0) : na )
barcolor(outsideBar() ? color.new(colorOSB,0) : na )

Smart Volatility Squeeze + Trend Filter📌 Purpose
This indicator detects volatility squeeze conditions when Bollinger Bands contract inside Keltner Channels and signals potential breakout opportunities.
It also includes an optional EMA-based trend filter to align signals with the dominant market direction.
🧠 How It Works
1. Squeeze Condition
Bollinger Bands (BB): Length = 20, StdDev = 2.0 (default)
Keltner Channels (KC): EMA Length = 20, ATR Multiplier = 1.5 (default)
Squeeze ON: Occurs when BB Upper < KC Upper and BB Lower > KC Lower (low volatility zone).
2. Breakout Signals
Long Breakout: Price crosses above BB Upper after squeeze.
Short Breakout: Price crosses below BB Lower after squeeze.
3. Trend Filter (optional)
EMA(50) used to confirm breakout direction:
Long signals allowed only if price > EMA(50)
Short signals allowed only if price < EMA(50)
Toggle Use Trend Filter to enable/disable.
4. Visual & Alerts
Green circle at chart bottom indicates Squeeze ON.
Green/Red triangles mark breakouts.
Background gradually brightens during squeeze buildup.
Alerts available for long and short breakouts.
📈 How to Use
Look for Squeeze ON → then wait for breakout arrows.
Trade in breakout direction, preferably with trend filter ON.
Works best on higher timeframes (1h, 4h, D) and trending markets.
Markets: Crypto, Forex, Stocks — effective in volatile assets.
⚙️ Inputs
BB Length / StdDev
KC EMA Length / ATR Multiplier
Use Trend Filter
Trend EMA Length
⚠️ Disclaimer
This script is for educational purposes only. It does not constitute financial advice.
Always test thoroughly before live trading.

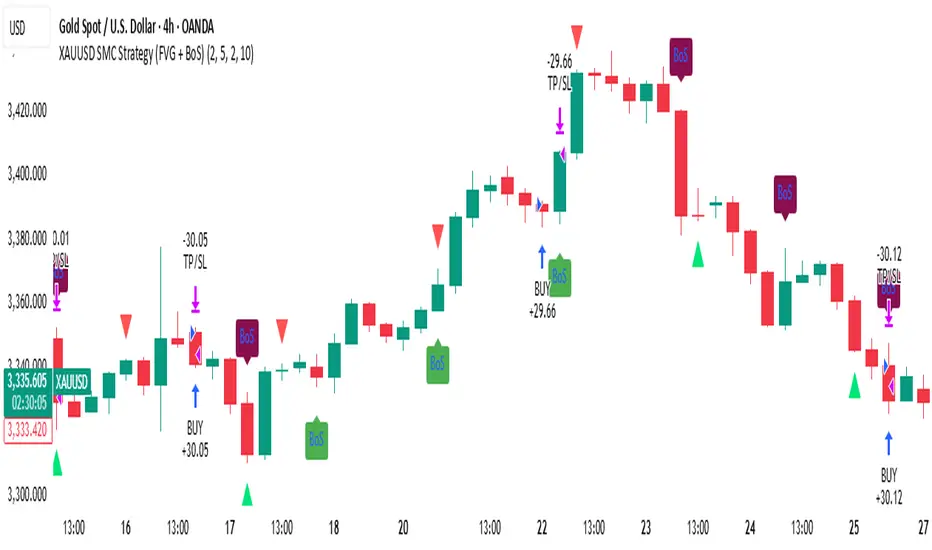
XAUUSD SMC Strategy (FVG + BoS)This advanced TradingView strategy is built for serious traders who follow Smart Money Concepts (SMC), with a special focus on Fair Value Gaps (FVG) and Break of Structure (BoS). The script automates trade entries and visual signals based on clean price action, while also allowing for performance backtesting through the built-in Strategy Tester.
The purpose of this script is to combine high-probability SMC signals with a clear and flexible backtest engine. Traders can visually confirm institutional moves (like imbalances and structure breaks) while simultaneously analyzing strategy performance, risk-reward, and execution logic — all from one chart.
⚙️ Key Features
FVG Detection: Automatically identifies bullish and bearish fair value gaps, highlighting imbalance zones between institutional buying and selling activity.
Break of Structure (BoS): Clearly shows bullish and bearish structure breaks, helping traders confirm directional bias and spot trend shifts with clarity.
Trade Execution Logic: Designed with actual strategy.entry() and strategy.exit() functions, this script simulates trades using risk-controlled logic with stop loss and take profit targeting.
Spaced Signal Visualization: Avoids chart clutter by spacing FVG and BoS signals, making the visual output clean and readable — even on fast-moving charts like XAUUSD.
Risk-Reward Customization: Easily set your own risk:reward ratio and stop-loss buffer, ensuring each trade is simulated according to your personal strategy or trading plan.
Cool-Down System: Add a delay between trades using the “Bars Between Trades” setting to prevent overtrading during volatile periods.
Live and Historical Insights: Signals appear in real-time, while also being plotted historically — making it easy to scroll back and study how the market behaved under this logic.
Fully Editable Parameters: Customize FVG size, structure lookback, spacing intervals, and more to fit your unique interpretation of SMC methodology.
🧠 How It Works
This strategy combines two key concepts:
FVG (Fair Value Gaps): Price zones where the market moved too quickly and left an imbalance between buyers and sellers. These gaps often act as magnets for price or areas of reversal.
BoS (Break of Structure): Points where the price breaks through a significant high or low, indicating a potential shift in market direction.
When both FVG and BoS align under certain conditions — and the cooldown requirement is satisfied — the strategy places a trade. A take profit and stop loss are automatically applied based on your inputs.
📈 Practical Use Cases
Trend Confirmation: Use BoS signals to validate trend continuation trades, especially when FVG confirms the imbalance.
Reversal Zones: Spot potential turning points when price fills an FVG and breaks previous structure in the opposite direction.
Backtest SMC Logic: Validate your theory by testing this strategy over historical XAUUSD data using real stop loss / take profit logic.
Refine Entry Timing: Study how structure breaks and FVGs align in different timeframes to improve entry precision.
💡 Best For
Traders learning or mastering Smart Money Concepts
Price action purists who avoid indicators
XAUUSD scalpers, day traders, or swing traders
Strategy developers who want visual + backtested confirmation
📌 Notes
The default strategy places trades every 10 candles to ensure the engine runs — replace this with your refined FVG + BoS logic as needed.
Works best on Gold (XAUUSD) 4H, 1H, or 15m timeframes depending on volatility and structure spacing.
🔒 Disclaimer
This strategy is for educational purposes only. It does not constitute financial advice. Always test and validate any trading logic before applying it to a live market. Trading carries risk — use proper risk management.
BB + RSI Strategy Optimized✅ Pine Script Version 5
✅ Complete Strategy: Long + Short
✅ Automatic Entry and Exit
✅ Visual Signals: Buy/Sell, Short/Cover
✅ Trailing Take Profit
✅ Progressive

William's Accelerator Oscillator (AC) - Log-ScaledA 5-34-5 MACD histogram, aka William's Accelerator Oscillator, scaled to log-price.
Useful for seeing the change in the speed of the momentum, particularly within the log-scaled AO. Works better than the original (non log) AC for long-term and volatile price action which exhibits logarithmic growth trends.
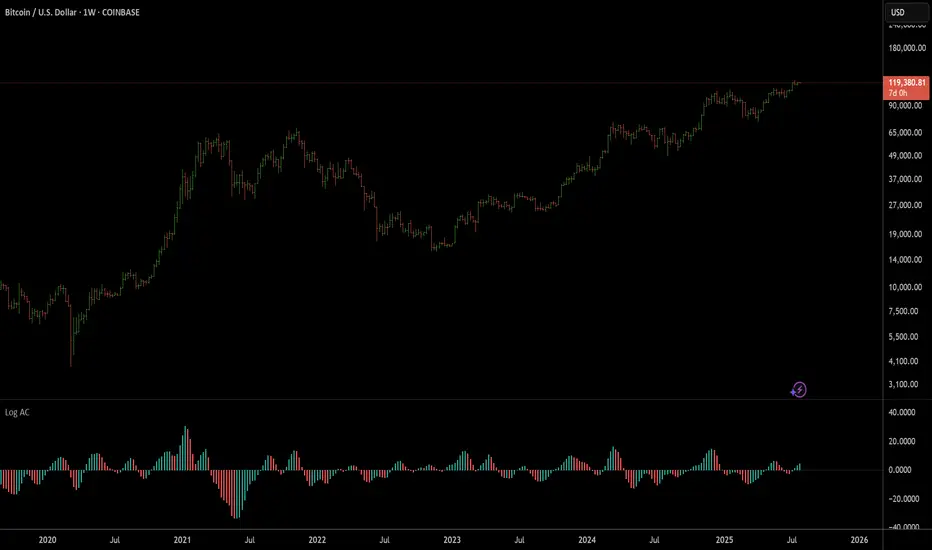
William's Awesome Oscillator (AO) - Log-scaledA 5-34-5 MACD plotted as a histogram, aka William's Awesome Oscillator (AO), scaled to log price.
Useful for finding momentum divergences in volatile and long-term price charts which show logarithmic trends. As you can see compared to the original (not log) AO indicator, it follows the momentum on the log-scaled price chart much more closely.

🧠 Blackbox Alpha v6 (Buy/Sell Only)Blackbox Alpha v6 Strategy – Institutional-Grade Intraday Trading
Overview:
The Blackbox Alpha v6 is a precision-engineered intraday trading strategy inspired by the world's top 0.1% traders — including philosophies from Jim Simons, Mark Minervini, Stefan Salomon, and Stanley Druckenmiller. It is designed to deliver ultra-high-probability Buy/Sell signals by using a multi-layered confirmation model that runs entirely in the background. Only confirmed signals appear on the chart – no noise, no clutter.
🔍 Core Strategy Logic
This strategy generates a Buy or Sell entry only when all of the following conditions are met:
✅ Trend Confirmation
EMA 20 > EMA 50 (bullish trend)
ADX > 20 (trend strength)
RSI confirms momentum direction
📊 Volume Validation
Volume spike above 20-period average × multiplier
Volume Climax (highest volume in last 10 candles)
Relative Volume Index (RVI) > 1.5
🎯 Price Structure + Pattern Recognition
Price near Fibonacci retracement zones (0.382 for Buy, 0.618 for Sell)
Bullish/Bearish engulfing candle pattern as trigger
🧠 Institutional Bias
Price must be above Anchored VWAP (Buy) or below (Sell)
Must be within predefined order block zones (smart money behavior)
📈 Signal Behavior
Buy Signal: Only appears when all trend, volume, price action, and institutional filters confirm.
Sell Signal: Same logic, mirrored for bearish market conditions.
Visualization: Minimalist – only Buy (green triangle) and Sell (red triangle) arrows.
🧪 Backtest Engine
Fully integrated with strategy.entry, strategy.close, stop and limit execution logic
User-configurable stop-loss and take-profit in %
Optimized for 15m, 1h, and 1D charts
🚀 Performance Philosophy
Rather than generating many signals, this strategy targets very selective, high-probability trades with asymmetric reward-to-risk opportunities — exactly like institutional traders and quant funds.
Ideal for traders seeking signal precision > signal frequency.

30M Scalping Strategy with Debug LogsWhat’s changed
Spot‑only: all short logic removed—only long entries and exits are generated.
Logging: uses log.info() to send entry/exit details (timestamp, price, ATR, RSI) to the Pine Logs console.
Clean & concise: core scalp logic (EMAs, RSI, MACD, volume, ATR SL/TP) remains intact.

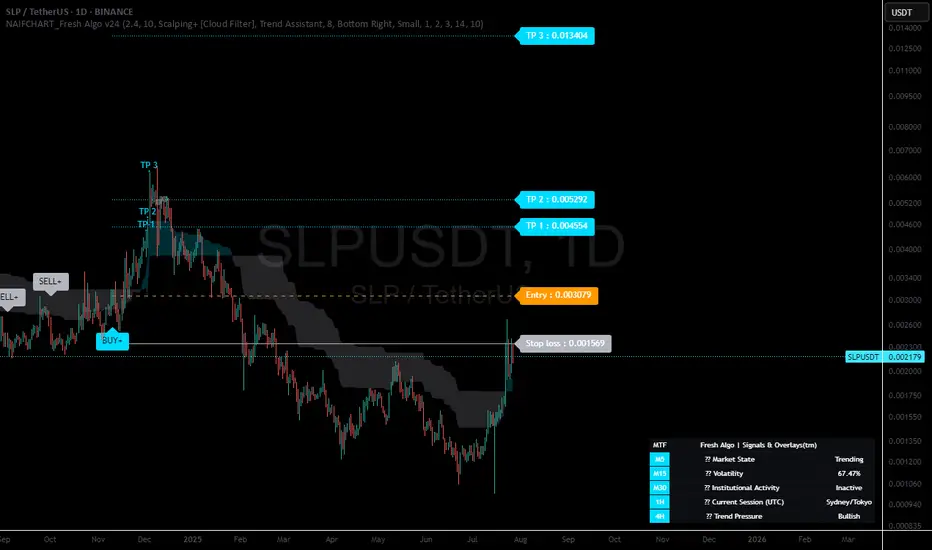
NAIFCHART_Fresh Algo v24# NAIFCHART Fresh Algo v24: Advanced Multi-Mode Trading System Analysis
I recently discovered this sophisticated trading system through the active community at t.me and wanted to share a detailed analysis of the NAIFCHART Fresh Algo v24 indicator. This represents an advanced evolution of multi-component trading systems that adapts to various market conditions through sophisticated operational configurations and enhanced analytical capabilities.
## Primary Signal Generation Framework
The Fresh Algo v24 operates through two fundamental signal generation approaches that accommodate different market perspectives and trading philosophies. The Trending Signals Mode serves as the primary trend-following mechanism, combining Wave Trend Oscillator analysis with Supertrend directional signals and Squeeze Momentum breakout detection. This mode incorporates ADX filtering that requires values exceeding 20 to ensure sufficient trend strength exists before signal activation, making it particularly effective during sustained directional market movements where momentum persistence creates profitable trading opportunities.
The Contrarian Signals Mode provides an alternative approach targeting reversal opportunities through extreme market condition identification. This mode activates when the Wave Trend Oscillator reaches critical threshold levels, specifically when readings surpass 65 indicating potential bearish reversal conditions or drop below 35 suggesting bullish reversal opportunities. This methodology proves valuable during overextended market phases where mean reversion becomes statistically probable.
## Advanced Filtering Mechanisms
The system incorporates multiple sophisticated filtering mechanisms designed to enhance signal quality and reduce false positive occurrences. The High Volume Filter requires volume expansion confirmation before signal activation, utilizing exponential moving average calculations to ensure institutional participation accompanies price movements. This filter substantially improves signal reliability by eliminating low-conviction breakouts that lack adequate volume support from professional market participants.
The Strong Filter provides additional trend confirmation through 200-period exponential moving average analysis. Long position signals require price action above this benchmark level, while short position signals necessitate price action below it. This ensures strategic alignment with longer-term trend direction and reduces the probability of trading against major market movements that could invalidate shorter-term signals.
## Cloud Filter Configuration System
The Fresh Algo v24 offers four distinct cloud filter configurations, each optimized for specific trading timeframes and market approaches. The Smooth Cloud Filter utilizes the mathematical relationship between 150-period and 250-period exponential moving averages, providing stable trend identification suitable for position trading strategies. This configuration generates signals exclusively when price action aligns with cloud direction, creating a more deliberate but highly reliable signal generation process.
The Swing Cloud Filter employs modified Supertrend calculations with parameters specifically optimized for swing trading timeframes. This filter achieves optimal balance between responsiveness and stability, adapting effectively to medium-term price movements while filtering excessive market noise that typically affects shorter-term analytical systems.
For active intraday traders, the Scalping Cloud Filter utilizes accelerated Supertrend calculations designed to capture rapid trend changes effectively. This configuration provides enhanced signal generation frequency suitable for compressed timeframe strategies. The advanced Scalping+ Cloud Filter incorporates Hull Moving Average confirmation, delivering maximum responsiveness for ultra-short-term trading while maintaining signal quality through additional momentum validation processes.
## Specialized Assistant Functionality
The system includes two distinct assistant modes that provide supplementary market analysis capabilities. The Trend Assistant Mode activates advanced cloud analysis overlays that display dynamic support and resistance zones calculated through adaptive volatility algorithms. These levels automatically adjust to current market conditions, providing visual guidance for identifying trend continuation patterns and potential reversal areas with mathematical precision.
The Trend Tracker Mode concentrates on long-term trend identification by displaying major exponential moving averages with color-coded fill areas that clarify directional bias. This mode maintains visual simplicity while providing comprehensive trend context evaluation, enabling traders to quickly assess broader market direction and align shorter-term strategies accordingly.
## Dynamic Risk Management System
The integrated risk management system automatically adapts across all operational modes, calculating stop loss and take profit targets using Average True Range multiples that adjust to current market volatility. This approach ensures consistent risk parameters regardless of selected operational mode while maintaining relevance to prevailing market conditions.
Stop loss placement occurs at 3x ATR distance from entry points, while three progressive take profit targets establish at 1x, 2x, and 3x ATR multiples respectively. The system automatically updates these levels upon trend direction changes, ensuring current market volatility influences all risk calculations and maintains appropriate risk-reward ratios throughout trade management.
## Comprehensive Market Analysis Dashboard
The sophisticated dashboard provides real-time market analysis including volatility measurements, institutional activity assessment, and multi-timeframe trend evaluation across five-minute through four-hour periods. This comprehensive market context assists traders in selecting appropriate operational modes based on current market characteristics rather than relying exclusively on historical performance data.
The multi-timeframe analysis ensures mode selection considers broader market context beyond the primary trading timeframe, improving overall strategic alignment and reducing conflicts between different temporal market perspectives. The dashboard displays market state classification, volatility percentages, institutional activity levels, current trading session information, and trend pressure indicators.
## Enhanced Trading Assistants
The Fresh Algo v24 includes specialized trading assistant features that complement the primary signal generation system. The Reversal Dot functionality identifies potential reversal points through Wave Trend Oscillator analysis, displaying small circles when crossover conditions occur at extreme levels. These reversal indicators provide early warning signals for potential trend changes before they appear in the primary signal system.
The Dynamic Take Profit Labels feature automatically identifies optimal profit-taking opportunities through RSI threshold analysis, marking potential exit points at 70, 75, and 80 levels for long positions and 30, 25, and 20 levels for short positions. This automated profit management system helps traders optimize exit timing without requiring constant manual monitoring.
## Advanced Alert System
The comprehensive alert system accommodates all operational modes while providing granular notification control for various signal types and risk management events. Traders can configure separate alerts for normal buy signals, strong buy signals, normal sell signals, strong sell signals, stop loss triggers, and individual take profit target achievements.
Cloud crossover alerts notify traders when trend direction changes occur, providing early indication of potential strategy adjustments. The alert system includes detailed trade setup information, timeframe data, and relevant entry and exit levels, ensuring traders receive complete context for informed decision-making.
## Technical Foundation Architecture
The Fresh Algo v24 combines multiple proven technical analysis components including Wave Trend Oscillator for momentum assessment, Supertrend for directional bias determination, Squeeze Momentum for volatility analysis, and various exponential moving averages for trend confirmation. Each component contributes specific market insights while the unified system provides comprehensive market evaluation through their mathematical integration.
The multi-component approach reduces dependency on individual indicator limitations while leveraging the analytical strengths of each technical tool. This creates a robust analytical framework capable of adapting to diverse market conditions through appropriate mode selection and parameter optimization.
## Implementation Strategy Considerations
Successful implementation requires careful matching of operational modes to prevailing market conditions and individual trading objectives. Trending modes demonstrate optimal performance during directional markets with sustained momentum characteristics, while contrarian modes excel during range-bound or overextended market conditions where reversal probability increases.
The cloud filter configurations provide varying degrees of confirmation strength, with smoother settings reducing false signal occurrence at the expense of some responsiveness to price changes. Traders must balance signal quality against signal frequency based on their risk tolerance and available trading time.
## Community Development Framework
This indicator represents ongoing community-driven development through the team at t.me where continuous discussions focus on optimization techniques, practical implementation strategies, and real-world performance feedback. The collaborative development approach ensures the system remains relevant to actual market conditions while incorporating insights from active professional traders.
Understanding these operational modes and their specific applications enables traders to optimize the NAIFCHART Fresh Algo v24 system according to their particular requirements while maintaining consistent risk management principles across all market environments. The inherent flexibility in the multi-mode design allows strategic adaptation to changing market conditions without requiring complete methodology overhaul.
---
*Source: NAIFCHART Fresh Algo v24 available through t.me
Supertrend Strategy (5m)📊 Strategy: Buy/Sell Based on EMA Crossover (5-Minute Timeframe)
📊 Стратегия: Buy/Sell по пересечению EMA (5 минут)


RSI + VWAP Strategy by vipindaskr🔍 This script combines RSI and VWAP for intraday trend-based entries.
✅ *Buy Signal:*
- Price above VWAP
- RSI > 60
- Green background + up triangle shown
❌ *Sell Signal:*
- Price below VWAP
- RSI < 40
- Red background + down triangle shown
📈 Ideal for Nifty 50 intraday traders using 5-minute chart.
Developed by vipindaskr 💻

Improved Weinstein Stage AnalysisThe code provides an actionable, disciplined, and visually informative implementation of the “Stage Analysis” approach pioneered by Stan Weinstein, with enhancements to modernize, automate, and clarify the methodology for today’s traders using TradingView. It faithfully follows the workflow recommended: identify long-term cycles, confirm with volume and relative strength, and only engage aggressively with the market during the advancing (bullish) stage with all “clues” aligned.

SMC BOS Strategy for XAUUSDThis is a custom-built TradingView strategy that uses Smart Money Concept (SMC) logic to identify high-probability trend continuation and reversal entries based on Break of Structure (BOS) on XAUUSD. It is designed for traders looking to test institutional-style structure breaks with dynamic entry and risk-managed exits.
The strategy detects BOS using swing highs and lows, then enters trades based on price momentum (bullish or bearish candle confirmation). Each trade is automatically managed using a fixed stop loss in pips and a customizable risk-to-reward (RR) ratio. The goal is to backtest how BOS alone can drive clean directional entries, simulating Smart Money precision without repainting or false signals.
🔑 Key Features:
BOS-Based Entry Logic: Enters trades only after a valid break of structure (new higher high or lower low), signaling continuation from a Smart Money shift.
Momentum Filtered Entry: Requires candle confirmation to validate direction (e.g., bullish close after bullish BOS).
Full Backtest Engine: Built using strategy() functions, allowing you to test SL/TP performance and adjust position sizing.
Custom Risk Control: Adjust Stop Loss (in pips) and Target Profit using a flexible RR ratio (e.g. 1:2 or 1:3 setups).
Works Across Timeframes: Optimized for 15m, 1H, and 4H on XAUUSD, but works on any asset that respects structure.
⚙️ Settings:
Swing Sensitivity – Controls how strict pivot highs/lows are
Minimum Bar Spacing – Prevents overtrading after recent BOS
Stop Loss (in pips) – Fixed distance from entry
Risk/Reward Ratio – Multiplies SL for dynamic take-profit
Trade Direction – Supports both long and short with momentum
📊 How It Works:
Detects new structure break (BOS)
Confirms momentum with candle direction (close > open for long, close < open for short)
Triggers entry and sets TP/SL automatically
Logs results in the Strategy Tester for full backtest evaluation
📌 Optimized For:
XAUUSD (Gold)
Smart Money / SMC / ICT traders
Trend continuation + reversal structures
Backtest-focused strategy building
Institutional-level analysis
📎 Release Notes:
v1.0 – Initial release of BOS-only SMC strategy with full entry/exit simulation and strategy tester support.
⚠️ Disclaimer:
This strategy is built for educational and research purposes only. It is not a signal provider or financial advice. Always combine with your personal confirmation, confluence tools, and risk management.

SMC Structure Levels – BOS & CHoCH for XAUUSDThis is a custom-made TradingView indicator designed to visualize high-confidence market structure shifts based on Smart Money Concepts (SMC), focusing on Break of Structure (BOS) and Change of Character (CHoCH) points. The tool is optimized for XAUUSD but works across all major forex, crypto, and index markets.
It identifies key pivot points and filters them using both price distance and bar spacing, helping traders focus only on meaningful structural changes — not noisy signals. This makes it ideal for traders looking to track institutional-style price behavior with clarity.
🔑 Key Features:
Clean BOS & CHoCH Labels: The indicator plots “BOS” above candles when a structural break occurs in the trend direction, and “CHoCH” below candles when early signs of a reversal appear.
Spaced Signals: Only plots structure shifts that meet both time and price distance filters, preventing clutter and overplotting on the chart.
Swing-Based Logic: Built on pivot high/low analysis with adjustable sensitivity, ensuring flexible structure detection on any timeframe.
Fully Customizable: Modify:
Swing Sensitivity (number of bars before/after pivot)
Minimum bar spacing between BOS/CHoCH signals
Minimum price movement (in pips) between labels
Toggle BOS or CHoCH visibility individually
No Repainting: Once confirmed, signals remain fixed on the chart for historical review.
Zero Clutter: Unlike typical SMC tools that flood the chart, this indicator prioritizes clarity and signal quality.
🧠 What is BOS & CHoCH?
Break of Structure (BOS): Indicates continuation of the current market trend.
Change of Character (CHoCH): Suggests a potential early trend reversal or shift in momentum.
These tools are often used by Smart Money traders to mark significant turning points and trend confirmations.
⚙️ Use Cases:
Structural tracking in Smart Money Concepts (SMC)
Identifying trend continuation or early reversal
XAUUSD (Gold) swing and intraday analysis
Support for Order Blocks, Liquidity Grabs, and FVG confluence
Backtesting market structure break behavior
📌 Best Pairs:
XAUUSD (Gold)
Any asset where structure-based analysis is relevant
📎 Release Notes:
v1.0 – Initial release of BOS/CHoCH structure tool with spacing and pip-distance filtering for XAUUSD analysis.
⚠️ Disclaimer:
This indicator is built for educational and analytical purposes only. It does not constitute trading advice or guarantee profitable signals. Always use with a proper risk management strategy and confirm signals with additional confluence.
✅ This matches the exact quality and structure of the description you showed earlier.
Just copy this into your TradingView script page when publishing. If you'd like the next version with Order Blocks or FVG, say the word.

Williams FractalsBoaBias Fractals High & Lows is an indicator based on Bill Williams' fractals that helps identify key support and resistance levels on the chart. It displays horizontal lines at fractal highs (red) and lows (green), which extend to the current bar. Lines automatically disappear if the price breaks through them, leaving only the relevant levels. Additionally, the indicator shows the price values of active fractals on the price scale for convenient monitoring.
Key Features:
Customizable Fractals: Choose between 3-bar or 5-bar fractals (default: 3-bar).
Period: Adjust the number of periods for calculation
Visualization: Red lines for highs (resistance), green for lows (support). Lines are fixed on the chart and persist during scrolling or scaling changes.
Alert System: Notifications for the formation of a new fractal high/low and for level breaks (Fractal High Formed, Fractal Low Formed, Fractal High Broken, Fractal Low Broken).
How to Use:
Add the indicator to the chart.
Configure parameters: select the fractal type (3 or 5 bars) and period.
Set up alerts in TradingView to receive notifications about new fractals or breaks.
Use the lines as levels for entry/exit positions, stop-losses, or take-profits in fractal-based strategies.
Troubleshooting: If Levels Are Not Fixed on the Chart
If the levels (fractal lines) do not stay fixed on the chart and fail to move with it during scrolling or scaling (e.g., they remain stationary while the chart shifts), this is typically due to the indicator's scale settings in TradingView. The indicator may be set to "No scale," causing the lines to desynchronize from the chart's price scale.
What to Do:
Locate the Indicator Label: On the chart, find the indicator label in the top-left corner of the pane (or where "BoaBias Fractals High & Lows" is displayed).
Right-Click the Label: Click the right mouse button on this label.
Adjust the Scale:
In the context menu, look for the "Scale" or "Pin to scale" option.
If it shows "Pin to scale (now no scale)" or similar, select "Pin to right scale" (or "Pin to left scale," depending on your chart's main price scale—usually the right).
Refresh the Chart: After changing the setting, refresh the chart (press F5 or reload the page), or toggle the indicator off and on again to apply the changes.
After this, the lines should move and scale with the chart during scrolling (horizontal or vertical) or zooming. If the issue persists, check:
TradingView Limits: The indicator may draw too many lines (maximum ~500 per script). If there are many historical fractals, older lines might not display.
Chart Settings: Ensure the chart is not in logarithmic scale (if applicable) or that auto-scaling is enabled.
Indicator Version: Verify you are using the latest script version (Pine Script v6) and check for errors in the TradingView console.
This indicator is ideal for traders working with Bill Williams' chaos theory or those seeking dynamic support/resistance levels. It is based on standard fractals but with enhancements for convenience: automatic removal of broken levels and integration with the price scale.
Note: The indicator does not provide trading signals on its own — use it in combination with other tools. Test on historical data before real trading.
Code written in Pine Script v6. Original template: Mit Nayi.

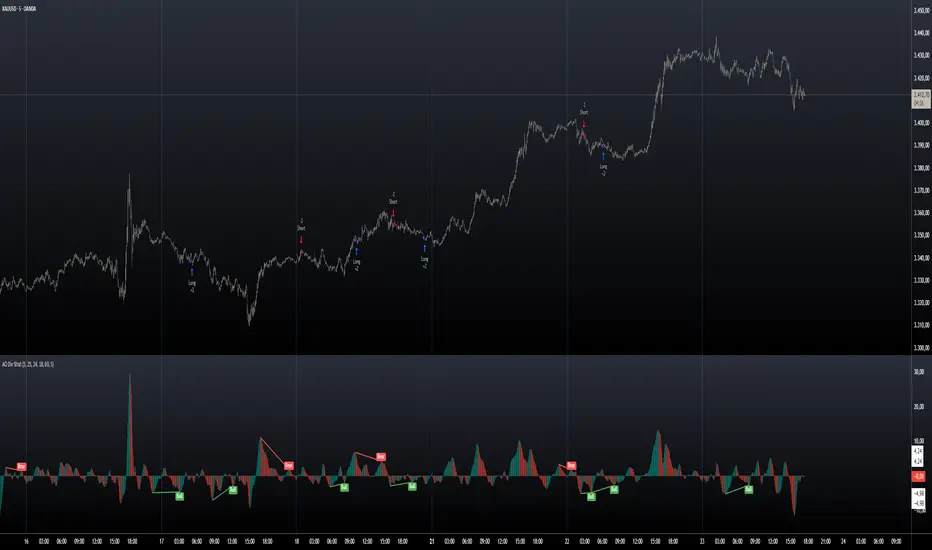
AO Divergence StrategyQuick strategy tester to set up and find the best indicator values
Recommended values:
AO Fast EMA/SMA Length: 5
AO Slow EMA/SMA Length: 25
Use EMA instead of SMA for AO: ❌ (unchecked)
Right Lookback Pivot: 24
Left Lookback Pivot: 18
Maximum Lookback Range: 60
Minimum Lookback Range: 5
Bullish Trace: ✅
Hidden Bullish Trace: ❌
Bearish Trace: ✅
Hidden Bearish Trace: ❌
Status Line Input: ✅
Do your own testing and research, don't just rely on the posting chart that differs from the recommended settings.
MA Crossover with Dots📘 Strategy Description – Moving Average Crossover with Dot Signals
This indicator is based on a Simple Moving Average (SMA) crossover strategy, which is a classic method to identify trend changes and potential buy/sell signals in the market.
📊 Core Logic:
It calculates two SMAs:
Fast SMA: 20-period moving average (short-term trend)
Slow SMA: 50-period moving average (longer-term trend)
✅ Buy Signal (Green Dot):
When the Fast SMA crosses above the Slow SMA, a Buy signal is generated.
This suggests bullish momentum or the start of an uptrend.
❌ Sell Signal (Red Dot):
When the Fast SMA crosses below the Slow SMA, a Sell signal is generated.
This suggests bearish momentum or the start of a downtrend.
📍 Visual Representation:
The Buy and Sell signals are plotted as colored dots at different levels:
Green dot = Buy
Red dot = Sell
The dots are plotted at fixed vertical positions in a separate panel below the chart for better clarity and to avoid overlap.

Alprof Strategyyou can get strategy by TS this strategy you can get a entry point
you can get strategy by TS this strategy you can get a entry point
you can get strategy by TS this strategy you can get a entry point
you can get strategy by TS this strategy you can get a entry point
you can get strategy by TS this strategy you can get a entry point
you can get strategy by TS this strategy you can get a entry point

combo EMAS Session [Indexprofx]🧠 Description:
This indicator highlights the New York and London trading sessions directly on the chart, offering a clear visual reference for intraday trading.
It is a complementary tool designed to work seamlessly with our main system: Intraday Signal.
✔️ Displays the most active market hours.
✔️ Enhances precision in entry and exit decisions.
✔️ Perfect for XAUUSD (Gold) traders and other high-volatility instruments.
🧠 Description:
This indicator plots three key Exponential Moving Averages (EMAs) to help traders identify market trends and potential entry/exit points with precision:
EMA 8 (Green) – Fast trend, useful for scalping or short-term signals
EMA 50 (Blue) – Mid-term trend filter
EMA 150 (Red) – Long-term bias and trend direction
It is part of the IndexProFX toolkit and integrates smoothly with other tools like Intraday Signal and Session Zones for enhanced confluence trading.
✔️ Clean structure
✔️ Easy-to-read color-coded EMAs
✔️ Supports scalping, day trading, and swing trading strategies

IB Breakout Strategy with Fib, CVD, and DivergenceEntry rules and signals- I wait for the 5min IB(initial balance) to form every session for eg-(first 5min candle of london session or ny session, marking top wick to bottom wick of first 5 min candle with a midpoint in that zone.Then look for CVD(cumulative volume delta) if it's alining with my analysis.I also mark previous session fib levels for scalp entries on .618 or .78 level.Also i do mark previous day VAH(value area high),VAL(value area low) and POC(point of control) for better understanding of direction.
Initial stop loss and take profit values-Initial stop loss varies from 200$ to 500$ and take profit varies from 250$ to 500$.
Number of contracts you plan to trade based on system stats and risk management-I plan to trade 1-2 contracts until i reach the safety net.Once safety net is achieved based on my entry level i decide the contract size which varies from 1-4 contracts.
Trade management and any trailing stop methods-I trail the stop once i feel like there's enough room for the trade.I manage the trade on the basis of strength of a candle, if its taking much time without strength i exit the trade.

Fair Value Gap [Custom]📌 FVG Indicator – Smart Money Concepts Tool
This script is based on Smart Money Concepts (SMC) and automatically detects and marks Fair Value Gaps (FVG) on the chart, helping traders identify unbalanced price areas left behind by institutional moves.
🧠 What is an FVG?
An FVG (Fair Value Gap) is the price gap formed when the market moves rapidly, leaving behind a candle range where no trading occurred — typically between Candle 1’s high and Candle 3’s low (in a three-candle pattern). These gaps often signal imbalance, created during structural breaks or liquidity grabs, and may act as retrace zones or entry points.
🛠 Features:
✅ Automatically detects and highlights FVG zones (high-low range)
✅ Differentiates between open (unfilled) and closed (filled) FVGs
✅ Adjustable timeframe settings (works best on 1H–4H charts)
✅ Option to toggle display of filled FVGs
✅ Great for identifying pullback entries, continuation zones, or reversal setups
💡 Recommended Use:
After BOS/CHoCH, watch for price to return to the FVG for entry
Combine with Order Blocks and liquidity zones for higher accuracy
Best used as part of an ICT or SMC-based trading system
