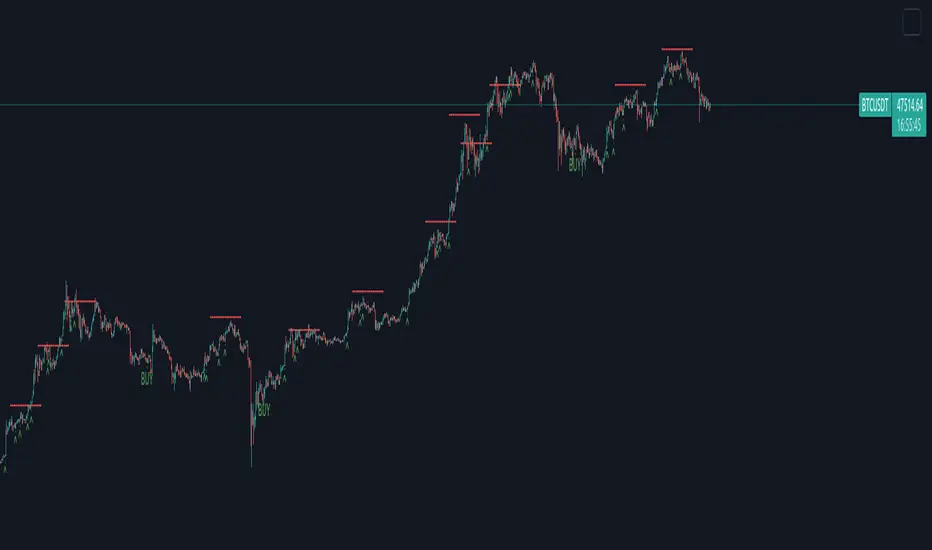
Coin Bureau BB/EMA/RSI IndicatorThis indicator was inspired by Coin Bureau's How To Spot The Crypto Top video. In the video, Coin Bureau uses Bollinger bands, 7-period EMA and RSI to look for early signs of a top, thus presenting an opportunity to sell.
Using the basic principles found in the video, I've made a tentative indicator as a way to visualise all 3 indicators at once. Alerts will only fire when all 3 criteria are met:
Price closes outside 20-period Bollinger bands
Price closes ~2sd away from 7-period EMA
RSI is overbought or oversold
The indicator will also update in real-time and show when 1, 2 or all 3 conditions are satisfied. Additionally, there is built-in functionality to toggle historical/current alerts and users can set their own bounds for what constitutes a buy or sell alert.
This is just a personal project purely for edutainment purposes and should not be used to make financial decisions. This project is not affiliated with Coin Bureau.
Some caveats:
Using only 7 periods to calculate the standard deviation of price data will not lead to a statistically significant result, thus this figure may have no right being in the script. However, this was more to trial some techniques and to get acquainted with the pine scripting language.
As you can see, there are a lot of false positives. There are moments when the indicator flashes a sell alert only for the price to keep on rising. This is due to the specificity/sensitivity trade-off. The indicator has been tuned to give the optimal sensitivity (the more critical component). These are the best results I could find for this asset in this time frame.
Bollinger Bands (BB)

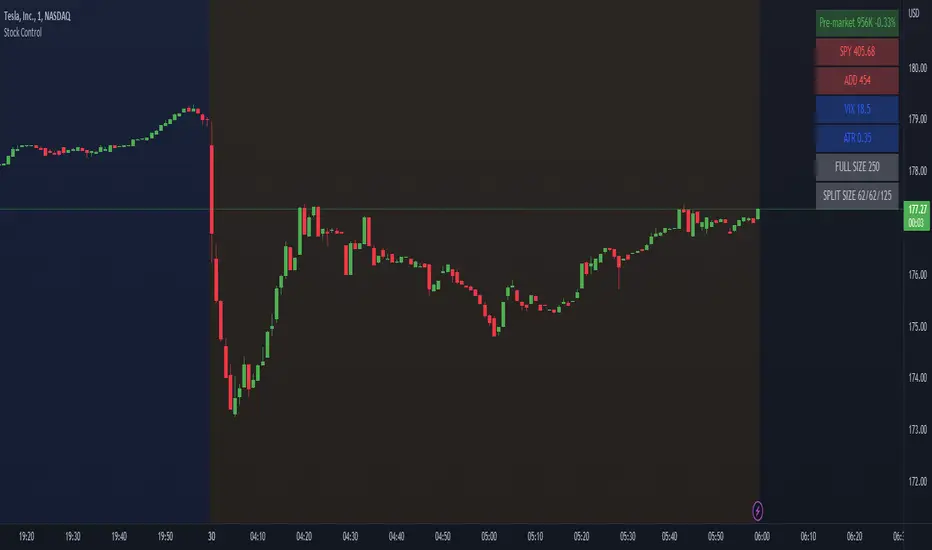
Stock ControlThis indicator shows the following values:
Pre-market volume
SPY
ADD
VIX
For each value the background will be colored based on specific internal parameters which can be customized.
The indicator is highly customizable. Here are some of the settings:
Compact view
Text size
Pre-market thresholds
SPY MACD parameters
ADD MACD parameters
VIX Bollinger parameters
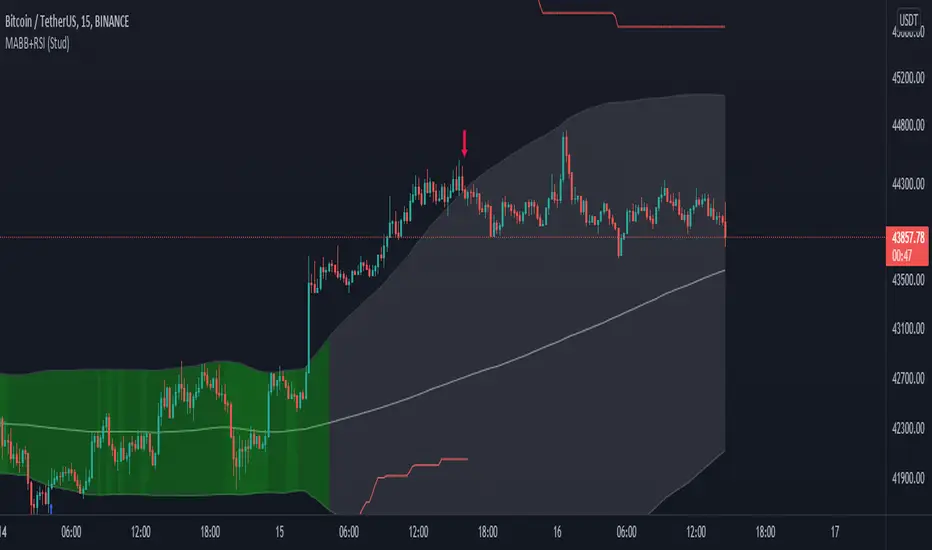
MA Bollinger Bands + RSI (Study)This study/indicator script is meant to allow users to set alerts based on my MA Bollinger Bands + RSI (Strategy).
Both Study and Strategy scripts reflect the exact same user inputs, parameters and trading signals.
6 different alerts available:
- MABB+RSI Long (or Short) Signal (all): activates for every single Long (or Short) signals
- MABB+RSI Long (or Short) Signal: activates when trade direction changes from Short to Long (or from Long to Short)
- MABB+RSI Long (or Short) Re-Entry Signal: after a stop loss was hit, activates upon same trade direction if new signal
(“Enable SL” & “Allow re-entry” must be switched on)
Chart legend:
- Red arrow = Short Signal
- Blue arrow = Long Signal
- Red square = Stop loss (when trade entry)
- Purple square = Stop loss (when hit)
NB1: Be sure to set both Study and Strategy script settings to the same values if you want to achieve similar results in both scripts.
NB2: When setting up your alerts, preferably use option “Once per bar close” to get proper confirmations.
Enjoy!
Volume Adaptive Bollinger Bands (MZ VABB)This indicator is a functional enhancement to John Bollinger's Bollinger Bands. I've used Volume to adapt dynamic length which is used in basis (middle line) of Bollinger Bands and Simple Moving Average is replaced with Adaptive Ehlers Deviation Scaled Moving Average ( AEDSMA ).
BOLLINGER BANDS BASIC USAGE AND LIMITATIONS
Bollinger bands are popular among traders because of their simple way to detect volatility in market and redefine support and resistance accordingly. These are some basic usages of original Bollinger Bands:
Most commonly Bollinger Band works on 20 period Simple Moving Average as Basis / Middle Line and standard deviation of 2 for volatility detection.
Upper and lower bands can act as support and resistance which accordingly update with standard deviation of same period as of Simple Moving Average.
As upper and lower bands act as volatility measure which benefits in Squeeze detection and breakout trading.
Among all the usages there are some limitations as follows:
Original Bollinger Bands use 20 period Simple Moving Average as Basis which itself restricted to some number of data pints and if market moves in one direction or simply goes sideways for long time; candles can stay on either bands for long time. This gives benefit for staying in directional trade but will completely nullify the use of both bands as support and resistance.
Above point simply be explained as markets can stay overbought / oversold for long time and one way to make Bollinger Bands more useful is to simply use higher periods in SMA but as we know with higher periods SMA becomes more laggy and less adaptive.
Most traders use BBs alongside some other Volume Oscillator for example "On Balance Volume" but that does solve BBs limitations issue that it should be more adaptive to detect volatility in market.
VOLUME ADAPTIVE BOLLINGER BAND WORKING PRINCIPLE
Best way to make original Bollinger band more adaptive was to just use dynamic length instead on constant 20 period. This dynamic length had to be based on some other powerful parameter which can't be volatility as BB itself is a volatility indicator and adapting its length based volatility would have been superimposing volatility on Bollinger bands giving unrealistic results.
For adaptive length, I tried using Volume and for this purpose I used my Relative Volume Strength Index " RVSI " indicator. RVSI is the best way to detect if Volume is going for a breakout or not and based on that indication length of Bollinger Band Basis Moving Average changes.
RVSI breaking above provided value would indicate Volume breakout and hence dynamic length would accordingly make Bollinger band basis moving average more over fitted and similarly standard deviation of achieved dynamic length would give better bands for support and resistance. Similar case would happen if Volume goes down and dynamic length becomes more underfit.
According to my back testing studies I found that Simple Moving Average wasn't the best choice for dynamic length usage in Bollinger Band Basis. So, I used Adaptive Ehlers Deviation Scaled Moving Average ( AEDSMA ) which is more adaptive and already modified to adapt with RVSI.
SLOPE USAGE FOR TREND STRENGTH DETCTION
Volume Adaptive Bollinger Bands are more reactive to market trends so, I used slope for trend strength detection.
If slope of Volume Adaptive Bollinger Band Basis (i.e. AEDSMA ), Upper and Lower Bands is supporting a trend at same time then script will provide signal in that direction. That signal can also use Volume as confirmation if Bollinger Bands trend direction is supported by Volume or not.
DYNAMIC COLORS AND TREND CORRELATION
I’ve used dynamic coloring in Basis ( AEDSMA ) to identify trends with more detail which are as follows:
Lime Color: Slope supported Strong Uptrend also supported by Volume and Volatility or whatever you’ve chosen from both of them.
Fuchsia Color: Weak uptrend only supported by Slope or whatever you’ve selected.
Red Color: Slope supported Strong Downtrend also supported by Volume and Volatility or whatever you’ve chosen from both of them.
Grey Color: Weak Downtrend only supported by Slope or whatever you’ve selected.
Yellow Color: Possible reversal indication by Slope if enabled. Market is either sideways, consolidating or showing choppiness during that period.
SIGNALS
Green Circle: Market good for long with support of Volume and Volatility or whatever you’ve chosen from both of them.
Red Circle: Market good to short with support from Volume and Volatility or whatever you’ve chosen from both of them.
Flag: Market either touched upper or lower band and can act as good TP and warning for reversal.
FIBONACCI BANDS
I’ve included Fibonacci multiple bands which would act as good support/resistance zones. For example, 0.618 Fib level act as good local support and resistance in both upper and lower zones. Fibonacci values can be modified but should be lower than 1.
DEFAULT SETTINGS
I’ve set default Minimum length to 50 and Maximum length to 100 which I’ve found works best for almost all timeframes but you can change this delta to adapt your timeframe accordingly with more precision.
Dynamic length adoption is enabled based on Volume only but volatility can be selected which is already explained above.
Trend signals are enabled based on Slope and Volume but Volatility can be enabled for more precise confirmations.
In “ RVSI ” settings "Klinger Volume Oscillator" is set to default but others work good too especially Volume Zone Oscillator. For more details about Volume Breakout you can check “MZ RVSI Indicator".
ATR breakout is set to be positive if period 14 exceeds period 46 but can be changed if more adaption with volatility is required.
EDSMA super smoother filter length is set to 20 which can be increased to 50 or more for better smoothing but this will also change slope results accordingly.
EDSMA super smoother filter poles are set to 2 because found better results with 2 instead of 3.
FURTHER ENHANCEMENTS
So far, I've achieved better results with "Klinger Volume Oscillator" in RVSI but TFS Volume Oscillator and On Balance Volume can be used which would change dynamic length differently. It doesn't mean that results would be wrong with some oscillator and precise with others but every oscillator works in its specific way for and RVSI just detect strength of Volume based on provided oscillator.

[kai]Keltner&BolingerIt is an indicator that simultaneously displays the Bollinger Bands (BB) and Keltner Channel (KC) calculated for the log scale.
* If you need the normal scale version, please turn off the log mode in the settings.
I think the usage is the same as normal BB and KC.
From here, it ’s an original way of thinking.
I thought about countermeasures for the phenomenon that the BB contracts (squeezes) and breaks, but for some reason it suddenly reverses and breaks greatly in the opposite direction or ends in misfire.
The main part of this Inge is KC, and I think that the range within KC is the range.
Considering that the bar broke above and below the range of KC and broke, the trend market started.
BB fits in KC and judges that the trend is game over
If it is within KC, it is contrarian at the upper and lower limits of KC.
If it breaks, Trend following
Profit if BB fits in KC
I'm thinking about how to use it
ログスケール用にログ計算したボリンジャーバンド(BB)とケルトナーチャンネル(KC)を同時に表示するインジケーターです
※通常スケール版が必要な時は設定のlog modeをOFFにしてください
使い方は普通のBBとKCとおなじで使用方法で良いと思います
ここからはオリジナルな使い方の考え方です
BBが収縮(スクイーズ)してブレイクしたのに何故か突然反転して反対の方に大きくブレイクしたり、不発に終わったりする現象の対策を考えました
このインジのメインはKCでKCの範囲内はレンジと考えます
KCの範囲外にバーが上抜け、下抜けして、ブレイクしたと考え、トレンド相場スタートとします
BBがKCの中に納まってトレンド終了と判定します
KC内の場合はKCの上限、下限で逆張り
ブレイクした場合は順張り
BBがKCの中に納まったら利確
という感じの使い方を考えています

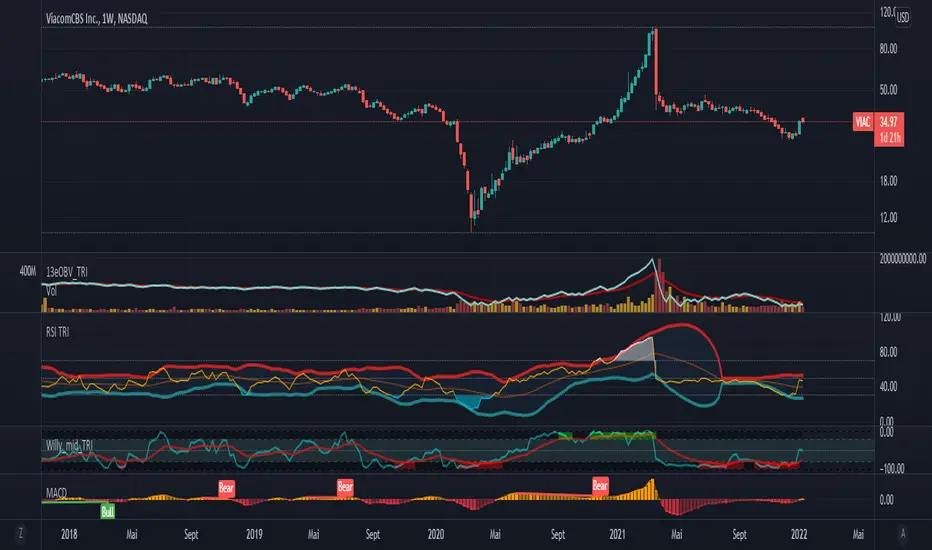
RSI Divergences + Bollinger Bands█ OVERVIEW
Here's the RSI divergences with Bollingers bands.
█ CONCEPTS
5 features
1 — RSI
2 — Bollinger bands
3 — RSI signal is in another color when above 70 or below 30
4 — Looking for previous Divergences, Bullish, Bearish and Hidden Bullish and Bearish but I don't like Hidden divergences
5 — Color fill when overbuy or oversold
█ OTHER SECTIONS
I like to see it like a moutain, with snow on top and lake on bottom. I think you don't want to start walking at the top, nor sink to the bottom of the lake for ever and ever.
It is an idea of sjoerd , tip him if you like it.
An oscillator is good to know where we are in the trends, but it's not enough to run a small business of trading, you need to learn how to use it.
What is a divergence ?
Thanks to The rational investor for teaching me how to use this indicator.
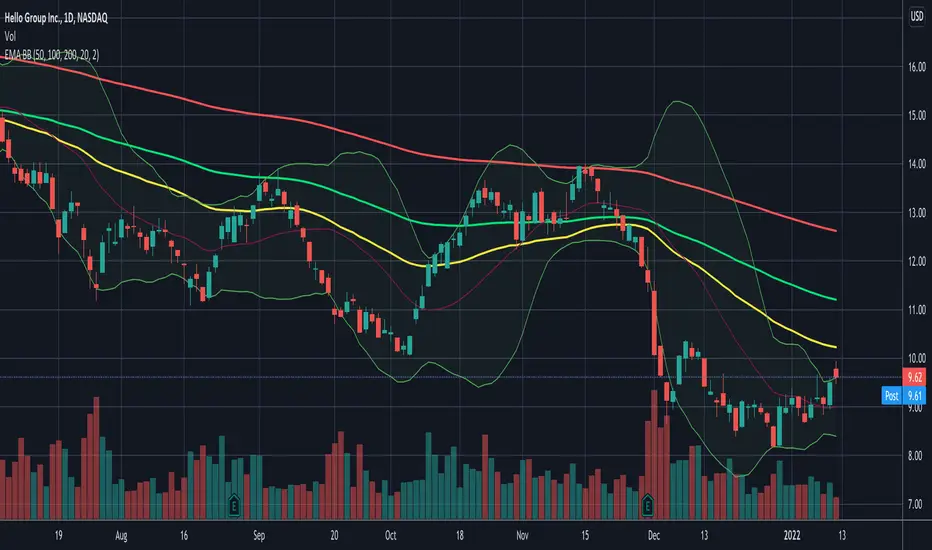
Daily EMA50 100 200 + BBStandard Bollinger Bands (timeframe dependent), period and standard deviation are configurable.
And standard daily triple EMA (timeframe independent). Short, Medium and Long periods are configurable (50/100/200 by default)
CRC.i Bollinger Bands ®This script is yet another variant of the famous Bollinger Bands® TA tool used to track price volatility as it deviates from the mean of a security using standard deviations (positive &negative). Built for my own personal preferences. But perhaps you might like it, too.
Includes
+ Chart Lines: price, upper and lower bands
+ User Options: SMA length, stdev value
+ Heads up Display (HUD) with TARGET's and other related stats
Bugs? Comments? Requests? Ping me @calmrat

T3 + BB
TRES EMAS + BANDAS DE BOLLINGER
INDICADOR 1: TRES EMAS (MEDIA MOVIL EXPONENCIAL)
Con este indicador puede visualizar el promedio de precios con mayor peso a los datos mas recientes.
Se calculan y dibujan tres medias móviles exponenciales: 4, 20 y 200 últimas velas.
-Rápida EMA1 = 4, paso = 1
-Media EMA2 = 20, paso = 2
-Lenta EMA 3 = 200, paso = 10
INDICADOR 2: BANDAS DE BOLLINGER
Con este indicador podrá ver la fuerza y la tendencia del mercado, es decir la mide la volatilidad del precio del activo.
Si el precio sobrepasa la banda superior, el activo está sobrecomprado.
Si el precio sobrepasa la banda inferior, el activo está sobrevendido.
Longitud tendencia - BASE = 20, paso = 1
Desviación Estándar - Multiplicador = 2, paso = 0.2
Estos 2 indicadores sirven para todo tipo de activos: FOREX, CRIPTO, CFD´s, ETC.
------------------------------------------------------------------------------------------------------------------
THREE EMAS + BOLLINGER BANDS
INDICATOR 1: THREE EMAS (EXPONENTIAL MOVING AVERAGE)
With this indicator you can visualize the average of prices with greater weight to the most recent data.
Three exponential moving averages are calculated and drawn: 4, 20 and 200 last candles.
-Fast EMA1 = 4, step = 1
-Average EMA2 = 20, step = 2
-Slow EMA 3 = 200, step = 10
INDICATOR 2: BOLLINGER BANDS
With this indicator you can see the strength and trend of the market, that is, it is measured by the volatility of the asset price.
If the price goes above the upper band, the asset is overbought.
If the price goes above the lower band, the asset is oversold.
Trend length - BASE = 20, step = 1
Standard Deviation - Multiplier = 2, step = 0.2
These 2 indicators are used for all types of assets: FOREX, CRYPT, CFD's, ETC.

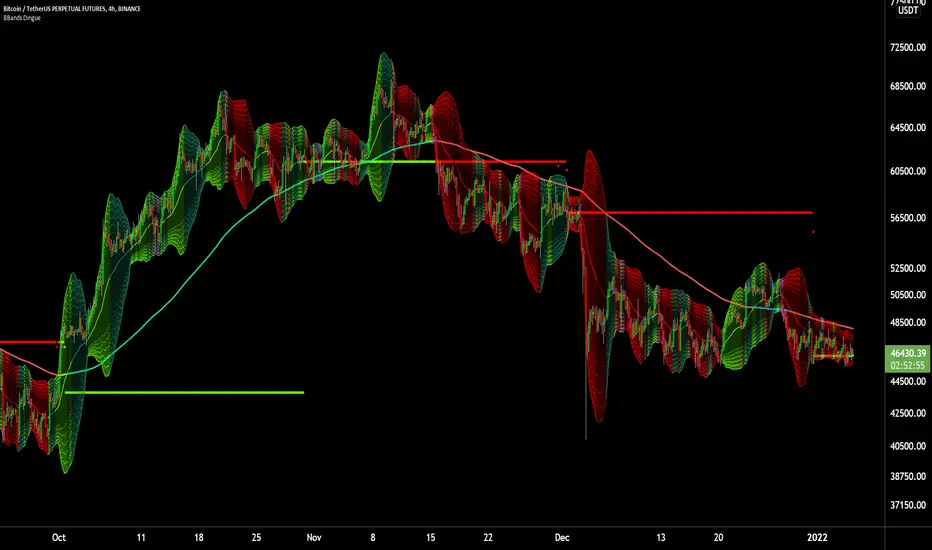
6X Bollinger Bands + MA + VWAP Dingue V56X Bollinger Bands Dingue V5 - This is the updated version for Pine Script 5
This indicator lets you quickly see all the intricacies of the Bollinger Bands; it simplifies its usage and maximizes the results.
Color-coded if the price is above or under the middle and based on direction.
Color-coded for expansion and contraction of the bands.
Option to plot ‘Squeezed bands’. It will show above the bands when they become smaller than the setting chosen. This helps identify build-up that might explode one way or another.
- 6x independent Bands can be adjusted as you want. It gives you possibilities in how you see variance, trends, support and resistance.
You can also select the MA type: SMA EMA WMA VWAM FRAMA … to explore new ways to see the Bollinger bands.
New in this version, you can now add a separate ‘Long MA’ that you can select independently from the Bands. Ex. Plot 200 SMA This helps in building a strategy with the trend and the bands.
Like the MA above, you can also plot 2 different VWAP independently from the Bands. This also helps knowing where the price stands compared to the bigger time frame VWAP’s price.
'Tool tips' explain other settings, if you have any questions, feel free to ask in the comments below.
Thank you for the feedback and check all my ‘Dingue’ indicators.
EMA/MA Cross + BB + Alerts Short hand notes - I made this for friend and I. Unsure how to share it with him so made it public.
u/ tmyerskerry for the math on slope and look back period (look back period isn't perfect for slope calculation as 200ma is slow moving so some signals are goign to be strong instead of weak and visa versa. If you know a better way than i'm all ears!
Can set mutliple EMA's and MA's.
Default BB built in. Couldn't figure out how to set default shadow transparency so you will have to turn it down.
Added red and green lines that indicate when price has gone above and below the BB shadow.
Added arrows for when EMA1 crosses EMA2. Right now set for 9 + 32. And depending on MA200 color changes if its with the trend or against.
Alerts in the works. (please don't ask for them as i'm doing this part time and don't know pinescript)

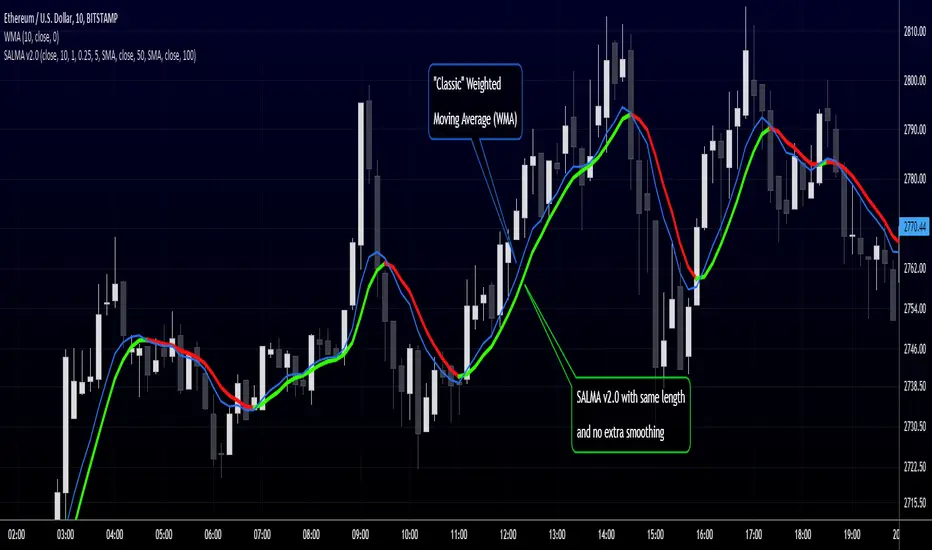
RedK Smooth And Lazy Moving Average (SALMA)Here's a quick and simple script that produces yet another Smooth and Lazy Moving Average - SALMA - that helps hide noise caused by extreme price fluctuations to enable better trend visualization and tracking
Concept:
===========
SALMA is based on a simple concept - we calculate a standard deviation channel of a user-selected width - then correct the price value so that it is restricted within the boundaries of the SD channel - effectively adjusting against high-volatility, sudden price moves - which acts as a pre-smoothing of the price values - then we calculate our moving average and apply extra smoothing as needed.
Since only "persistent" price moves will have an effect on the direction of this MA, it will be suitable to use as an additional trend guide with other indicators, and to consider only long positions when the price is above the SALMA, and short positions only when the price is below
Notes:
========
- for the time being, i'm using Weighted Moving Average (WMA) for the calculation of the base price MA and the SD channel - we can add other MA types as options in a future versions based on feedback
- will add alerts in a future update
- SALMA can be used with any timeframe. can also be set to a higher timeframe against a lower timeframe chart
i have also added couple of standard moving average lines (choose between SMA, EMA and WMA) of selectable lengths - to enable utilizing this in a Moving Average cross-over setup - or to simply monitor other common MA's that other traders are using.
here's how the settings look like when you add SALMA to your chart
Please feel free to play around with SALMA and share feedback :)
Volatility Funnel v2Using the contracting phase of what are basically bollinger bands and some fancy coloring, this indicator draws funnels to which show tightening ranges and doesn't take up too much screen space unless you want it to.
There is a smoothing option if you're into that.
Enjoy!!!

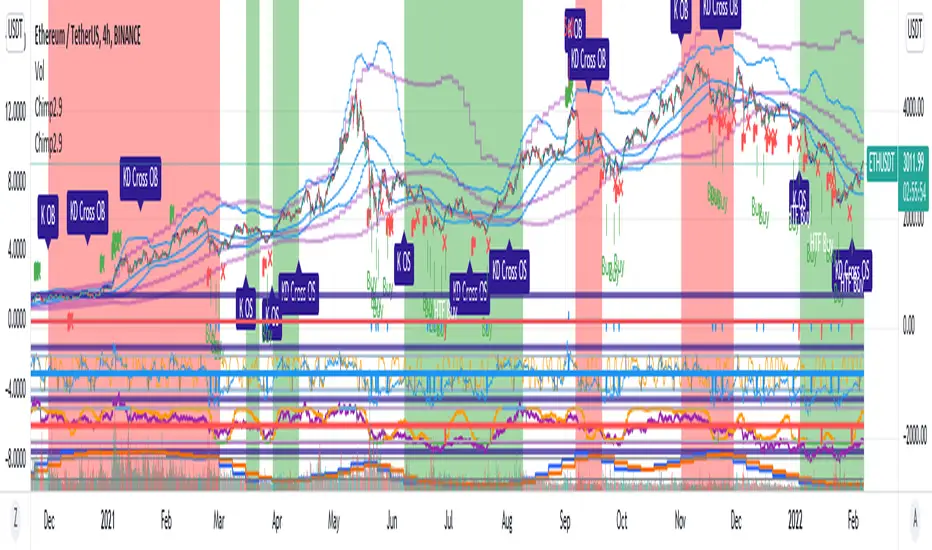
Chimpanzee V2.5 part A by joylay83Hi everyone, I am an amateur pinecoder. I would like to share my script which is coded with the intention of generating signals to send to 3commas webhook. It is still in development and revision.
This collection of indicators use:
Chart: 15m.
Inverse Fisher Transformation of the RSI to detect dips in the 15m timeframe.
Bollinger band (4H) to filter out false signals.
Triple EMA 21: to mimic price action for easier coding alerts. Currently not involved in generating signals. will be incorporated in the future.
StochRSI: As a visual filter. Currently not involved in generating signals. will be incorporated in the future.
Background will be green if stochRSI is low and red if stockRSI is high.
Candlesticks will be marked with a flag is TEMA breached BB.
One would need to play around with timeframes, BB settings and IFTRSI threshold for different signals.
There are 2 Signal Modes (with regards to IFTRSI):
Threshold: When price action falls below BB and IFTRSI hits buy threshold, a buy/sell signal is generated. Eg if IFTRSI buy threshold is set to -0.9, the buy signal will remain continuously positive as long as IFTRSI is < 0.9.
Cross: When price action falls below BB and IFTRSI hits threshold, nothing happens. It will wait until the IFTRSI cross back over the threshold before firing a signal.
There is another identical set of indicators running on a higher time frame (IFTRSI: 4H, BB: D or 3D, TEMA 21 4H) but on the same chart. This tend to generate less signals but are more reliable. A usage example would be to send a larger buy order if the signal comes from this higher time frame, or execute a sell order after multiple buys from the lower time frame.
It comes in 2 parts:
Part A: Contains overlay display. This displays BB, Triple EMA, buy/sell and StochRSI in labels. the labels are self explanatory.
Part B (please search for it): which is actually the same code but contain non-overlay display. You may also put part B overlay=true but scale to LEFT. The advantage of using overlay=true is that you can move the signal right over the candlesticks (mainly for troubleshooting/debugging). This part contains Inverse Fisher RSI, %B, Signal Line. %B is supposedly idential to Bollinger Bands in Part A.
By default, when there is a buy/sell signal:
lower time frame 15m: Signal Line in Part B will turn blue with a value 1 or -1 which corresponds to a buy or sell label in Part A
higher time frame 4H: Signal Line in Part B will turn red with a value 2 or -2 which corresponds to a HTF buy or sell label in Part A
Part A or B may be used to send signal to the webhook. You have to make sure that the settings of Part A and B are identical.
You may choose to un-display some items to reduce clutter.
Current problems:
1. Still too many buy signals
Although many times it will generate excellent buy signal at many swing lows, but there are many buy signals prior to a major swing low. This can be observed in the picture above. It also generate a couple of buy signals prior to the swing lows. I am currently experimenting with 20m and hourly timeframe to address this issue. More filters are needed eg an oscillator or detecting candlestick patterns.
2. Premature sell signals.
The sell signal is often generated at the beginning of a major bull run. My idea to solve this problem is to move to a higher timeframe and sell only when TEMA crossunder the upper bollinger band.
3. Lack of a backtester that can test multiple concurrent deals.
Buy -> Buy (average down) -> Buy (average down) -> Buy (average down) -> Sell
4. Lack of the ability to calculate average purchase price
Probably have to code it as a strategy
5. Display lag
As the browser is running 2 copies of the idential script, it tends to lag when you drag your chart around. So far there are no timeouts or delay in firing alerts to 3commas.
I do welcome any suggestion for improvement and constructive criticism. tqvm.
Credits : Thank you for doing an awesome job. I learnt a lot from your codes and tutorials.
Credits not listed in any order. If your code is used here and did not receive due credit, kindly drop me a note. tq.
Blessing 3 by JTA Today
@ZenAndTheArtOfTrading (extremely-easy-to-understand tutorials eg fixing repainting)
@LazyBear (various codes)
@Galactus-B Argo I
@TheTradingParrot (Inverse Fisher RSI and Gavin's backtester)
@zendog123 (backtester and various codes)
@ydeniz2000 (Bollinger Bands)
TradingView built-in scripts
+ %UMAIf you are familiar with the %B for use with Bollinger Bands, then you will understand this indicator immediately.
Designed for use with my +UMA moving average, this works in exactly the same way, with a few differences.
First off, as you can choose on which type of moving average the calculations are made, so too you will want to match this up with the one you are using. That of course goes for the standard deviation as well (just like you would with Bollinger Bands and %B). Here, because the +UMA uses highs and lows to create a sort of moving average channel, and then also to create the bands, I've opted to set the inner part of the bands as the extreme edge that the %UMA equates with the upper and lower lines.
I've added a moving average, donchian channels, and auto-plotted divergences as well, if you like. Typical color related stuff that I do. Alerts for everything.
Hope you like it!
The above image is comparing two of the same indicator, but based on different moving averages, and how it might plot divergences differently between the two.

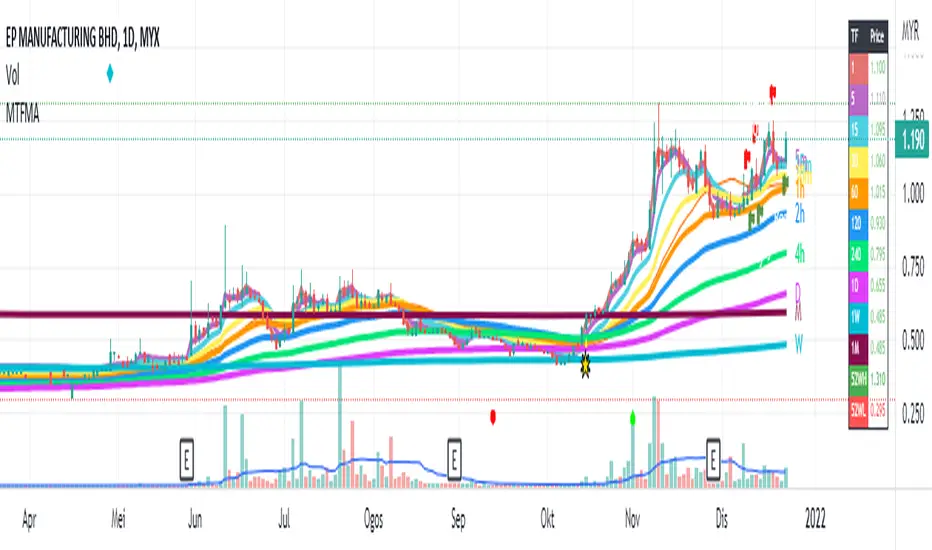
Multiple Timeframe (Moving Average) With InfoThis indicator combine 4 indicator in one pine script : Main indicator is Moving Average in multiple timeframes, Bollinger Band, Crossover Signal, Info Panel, 52Weeks High & 52 Weeks Low.
1)
For multiple moving average, it has 9 difference timeframes.
- Default timeframes is (1minute, 5minutes, 15minutes, 30minutes, 1hour, 4hours, 1Day, 1Week & 1Month). User also have choices to change the option.
- For Moving Average, there also available multiple choice of Moving Average : SMA , EMA , DEMA , VWMA , RMA, WMA . Default Moving Average is EMA (200)
- There also include info panel / table that show TF (Timeframes) for every MAs, & their price. Colors change according to current price. Bullish = Green, Neutral = Neutral, Bearish = Red
There are also function for user to turn on/off :
- (MA) Type & Lenght.
- Multiple MAs.
- Info / Table
User can use multiple line in daily chart to find support & resistance .
Example : For uptrend stock, candle close on top of EMA200 line for 1 hour timeframe. So it's can becomes immediate support, while the other EMAs on below is their next support.
Example :
For downtrend stock, candle close on top of EMA200 line for 5minutes timeframe. So it's become support, while the other EMAs on top is their resistance.
Example :
This Multiple MAs Inspired by xdecow :
www.tradingview.com
Checkout his Multi Timeframe Moving Average here :
2)
This indicator also have Bollingger Band. User have option to turn it on / off. User can use it as a target price if all the EMAs below the candle.
Example :
3)
This indicator also shown 52 Weeks High & 52 Weeks Low. User have option to turn it on / off. Their price also shown at the info panel.
Example :
4)
Crossover Signal. This crossover is default, it happen when candle close on top / near timeframe 5Minutes is (Ready). While candle close below timeframe 5Minutes is (Caution). User can choice other shape if they don't want the text label. To change the crossover for other setup, user can change it under = #2. The crossover only shown in past 10 candle.
Example :
Feel free to use it & comment. Thanks.
Bollinger Band CloudThis script shows a cloud of Bollinger bands of various period lengths surrounding price action.
The bands can be set to 1.25, 2.25 or 3.25 standard deviations.
Functionally, where bands start to converge, especially using 1.25sd, indicates fairly reliable support/resistance. If price action breaks through, price may start trending.
There is also an option to flag price action that breaks through 3.2sd for periods lengths greater than 14. When this happens, watch for a possible stall or reversal.
This concept is merely standing on the shoulders of @acatwithcharts and @dadshark, and I highly recommend using this alongside their indicators. Do yourself a big favor and get to know their work on Advanced Volatility Theory.

Creentrend Pressure SignalsThe hull moving average is my favorite moving average, as well as slower (55ma Bollinger Bands dev@(1.618)) is my favorite standard deviation indicator. Lets combine the two to evaluate overbought, oversold, and pressure.
Use for all time frames- I PREFER daily.
Bollinger band MA at 55
Hull ma at 55
The Hull is more reactive and faster than any band on the BB (both at 55)
When HULL closes BELOW LOWER BAND- it will print a buy signal, remember- over sold and overbought in VOLATILITY could be dangerous on low time frames, as swift moves typically have short term reversals but return to the main trend eventually, this is why i reccomend daily candles.
When PRICE closes ABOVE UPPER BOLLINGER BAND- it will print a green ^ signal under candle indicating upward pressure.
When HULL closes ABOVE UPPER BOLLINGER BAND- it will print a red resistance line. Complex tops happen a lot with bitcoin so take a 1-5% stop above it if shorting.
bb_ema_hamedtarkib bb and ema hasttarkib bb and ema hast
tarkib bb and ema hast
tarkib bb and ema hast
tarkib bb and ema hast
tarkib bb and ema hast
tarkib bb and ema hast
tarkib bb and ema hast
tarkib bb and ema hast
tarkib bb and ema hast
tarkib bb and ema hast
tarkib bb and ema hast
tarkib bb and ema hast
tarkib bb and ema hast
Bollinger Bands with Ema and Two DeviationBollinger Bands with Ema calculation. Based on high and low valus of candle. Also can be used two deviation for both upper and lower bands.
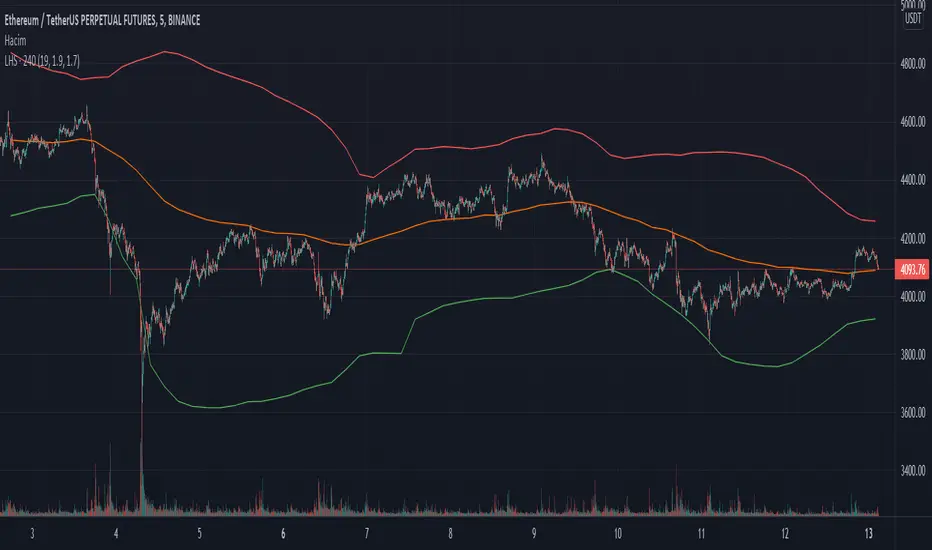
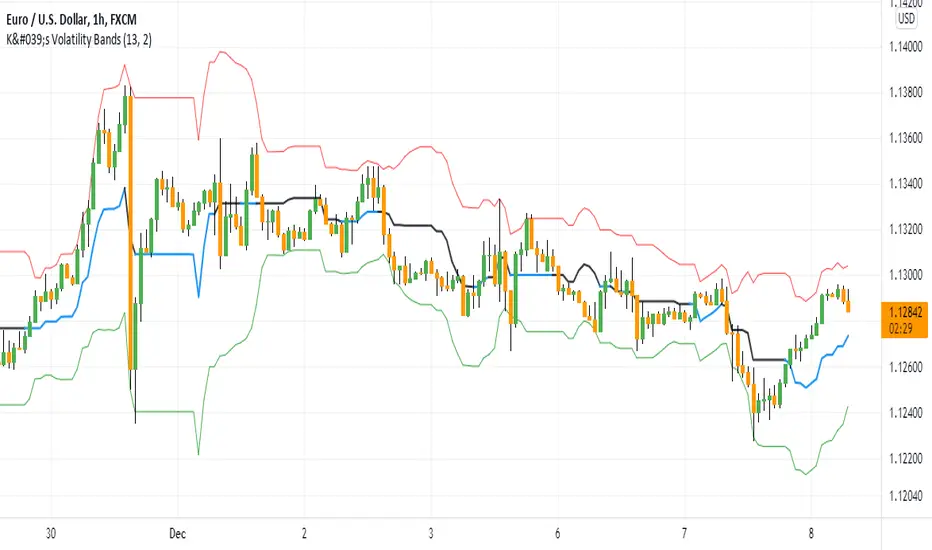
K's Volatility BandsVolatility bands come in all shapes and forms contrary to what is believed. Bollinger bands remain the principal indicator in the volatility bands family. K's Volatility bands is an attempt at optimizing the original bands. Below is the method of calculation:
* We must first start by calculating a rolling measure based on the average between the highest high and the lowest low in the last specified lookback window. This will give us a type of moving average that tracks the market price. The specificity here is that when the market does not make higher highs nor lower lows, the line will be flat. A flat line can also be thought of as a magnet of the price as the ranging property could hint to a further sideways movement.
* The K’s volatility bands assume the worst with volatility and thus will take the maximum volatility for a given lookback period. Unlike the Bollinger bands which will take the latest volatility calculation every single step of time, K’s volatility bands will suppose that we must be protected by the maximum of volatility for that period which will give us from time to time stable support and resistance levels.
Therefore, the difference between the Bollinger bands and K's volatility bands are as follows:
* Bollinger Bands' formula calculates a simple moving average on the closing prices while K's volatility bands' formula calculates the average of the highest highs and the lowest lows.
* Bollinger Bands' formula calculates a simple standard deviation on the closing prices while K's volatility bands' formula calculates the highest standard deviation for the lookback period.
Applying the bands is similar to applying any other volatility bands. We can list the typical strategies below:
* The range play strategy : This is the usual reversal strategy where we buy whenever the price hits the lower band and sell short whenever it hits the upper band.
* The band re-entry strategy : This strategy awaits the confirmation that the price has recognized the band and has shaped a reaction around it and has reintegrated the whole envelope. It may be slightly lagging in nature but it may filter out bad trades.
* Following the trend strategy : This is a controversial strategy that is the opposite of the first one. It assumes that whenever the upper band is surpassed, a buy signal is generated and whenever the lower band is broken, a sell signal is generated.
* Combination with other indicators : The bands can be combined with other technical indicators such as the RSI in order to have more confirmation. This is however no guarantee that the signals will improve in quality.
* Specific strategy on K’s volatility bands : This one is similar to the first range play strategy but it adds the extra filter where the trade has a higher conviction if the median line is flat. The reason for this is that a flat line means that no higher highs nor lower lows have been made and therefore, we may be in a sideways market which is a fertile ground for mean-reversion strategies.
Swing Assassin's Consolidated ScriptI put this script together to essentially consolidate a number of scripts that I use on a daily basis into one script. This is an ongoing improvement effort, so there may be some garbage in here right now so keep that in mind if you intend to use this to help in your trading.
There are 5 moving averages (Hull). I use the Fast, Mid and Slow to find entries after I us the Medium Slow and Super Slow to identify a trend. Otherwise, I have those three turned off.
This script also uses Bollinger Bands which I literally cannot trade without.
The script also has anchored VWAP , automated support/resistance lines, and a homebrewed Volume Profile that is a copy from Ildar Akhmetgaleev's indicator "Poor Man's Volume Profile" used under Mozilla Public License Version 2.0.

Pluto Star - Bollinger Band Trap//DESCRIPTION
//Pluto star appears on a chart when price goes in the in the extreme price range territory, i.e. beyond 2 standard deviation from the mean (or mid Bollinger Band).
//What makes a Pluto Star appear on a chart:
//1. Check if the candle 's' high and low, both are completely outside of the Bollinger Bands (close, 20, 2) - Lets call it Pluto Star Candle
//2. Pluto Star Candle must not be a result of sudden price movement. Hence the previous candle must give a BB Blast.
// In other words, the candle must have it's either open or close outside of Bollinger Bands, to confirm a BB Blast before the Pluto Star
//3. Candle, following the Pluto Star must not break the high (in case of upper BB i.e. short call) or low (in case of lower BB, i.e. long call), to confirm the reversal to the mean
// This implies that Pluto Star appears on chart, above/below the next candle of actual Pluto Star Candle
//----- The above 3 conditions make a Pluto Star appear on a chart. But one must wait for a trade signal. Read the following conditions
//4. There is a signal line, which is nothing but ema(close,5)
//5. The red dotted line is the signal range (and also acts as Stop Loss). The price must close above/below the signal line within the signal range
//6. For a red Pluto Star (short call), the price must close below the signal line, within next 6 candles (signal range). Else there is no trigger for a trade
//7. For a green Pluto Star (long call), the price must close above the signal line, within next 6 candles (signal range). Else there is no trigger for a trade
//8. If any of the candle crosses the Stop Loss line within signal range, there is no trigger for a trade
//9. In a normal scenario, the price must return to the mean, i.e. mid Bollinger Band. In best case scenario, it must go to the opposite side Bollinger Band.
//Recommendation: Test it with Nifty and Bank Nifty charts on 30 mins and 1 hour timeframes
