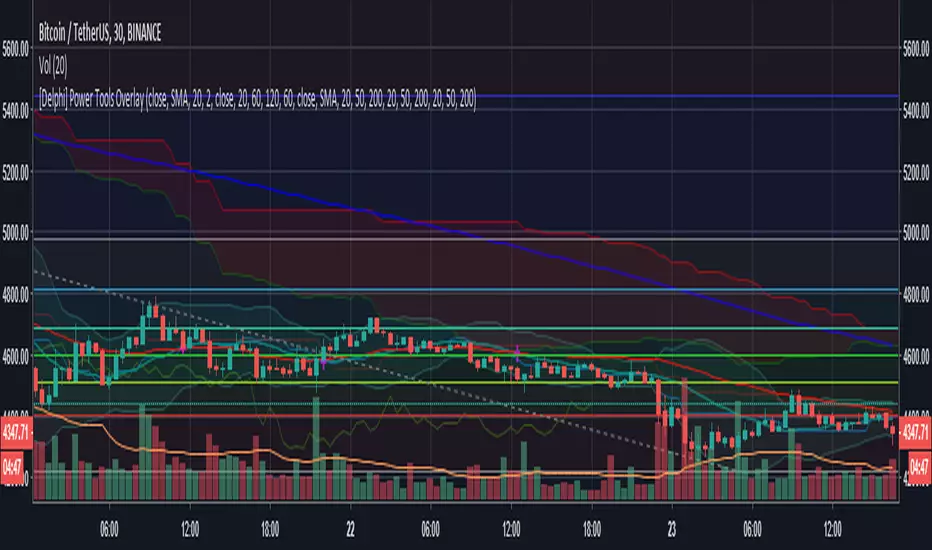
[Delphi] Power Tools OverlayFEATURE
3EMA 3MA 3WMA 3MA-3EMA 3EMA-3WMA 3WMA-3MA
Bollinger Bands
Ichimoku Cloud
//******************************************************************************
// Power Tools Overlay
// Inner Version 1.0 21/11/2018
// Developer: iDelphi
// Developer: astropark (Ichimoku Cloud)
//------------------------------------------------------------------------------
// 21/11/2018 Added EMA MA WMA
// 21/11/2018 Added MA-EMA EMA-WMA WMA-MA (Thanks to mariobros1 for the idea of the Simultaneous MA)
// 21/11/2018 Added Bollinger Bands
// 21/11/2018 Added Ichimoku Cloud (Thanks to astropark for all the code of the Ichimoku Cloud)
//******************************************************************************
Bollinger Bands (BB)
SITEKONG ENTRYthis is an indicator to take the position of an entry on this indicator you can choose at a 15 minute time frame for more optimal results. happy trading
Feature
1. Bollinger Band Multiple
2. Auto Support Resistance
3. Trend Analisys With EMA
4. Macd

inwCoin Stoch+BB AlertSimple alert to go along with the inwCoin Stoch+BB Strategy
Please not that the alerts are persistent, if you already enter the position,
just ignore the rest of the same alert until the opposite alert show up
( long then short / or short then long , if change, just close and enter opposite position )
You can set the alert and let it tell you to iOS app via TradingView app ( yey! )
Please note that, if you don't have bot to track your trailing start/stop. you have to enter the TP/SL manually ( also tracking the position )
So... be careful to follow this alert. just try it with small amount of money first.
and make sure to set stop loss every time because OKEX is a portfolio killer if you don't have any stop loss.

RSI Bollinger WaveTrend Cycle Multi Free TSPMulti indicator
Bollinger Band x RSI
Wave Trend
Cycles
Free users will like it :)
Fell free to like share comments... and check my other stuff :]

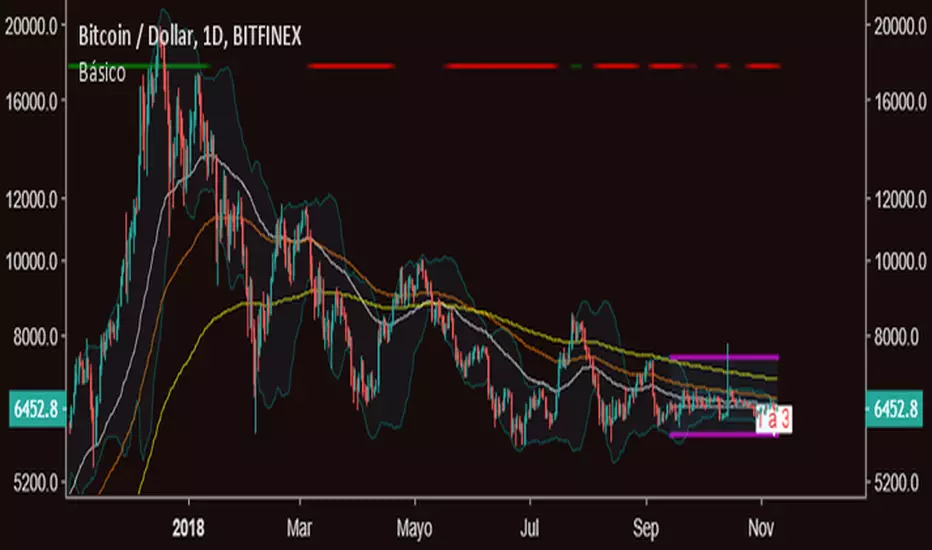
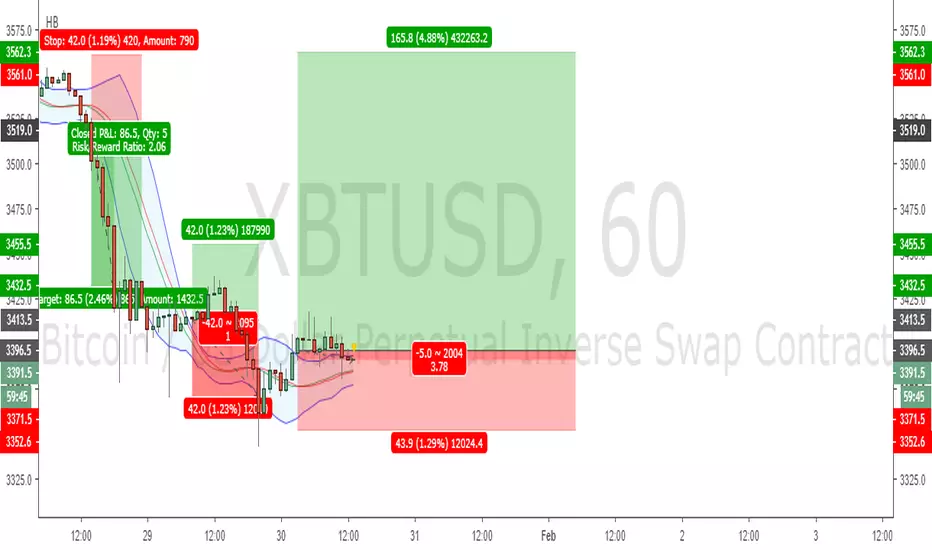
3 in one (BB, 3 MA +) // 3 en 1 (BB, 3 medias moviles, y mas)Version 2 of my previous published script. It allows bollinger bands, 3 moving averages and also it allows to draw entry point, sl and take profit of a single trade in order to track it.
***********************************
Evolución del script anteriormente publicado. Se añaden Bollinger bands y la posibilidad de dibujar los niveles de stop loss, take profit y entrada para una operación en curso. Todas las funciones pueden ser desactivadas. Leer el script para mas información.
RubberbandJust highlights a candle if the high is above the upper Bollinger Band or the low is below the lower Bollinger Band . BB defaults to 3SD. Anything less will happen to frequently.

RubberbandJust highlights a candle if the high is above the upper Bollinger Band or the low is below the lower Bollinger Band . BB defaults to 3SD. Anything less will happen to frequently.

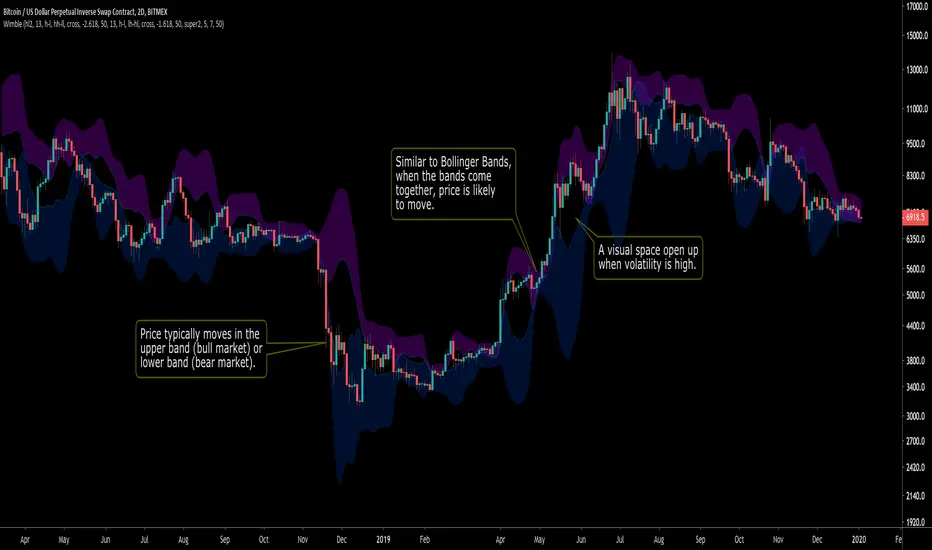
WimbleA standard deviation toolbox. Highly configurable.
Inspired by Bollinger Bands, Wimble creates two bands (from standard deviation) for visually clarity of price movement.
See the comments at the beginning of the script for a complete description.
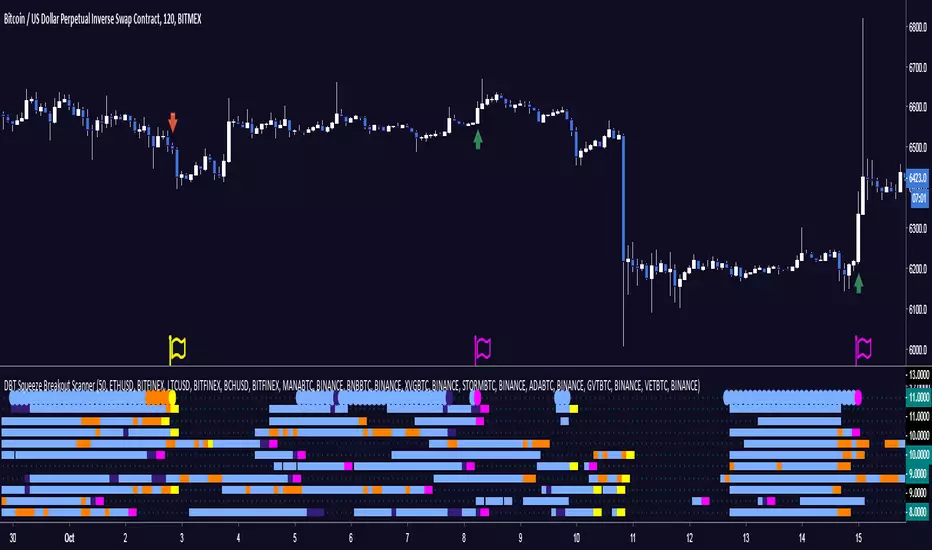
DBT Squeeze Breakout ScannerThe DBT Squeeze Scanner helps you keep an eye on 10 instruments at the same time. It uses a modified version of the DBT Squeeze strategy and scans this strategy against 10 instruments at the same time.
The scanner looks for areas of low volatility signified by a Bollinger Band squeeze and a light blue coloring on the scanner. Once it is squeezing it looks for potential breakout or breakdown opportunities
The scanner has warning signals for both long and short (sell for non margin exchanges) signals, these warning signals are shown as follows:
Light Blue = Bollinger Band Squeeze
Purple = Get ready for a Breakout
Pink = Squeeze has let go and a Breakout is Incoming
Orange = Get ready for a Breakdown
Yellow = Squeeze has let go and a Breakdown is Incoming
All of these signals have their own TradingView alerts. Alerts can be set for anyone of the 10 chosen instruments. Over 10 different kinds of alerts can be setup all at the same time.
This indicator is designed specifically for trending markets, and can be used in many different markets including: Equities, Futures, Commodities, Forex, and Cryptocurrencies. it will give significantly different signals in ranging markets. This indicator is also designed to be 100% preference, PLEASE make sure to choose which 10 instruments you want to watch, the defaults are just some of the major Cryptocurrencies.
Use at your own risk. This is not financial advise and this indicator is not guaranteed to make you profits. Please message me if you have any questions or feedback. Enjoy.
MADE BY GYROMATICAL
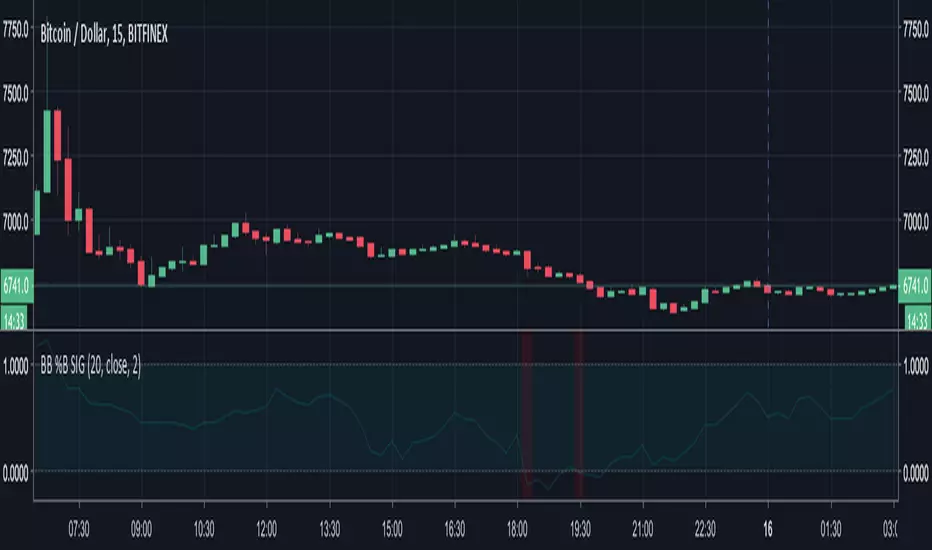
LeoA451: BBW Double Confirmation v.03 (Signal BBW=black(5/5))This script displays BBW from two periods: a signal period (for which I like to use 5 minutes) and the current period of selected time frame.
- Black BBW - BBW for signal period (5 min/ 5 length/ std_dev 2)
- Blue BBW - for current period (current/ 20 length/ std_dev 2)
You can customise periods and length in the settings option.
Enjoy!
Leave any comments and/or press like button (if you do).

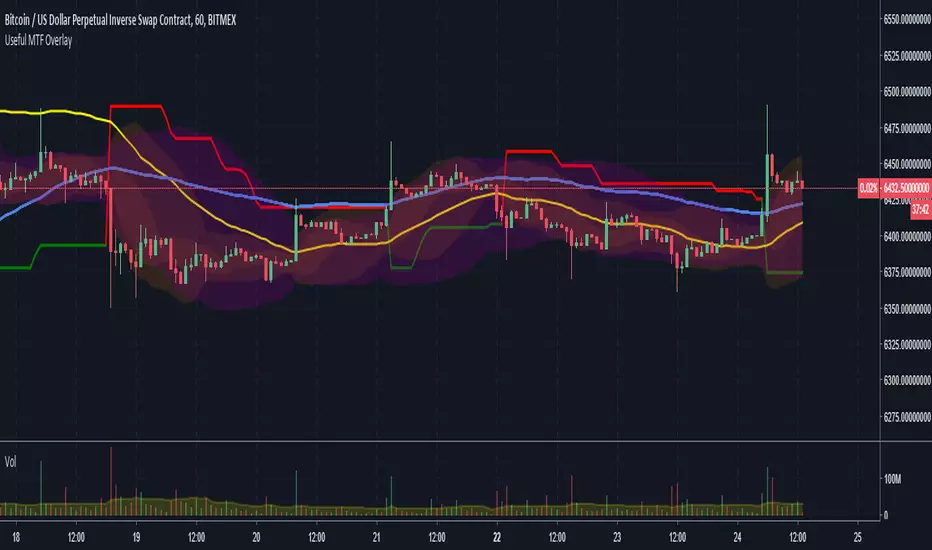
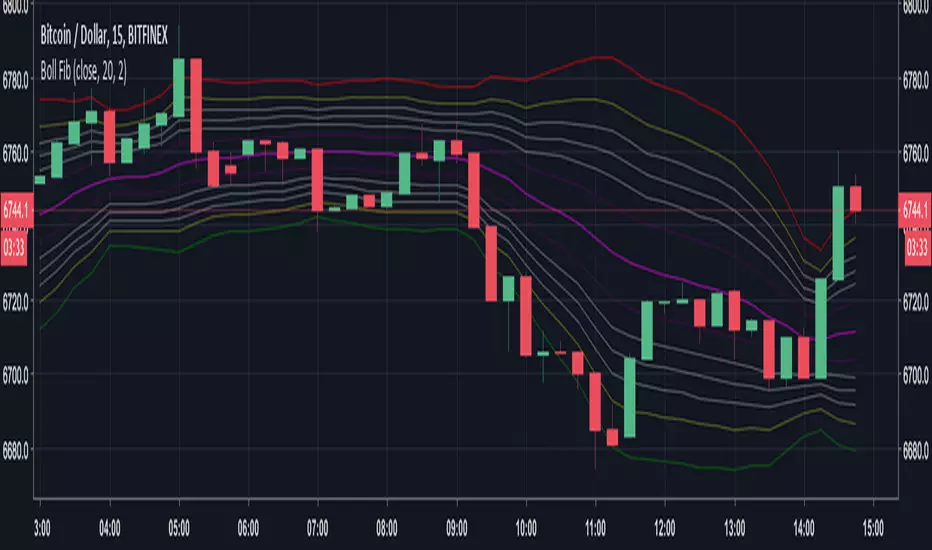
MTF Bollinger Bands, SuperTrend, TEMA Wave and ATR Stop LossThis script is a combination of useful overlay indicators that can be used for day trading or swing trading. You can use it for long term positions as well, but some tweaking may be required. I also added the multi time frame possibility for the majority of settings. This indicator gives you a lot of opportunities and trade setups. Default settings are made for day trading, using intraday time frames.
This script can display the following:
4 independent Bollinger Bands (MTF)
4 independent SuperTrends (MTF)
6 independent TEMAs (MTF)
ATR Stop loss for longs / shorts
Default settings display 3 Bollinger Bands, 2 TEMAs(I have found these two TEMAs particullarly useful, see screenshots below) and a signle SuperTrend.
Do not forget to always use a proper stop loss and risk management.
Here you can see the script in action in different markets:
BTC - BitMex - Setup before the drop from 7400 USD
BTC - BitMex - Setup before the drop from 8400 USD
BTC - BitMex - Setup before the pump to 7800 USD
BTC - BitMex - Setup before the pump to 6800 USD
AutoEnvelopeA channel that contains approximately 95% of all price data for the past 100 bars, about five months on a daily chart. It automatically plots correct channels for any trading vehicle in any timeframe.
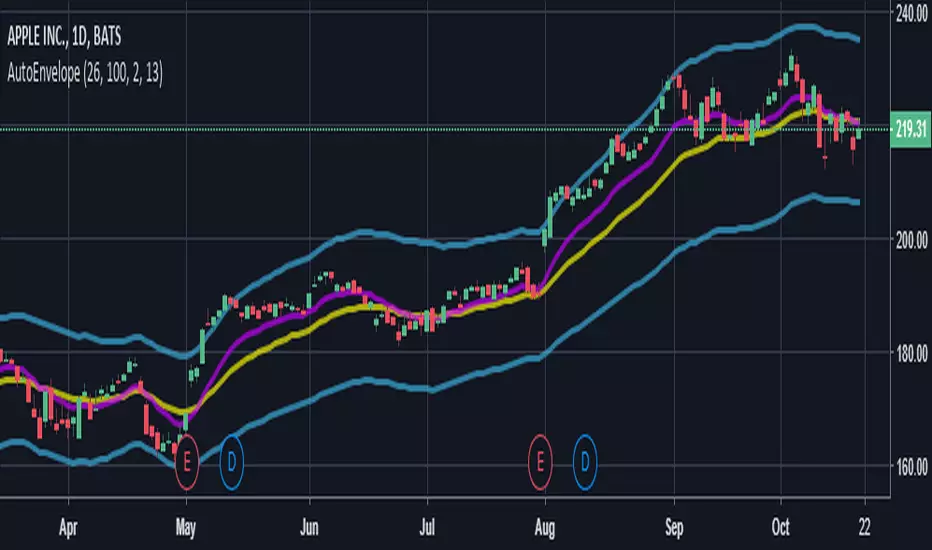
AutoEnvelopeA channel that contains approximately 95% of all price data for the past 100 bars, about five months on a daily chart. It automatically plots correct channels for any trading vehicle in any timeframe.

Librehash MV BandThis indicator does not need much of a description, although its utility is very obvious from first glance.
What this indicator is, is essentially a recreation of the Bollinger Bands (w a diff standard deviation calculation for the band formation) that also comes integrated with its own buy and sell signal as well.
This is one of the more valuable indicators out there for any and all traders that are looking to perform a Bollinger's like analysis in a more helpful, compact, and informative manner.
If you are looking to access this indicator, please shoot me a private message on here. This is an invite-only script, so there is a cost associated with the use of this indicator. Price and payment information will be relayed through our chat conversation.
Again, please reach out to me directly through a private message (not via comment to this post) if you have any questions about accessing this indicator.
Thank you.
Ichimoku & 3 BB & Multi MA by Theo Park V1.1.00Ichimoku Cloud
3 Bollinger Bands
Multi Moving Averages
4 Bollinger Bands and 2 Exponential Moving Averages This script contains multiple indicators of 3 types for better visibility and without having to select multiple indicators one by one and hence saving your time and energy. Also, minimum number of variables are being used in the script for better calculation speed and implementation .
This script is best suited for beginners who are not using pro version and finding it difficult to implement more than 3 indicators on a single chart layout :)
Indicators used :
1. Hybrid of Simple Moving Average and Bollinger Bands .
In this Indicator user can use total of 4 Moving Averages or 4 Bolinger Bands or both (eg: 3 Bolinger bands and 1 Simple Moving Average).
> How to use :
If you want to use Bollinger Bands simply check the boxes of all the 'Upper' and 'Lower' Bands under indicator format/settings.
Else if you want to use Simple Moving Average simply uncheck the boxes of all the 'Upper' and 'Lower' Bands under indicator format/settings.
Tip : You are free to experiment with the format/settings to use both Simple Moving Average and Bollinger Bands using 'MA Length' and 'StdDev'
(standard deviation).
2. Exponential Moving Average
In this indicator user can use 2 Exponential Moving Averages .
> How to use :
If you want to use 2 Exponential Moving Averages simply check 'Enable 2nd EMA' under format/setting inputs.
Else if you want to use only 1 Exponential Moving Average simply uncheck 'Enable 2nd EMA' under format/setting inputs.
Tip : You are free to experiment with both 'EMA_Length1' and 'EMA_Length2' and change it as per your requirments.
//Feel free to ping/DM me for any explaination on how to use this script as your ultimate trading strategy.

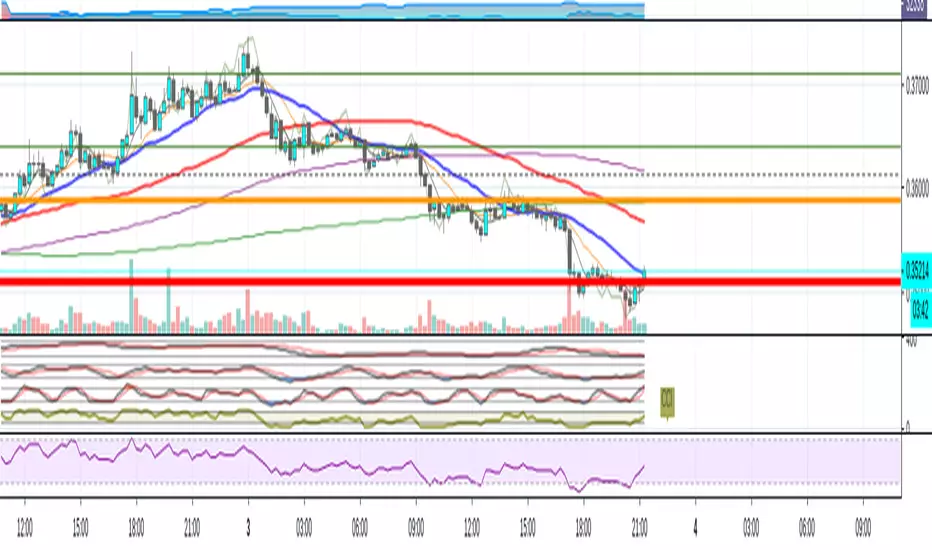
Bands %ABCThe % Bands multitool to keep volatility and reversals under control using quantitative approach and to trade using different signals.
Features
15 well known % bands
4 display modes ( All Lines , Average Line , Breakouts Histogram , Middle Crosses Histogram )
Bands Customization
Readable and optimized code
How to get access
Buy for 649$ (One-time payment, Source Code Transfer, Sole ownership)
Buy for 229$ (One-time payment, Full-time access, Multi ownership)
Make the symbolic monthly donations to support my open source work (Donate-per-use, Part-time access, Multi ownership)
Implemented bands
Bomar Bands %BOMAR (by Marc Chaikin and Bob Brogan)
Bollinger Bands %B (by John Bollinger)
Apirine Exponential Standard Deviation Bands (by Vitali Apirine)
Standard Error Bands %SEB (by Jon Andersen)
Kirshenbaum Bands %KB (by Paul Kirshenbaum)
Acceleration Bands %A (by Price Headley)
Keltner Channels %KC (by Chester W. Keltner)
Stoller Average Range Channels Bands %STARC (by Manning Stoller)
Donchian Channels %DC (by Richard Donchian)
Interquartile Range Bands %IQR (by Alex Orekhov)
Median Absolute Deviation Bands %MAD (by Alex Orekhov)
Mean Absolute Deviation Bands %MEANAD (by Alex Orekhov)
Vervoort Volatility Bands %VVB (by Sylvain Vervoort)
High Low Bands %HLB
Projection Bands %PB (by Mel Widner)

Bollinger Band Oscillator Filtered Long/Short Entries This script calculates entries using Bollinger Bands paired with a series of oscillators. Simply set the Bollinger Band length, as well as the length of the oscillators, and you're good to go. Filtered entries as well as unfiltered entries are plotted by default. Excellent results on longer timeframes (1 hour and higher), although scalping can be done on lower timeframes as well. Filtered entries give safer long/short entries, but plenty of good signals are generated by the unfiltered data as well. Has been tested and found to be effective on several stocks and cryptocurrencies.
Message me to try this script out, thanks!

TDI Signals [by: Bijan Ajdary]This indicator, along with the TDI indicator: , can offer trusted signals to enter and exit.
and just can be used as a complete trading system.
You can send your feedback and comments to my email address: bj.ajdary@gmail.com
@The_Last_Savior

TDI [by: Bijan Ajdary]TDI (Traders Dynamic Index) is based on a standard RSI indicator, determining the strength of the current trend and the speed of price changes. To smooth the lines, an algorithm of moving averages is applied and Bollinger Bands are used to estimate the amplitude of oscillations.
just TDI (Traders Dynamic Index) alone can be used as a complete trading system.
Traders Dynamic Index (TDI), giving simple and high probability entry signals.
For better signal efficiency, you can use this indicator with TDI Signals indicator.
You can send your feedback and comments to my email address: bj.ajdary@gmail.com
@The_Last_Savior
