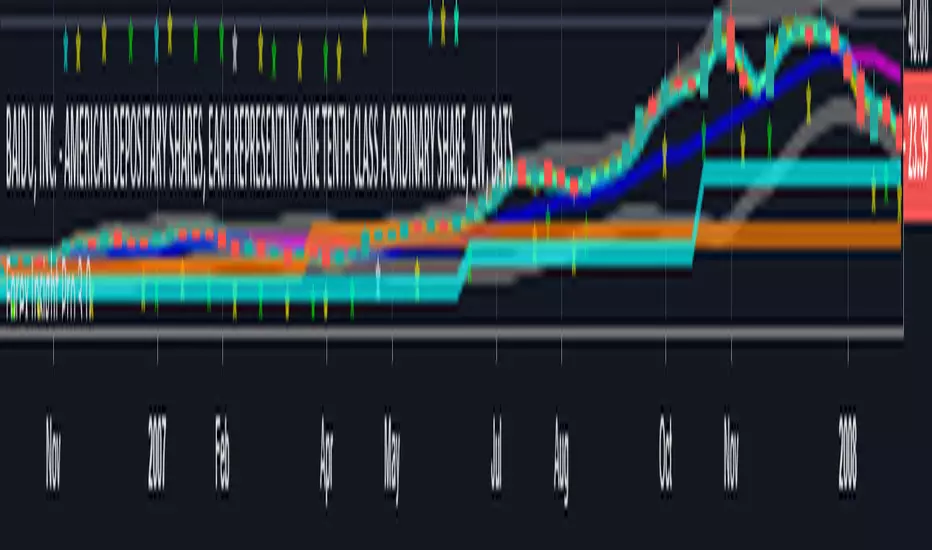
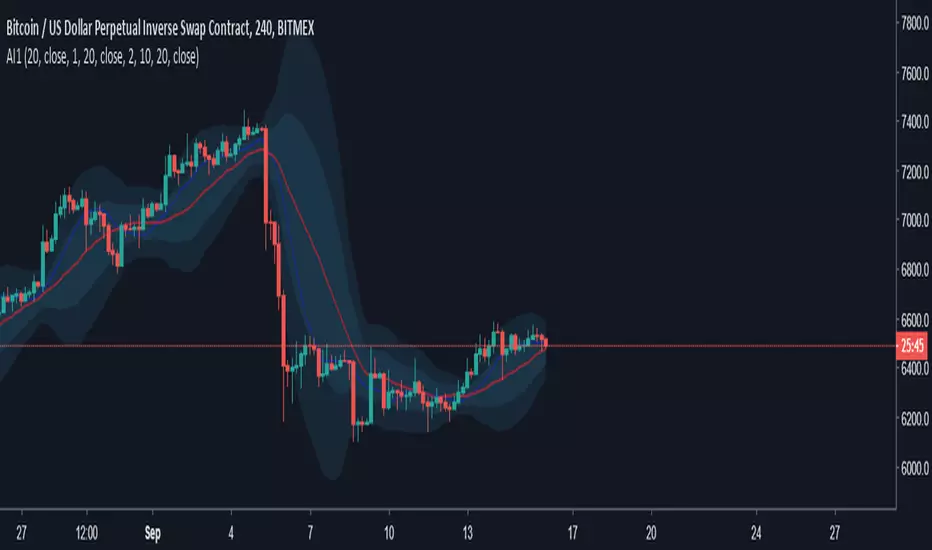
Combo Basic IndicatorsThe indicator consists of multiple time frame SMA and PSAR, the very basic indicator but could be profitable.
SMA can be used as dynamic Support-Resistant levels, and value of higher time frame are considered more significant (major level).
For example, Bitcoin currently has weekly support at 6568$, and regarding to SMA of lower time frame (Day, 4H,..) that are near then concluded as sideways condition.
However, trading opportunities still can be found for short term and tight range (scalping).
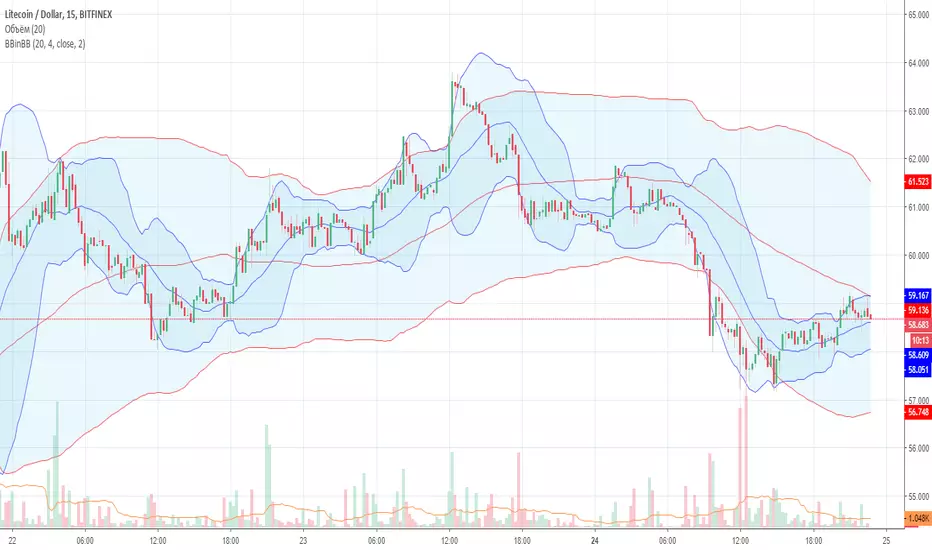
Bollinger Bands (BB)

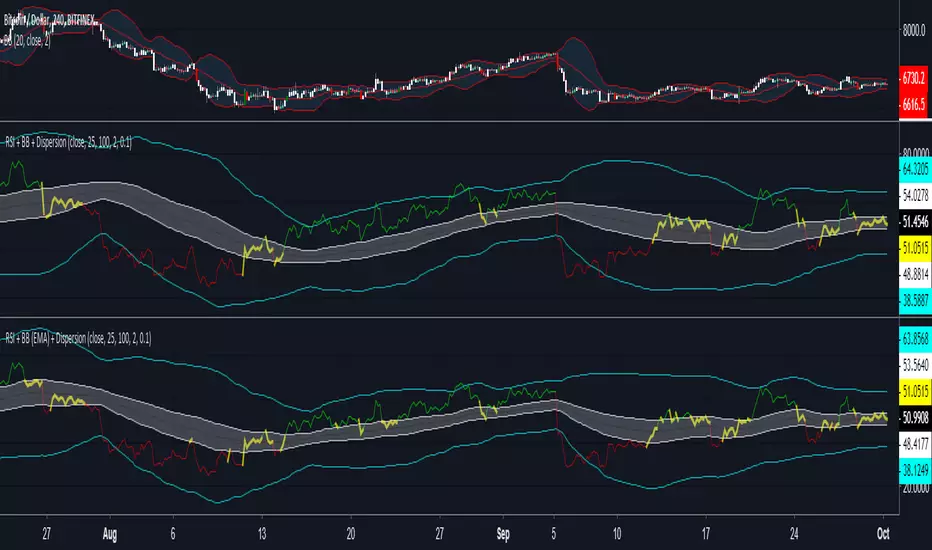
RSI + BB (EMA) + Dispersion (2.0)First version here
Initial data:
1) RSI
2) Bollinger Bands (Basis - EMA )
3) Dispersion (around basis)
Signal for purchase: RSI crosses the dispersion zone upwards
Signal for sale: RSI crosses the dispersion zone downwards
Buffer zone: white area, it is not recommended to make transactions.
--- Add ( 02.10.2018 )
1) RSI lines (overbought / oversold) = 70 / 30. Сan be changed in the settings.
2) Alerts:
• RSI line crossover Dispersion Zone (green)
• RSI line crossunder Dispersion Zone (red)

RSI + BB (EMA) + DispersionInitial data:
1) RSI
2) Bollinger Bands (Basis - EMA)
3) Dispersion (around basis)
Signal for purchase: RSI crosses the dispersion zone upwards
Signal for sale: RSI crosses the dispersion zone downwards
Buffer zone: white area, it is not recommended to make transactions.
SapphireTrade indicator based on standard deviation models. To avoid the numerous false trades this can trigger on normal charts, suggested use is with renko charts.

MA&EMA - Libertus - Binance setupHello all,
This will help you with your Binance altcoin trading. It mimics default MA's and EMA from Binance mobile app and desktop app.
Lots of coins listed there have strange relationship with those lines and this can help you trade easier.
Good luck.
MA: 7, 25, 99 (best used on 1H time frame)
EMA: 20 (also middle line for B. bands on Binance)
Hullfib-trailingso I add a trialing function based on volume pf the bars
this will ,ake the system more easy for the trader
1. Hull mean avreage with color changes (green -red that show the trend )
2. signal prouduce by Hull and bollinger fibs
3.signal prouduce by trailing volume bars (B , S)
4. upper and lower daily fibs
togetther you can make good combination when you bet on bitmex
have fun

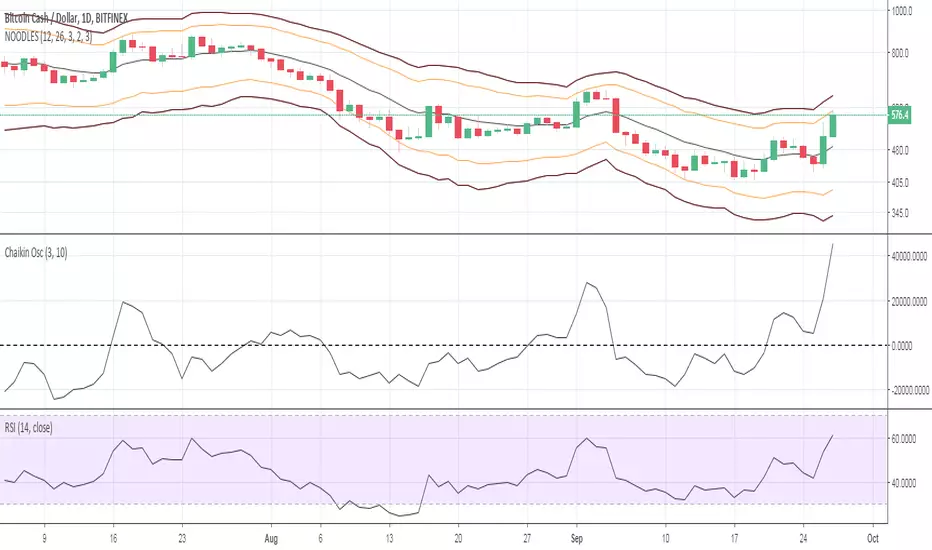
Noodles ema bands 12/26ema bands 12/26 for crypto trading, to find perfect support and resistance on each timeframe. 12/26 exponential moving average as you know is a perfect tool who working very well on bitcoin and others crypto. With this indicator now you have s/r too.
Bollinger Bands in BB (Double BB by Denar)Allows the use of Bollinger Bands for two timeframes, the multiplier "X" is defined as the multiplier of the timeframes. The default multiplier (x=4) allows you to see the 1H Bollinger Bands at 15 minutes chart. Or 4H Bollinger bands on the 1H chart, etc.

Fibonacci Bollinger Bands ExtendedAdded fibonacci extentions to -rashads script'
shows fibonacci retentions and extentions..
Interquartile Range BandsInterquartile Range Bands script.
This indicator was originally developed by Alex Orekhov at his home.
The idea based on the interquartile range en.wikipedia.org
If price breaks out from the bands then it is `outlier` price.
After breakouts price always returns to its median.
Watch squeeze/expansion periods.
Anyway use it as a supplement to the other indicators.
I will glad to get your feedback.

Forex Insight Pro 5.0Forex Insight Pro 5.0 for TradingView gives you abilities to see the stories hiding in the graphs of the markets. It marks and reminds you about important parameters that are happening on the graph so that you will not forget to consider them before placing orders. These parameters include:
Automatic CC(X) counting that compare the close of the right price bar to that of left price bar in a group of X consecutive bars such as CC(5,9) of a group of 5 bars will compare the close price of the right bar to the left bar (ignoring 3 bars in the middle). If the right bar closed higher, the count number would be printed above the bar. If the left bar closed higher, the count number would be printed below the bar. Nine consecutive series of up counts will define the lowest price as CC(5,9) support line and nine consecutive series of down counts will define the highest price as CC(5,9) resistance line. The count numbers and support / resistance lines are automatically printed on the graph if enabled.
Show a set of simple moving average lines such as SMA5, SMA13, SMA50, SMA200, SMA800, if enabled. The color of SMA50 line (which is the same as the the middle line of Bollinger band (50,2) can be set to change based on increasing/decreasing values of itself, or of the MACD(12,26,9).
Show Bollinger bands (50,2), if enabled.
Show the high and low levels of the previous day, if enabled.
Show the important time areas for Forex trading during Asian, London, and New York sessions, if enabled.
Automatic printing of the events happening in the graph to remind the readers of parameters under considerations (if enabled) including:
- Print SMA5>13 and SMA5<13 for SMA5 crossed above and below SMA13.
- Print Max and Min for local maximum and local minimum bars.
- Print C75 and C25 for the bars that closed above 75% and closed below 25% of its ranges.
- Print C>SMA5 and C30 and RSI<70 for RSI(14) that crossed above 30 % and below 70 %.
- Print MACD>0 and MACD<0 for MACD(12,26,9) that crossed above and below zero.
- Print MACD>Sig and MACD<Sig for MACD(12,26,9) that crossed above and below their own SMA9.
=================================================================================================
The source code of Forex Insight Pro 5.0 custom indicator is protected.
Only invited TradingView members can apply this indicator to their forex, crypto currency and stock price graphs.
Lifetime invitation is for 100 USD with free future upgrades and online supports.
Rental invitation is for 10 USD/month with free future upgrades and online supports.
Paypal, Bank transfer and Bitcoin payments are welcome.
A 7-day trial can be requested from the author (DrGraph or Nimit Chomnawang, PhD) via TradingView private chat
or in the comment field below.
=================================================================================================
How to install the script:
------------------------------
*Go to the bottom of this page and click on "Add to Favorite Scripts".
*Open a new chart and click on the "Indicators" tab.
*Click on the "Favorites" tab and choose "Forex Insight Pro 5.0".
*Right click anywhere on the graph, choose "Settings".
*In "Style" tab, choose the Dark Theme.
*In "Scale" tab, choose decimal places of 1/100000.
*In "Background" tab, uncheck "Indicator Arguments" and "Indicator Values".
*In "Timezone/Sessions" tab, choose your time zone.
*At the bottom of settings window, click on "Template", "SaveAs...", then name this theme of graph setting for future call up such as "Forex Insight Pro".
*Click OK.
For free TradingView plan, you can add two more indicators to the chart. That means you may add RSI or MACD indicators with same parameters as those setup in Forex Insight Pro and Volume indicator to your graph. DrGraph regularly publish his educational idea on using features provided in Forex Insight Pro for profitable investments. You can follow him for how to use the tools.

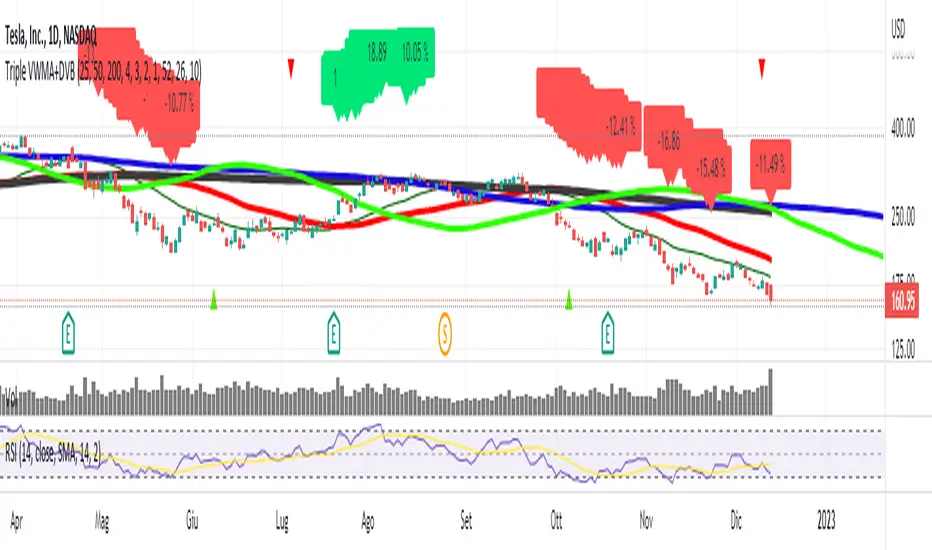
Triple VWMA+DVB (DeksVolumeBands)Triple VWMA+DVB (DeksVolumeBands)
Hello guys, this script offers to you a triple VWMA (Volume-Weighted Moving Average) with four bands obteined by four standard deviations from first VWMA and not from a simple SMA (Simple Moving Average), like in Bollinger Bands.
I think that are accuratest, because I inserted volumes in the bands' formula so that prices have different wheight gived by volume.
***********************************
Ciao ragazzi, questo script vi offre tre VWMA (Media Mobile Ponderata sui Volumi) con quattro bande ottenute da quattro deviazioni standard dalla prima VWMA e non dalla SMA (Media Mobile Semplice), come avviene nelle bande di Bollinger.
Penso che siano più accurate perchè ho inserito il volume nella formula delle bande cosicchè i prezzi hanno un peso diverso dato dal volume.
8EMALines,8SMALines,8HorizonLinesThis script plots max 8 EMA(Exponential Moving Average),8 SMA(Simple Moving Average), and 8 Price_Horizon Lines.
You can use there lines as much as necessary.


Free Log-Normal Bollinger Bands for CryptoBollinger Bands don't work on crypto currency, this is because crypto is so volatile it makes exponential growth a more obvious factor. Bollinger bands assume price will form a normal distribution around the mean which is WRONG, as prices increase in an exponential way, and the price will never fall below $0.
This is a bollinger band based around a log-normal distribution. Which is how prices actually behave.
Use this one instead. It's free.

Forex Insight Pro 4.0Forex Insight Pro 4.0 for TradingView gives you abilities to see the stories hiding in the graphs of markets. It marks and reminds you about important parameters that are happening on the graph so that you will not forget to consider before placing orders. These parameter include:
Helps you count cc(x) that compares the close price of the last bar to that of x-1 bar earlier (the right most bar and the left most bar of x consecutive bars). It marks a number above the price bar if the close of the right is higher and mark a number below the price bar if the close of the right is lower. A sequence of consecutive numbers from cc(x) counting of x=5 below the price bars up to count number 9 will show exhaustion of downtrend and the highest price among these 9 bars will set a cc(5) resistance line. A sequence of consecutive numbers from cc(x) counting of x=5 above the price bars up to count number 9 will show exhaustion of uptrend and the lowest price among these 9 bars will set a cc(5) support line. Both cc(5) support and resistance lines are often respected by the price actions as reversal levels.
Helps you to notice increment / decrement of Middle line of the Bollinger band indicator or increment/decrement of MACD indicator in colors. The normal Bollinger band indicator will have the gray middle line. You can set its color to blue/pink to reflect increasing/decreasing value of the Bollinger middle line or set its color to lime/red to reflect increasing/decreasing MACD value.
Helps you to notice RSI value when it comes back down from overbought condition by printing "RSI-Dn" above the price bar or when it comes back up from oversold condition by printing "RSI-Up" below the price bar.
Helps you to notice the crossing of MACD line and its smoothing Signal line by printing "MACD > Sig" below the price bar if the MACD line crosses above the Signal line and printing "MACD < Sig" above the price bar if the MACD line crosses below the Signal line. Crossing of MACD and Signal lines could be used as warning signs that the reversal of the price trend might follow in the near future.d as warning signs that the reversal of the price trend might follow in the near future.
Helps you to notice the crossing of MACD line between the positive and negative zones by printing "MACD > 0" below the price bar if the MACD line changes to positive region and printing "MACD < 0" above the price bar if the MACD line crosses into the negative region. Changing the sign of MACD value could be used as warning signs that the reversal of the price trend might follow in the near future.
Helps you to notice the crossing of the fast simple moving average line and slow simple moving average line by printing "F > S" below the price bar if the fast SMA line crosses above the slow SMA line and printing "F < S" above the price bar if the fast SMA line crosses below the slow SMA line. Crossings of fast and slow SMA often indicate reversal of the price trends. the price bar if the fast SMA line crosses below the slow SMA line. Crossings of fast and slow SMA often indicate reversal of the price trends.
Helps you to label the Local Maximum and Local Minimum bars. If the high price of the middle bar inside a group of 3 bars is higher than its left and right neighbors, the label "Max" is printed above that middle price bar. Similarly, the label "Min" is printed below that middle price bar if the low price of it inside a group of 3 bars is lower than those of its left and right neighbors. Local Maximum and Minimum helps a lot in drawing the most recent supply and demand lines in which the price may breakout from.
Helps you to label "C75" to the price bars that close at or above 75% of their own range and label "C25" to the price bars that close at or below 25% of their ow n range. A C75 bar is often followed by an uptrend while a C25 is often followed by a downtrend.
Helps you to see the highest and lowest prices of the previous day. These levels are very important for M and W trading in the time frame smaller than daily graph since both intraday double top and double bottom pattern often appear around the previous day's high and low prices.
Helps you to see the time periods of business hours for people working in the financial markets in Asia, Lodon, and New York. The market prices are active and often provide high opportunities for making profits during these time periods.
Parameters of features in the above list could be changed, or turned on/off easily in the input options of Forex Insight Pro 4.0 custom indicator.
=================================================================================================
The source code of Forex Insight Pro 4.0 custom indicator is protected.
Only invited TradingView members can apply this indicator to their forex, crypto currency and stock price charts.
Lifetime invitation is for 100 USD with free future upgrade and online support.
Rental invitation is for 10 USD/month.
Paypal, bank transfer and Bitcoin payments are welcome.
The author (DrGraph or Nimit Chomnawang, PhD) can be contacted with his TradingView handle.
=================================================================================================
How to install the script:
------------------------------
*Go to the bottom of this page and click on "Add to Favorite Scripts".
*Open a new chart and click on the "Indicators" tab.
*Click on the "Favorites" tab and choose "Forex Insight Pro 4.0".
*Right click anywhere on the graph, choose "Settings".
*In "Style" tab, choose the Dark Theme.
*In "Background" tab, uncheck "Indicator Arguments" and "Indicator Values".
*In "Timezone/Sessions" tab, choose Time Zone = Exchange or your time zone.
*At the bottom of settings window, click on "Template", "SaveAs...", then name this theme of graph setting for future call up such as "Forex Insight Pro".
*Click OK.
For free TradingView plan, you can add two more indicators to the chart. That means you may add RSI or MACD indicators with same parameters as those setup in Forex Insight Pro and Volume indicator to your graph. DrGraph regularly publish his educational idea on using features provided in Forex Insight Pro for profitable investments. You can follow him for how to use the tools.

Multi SMA EMA WMA HMA BB (4x3 MAs Bollinger Bands) Pro MTF - RRBMulti SMA EMA WMA HMA 4x3 Moving Averages with Bollinger Bands Pro MTF by RagingRocketBull 2018
Version 1.0
This indicator shows multiple MAs of any type SMA EMA WMA HMA etc with BB and MTF support, can show MAs as dynamically moving levels.
There are 4 MA groups + 1 BB group. You can assign any type/timeframe combo to a group, for example:
- EMAs 50,100,200 x H1, H4, D1, W1 (4 TFs x 3 MAs x 1 type)
- EMAs 8,13,21,55,100,200 x M15, H1 (2 TFs x 6 MAs x 1 type)
- D1 EMAs and SMAs 12,26,50,100,200,400 (1 TF x 6 MAs x 2 types)
- H1 WMAs 7,77,231; H4 HMAs 50,100,200; D1 EMAs 144,169,233; W1 SMAs 50,100,200 (4 TFs x 3 MAs x 4 types)
- +1 extra MA type/timeframe for BB
compile time: 25-30 sec
full redraw time after parameter change in UI: 3 sec
There are several versions: Simple, MTF, Pro MTF, Advanced MTF and Ultimate MTF. This is the Pro MTF version. The Differences are listed below. All versions have BB
- Simple: you have 2 groups of MAs that can be assigned any type (5+5)
- MTF: +2 custom Timeframes for each group (2x5 MTF)
- Pro MTF: +4 custom Timeframes for each group (4x3 MTF), MA levels and show max bars back options
- Advanced MTF: +2 extra MAs/group (4x5 MTF), custom Ticker/Symbol, backreferences for type, TF and MA lengths in UI
- Ultimate MTF: +individual settings for each MA, custom Ticker/Symbols
Features:
- 4x3 = 12 MAs of any type including Hull Moving Average (HMA)
- 4x MTF groups with step line smoothing
- BB +1 extra TF/type for BB MAs
- 12 MA levels with adjustable group offsets, indents and shift
- show max bars back
- you can show/hide both groups of MAs/levels and individual MAs
Notes:
1. based on 3EmaBB, uses plot*, barssince and security functions
2. you can't set certain constants from input due to Pinescript limitations - change the code as needed, recompile and use as a private version
3. Levels = trackprice implementation
4. Show Max Bars Back = show_last implementation
5. uses timeframe textbox instead of input resolution to allow for 120 240 and other custom TFs. Also supports TFs in hours: 2H or H2
6. swma has a fixed length = 4, alma and linreg have additional offset and smoothing params
7. Smoothing is applied by default for visual aesthetics on MTF. To use exact ma mtf values (lines with stair stepping) - disable it
MTF Notes:
- uses simple timeframe textbox instead of input resolution dropdown to allow for 120, 240 and other custom TFs, also supports timeframes in H: 2H, H2
- Groups that are not assigned a Custom TF will use Current Timeframe (0).
- MTF will work for any MA type assigned to the group
- MTF works both ways: you can display a higher TF MA/BB on a lower TF or a lower TF MA/BB on a higher TF.
- MTF MA values are normally aligned at the boundary of their native timeframe. This produces stair stepping when a higher TF MA is viewed on a lower TF.
Therefore X Y Point Density/Smoothing is applied by default on MA MTF for visual aesthetics. Set both to 0 to disable and see exact ma mtf values (lines with stair stepping and original mtf alignment).
- Smoothing is disabled for BB MTF bands because fill doesn't work with smoothed MAs after duplicate values are replaced with na.
- MTF MA Value fluctuation is possible on the current bar due to default security lookahead
Smoothing:
- X,Y == 0 - X,Y smoothing disabled (stair stepping on high TFs)
- X == 0, Y > 0 - X,Y smoothing applied to all TFs
- Y == 0, X > 0 - X smoothing applied to all TFs < deltaX_max_tf, Y smoothing disabled
- X > 0, Y > 0 - Y smoothing applied to all TFs, then X smoothing applied to all TFs < deltaX_max_tf
X Smoothing with Y == 0 - shows only every deltaX-th point starting from the first bar.
X Smoothing with Y > 0 - shows only every deltaX-th point starting from the last shown Y point, essentially filling huge gaps remaining after Y Smoothing with points and preserving the curve's general shape
X Smoothing on high TFs with already scarce points produces weird curve shapes, it works best only on high density lower TFs
Y Smoothing reduces points on all TFs, removes adjacent points with prices within deltaY, while preserving the smaller curve details.
A combination of X,Y produces the most accurate smoothing. Higher delta value - larger range, more points removed.
Show Max Bars Back:
- can't set plot show_last from input -> implemented using a timenow based range check
- you can't delete/modify history once plotted, so essentially it just sets a start point for plotting (from num_bars bars back) that works only in realtime mode (not in replay)
Levels:
You can plot current MA value using plot trackprice=true or by checking Show Price Line in Style. Problem is:
- you can only change color (not the dashed line style, width), have both ma + price line (not just the line), and it's full screen wide
- you can't set plot trackprice from input => implemented using plotshape/plotchar with fixed text labels serving as levels
- there's no other way of creating a dynamic level: hline, plot, offset - nothing else works.
- you can't plot a text var - all text strings must be constants, so you can't change the style, width and text labels without recompiling.
- from input you can only adjust offset, indent and shift for each level group, and change color
- the dot below each level line is the exact MA value. If you want just the line swap plotshape with plotchar, recompile and save as your private version, adjust Y shift.
To speed up redraw times: reduce last_bars to ~2000, recompile and use as your own private version
Pinescript is a rudimentary language (should be called Painscript instead) that can basically only plot data. You can't do much else. Please see the code for tips and hints.
Certain things just can't be done or require shady workarounds and weeks of testing trying to resolve weird node.js compiler errors.
Feel free to learn from/reuse/change the code as needed and use as your own private version. See comments in code. Good Luck!

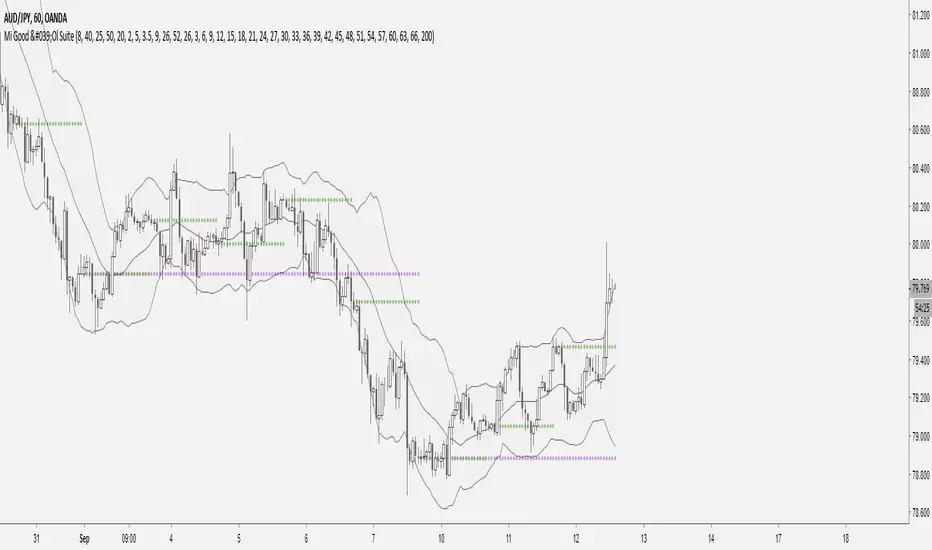
Mi Good 'Ol SuiteI've created this tool to help out traders by providing a variety of options to help out directional bias, as well as certain indicators that offer different types of support and resistance.
Some features include Daily and Weekly Open, Bollinger Band, and different moving average concepts that could prove to be useful.
If you have any questions or would like access, just send me a message. I hope you enjoy.

Forex Insight Pro 3.0
Forex Insight Pro 3.0 for TradingView gives you abilities to see the stories hiding in the graphs of markets. It marks and reminds you about important parameters that are happening on the graph including:
Helps you to label the numbers from sequential counting of CC-X which compares the Close price of the right bar to the Close price of the left bar in a group of X price bars. For example CC-5 will compare the Close of right bar (current bar) to the Close of left bar in a group of 5 price bars (right, left and other 3 bars in the middle). If the close of right bar is higher than the close of left bar, an increasing number will be printed above the right bar. On the other hand, an increasing number will be printed below the right bar if the close of right bar is lower than the close of left bar. Sequences of consecutive increasing numbers above or below the price bars indicate buying or selling pressure in the market.
Helps you to generate CC-X Support and Resistance levels which are the highest or lowest prices in the range of settable number of bars. For example, if 9 consecutive CC-5 below the price bars is specified, the resistance line will be plotted at the highest price of the most recent 9 bars. Similarly, if 9 consecutive CC-5 above the price bars is specified, the support line will be plotted at the lowest price of the most recent 9 bars. These CC-5 support and resistance levels often become important price structures in the graph for breakout or trend reversal later on.
Helps you to notice increment / decrement of Middle line of the Bollinger band indicator or increment/decrement of MACD indicator in colors. The normal Bollinger band indicator will have the gray middle line. You can set its color to blue/fuchsia to reflect increasing/decreasing value of the Bollinger middle line or set its color to lime/red to reflect increasing/decreasing MACD value.
Helps you to notice high level of RSI value by printing "H-RSI" above the price bar if the RSI value is greater than the preset value such as 70% or notice low level of RSI value by printing "L-RSI" below the price bar if the RSI value is less than the preset value such as 30%. The "H-RSI" and "L-RSI" could be used as warning signs that the reversal of the price trend might follow in the near future.
Helps you to notice the crossing of MACD line and its smoothing Signal line by printing "MACD > Sig" below the price bar if the MACD line crosses above the Signal line and printing "MACD < Sig" above the price bar if the MACD line crosses below the Signal line. Crossing of MACD and Signal lines could be used as warning signs that the reversal of the price trend might follow in the near future.d as warning signs that the reversal of the price trend might follow in the near future.
Helps you to notice the crossing of MACD line between the positive and negative zones by printing "MACD > 0" below the price bar if the MACD line changes to positive region and printing "MACD < 0" above the price bar if the MACD line crosses into the negative region. Changing the sign of MACD value could be used as warning signs that the reversal of the price trend might follow in the near future.
Helps you to notice the crossing of the fast simple moving average line and slow simple moving average line by printing "F > S" below the price bar if the fast SMA line crosses above the slow SMA line and printing "F < S" above the price bar if the fast SMA line crosses below the slow SMA line. Crossings of fast and slow SMA often indicate reversal of the price trends. the price bar if the fast SMA line crosses below the slow SMA line. Crossings of fast and slow SMA often indicate reversal of the price trends.
Helps you to label the Local Maximum and Local Minimum bars. If the high price of the middle bar inside a group of 3 bars is higher than its left and right neighbors, the label "Max" is printed above that middle price bar. Similarly, the label "Min" is printed below that middle price bar if the low price of it inside a group of 3 bars is lower than those of its left and right neighbors. Local Maximum and Minimum helps a lot in drawing the most recent supply and demand lines in which the price may breakout from.
Parameters of features in the above list could be changed, or turned on/off easily in the input options.
The source code of Forex Insight Pro 3.0 custom indicator is protected. Only invited TradingView members can apply this indicator to their forex, crypto currencies and stock price charts. Lifetime invitation is for 100 USD with free future upgrade and online support. Rental invitation is for 10 USD/month. Paypal, bank transfer and Bitcoin payments are welcome.
The author (Dr.Graph or Nimit Chomnawang, Ph.D) can be contacted with his TradingView handle .