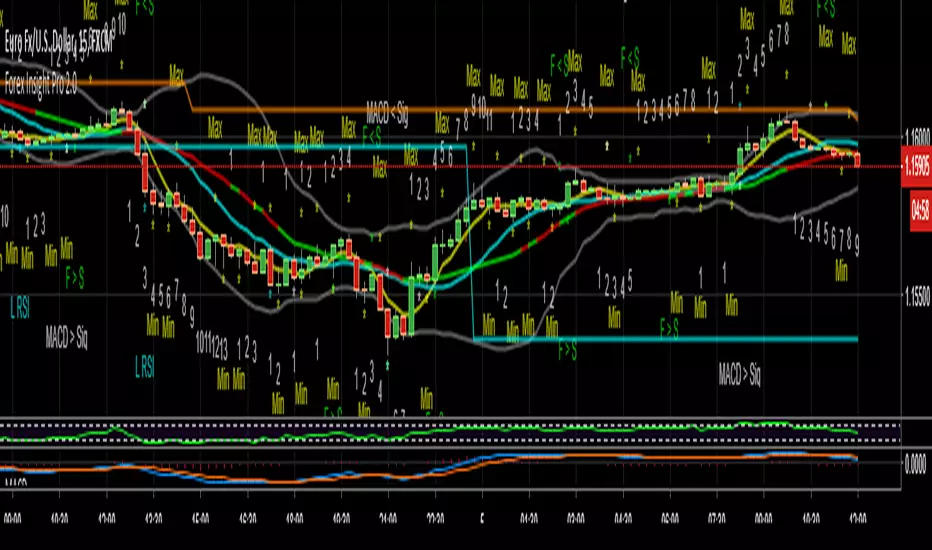
Forex Insight Pro 2.0
Forex Insight Pro 2.0 for TradingView gives you abilities to see the stories hiding in the graphs of markets. It marks important parameters that are happening on the graph including:
Helps you to label the numbers from sequential counting of CCX which compares the Close price of the right bar to the Close price of the left bar in a group of X price bars. For example CC5 will compare the Close of right bar (current bar) to the Close of left bar in a group of 5 price bars (right, left and other 3 bars in the middle). If the close of right bar is higher than the close of left bar, an increasing number will be printed above the right bar. On the other hand, an increasing number will be printed below the right bar if the close of right bar is lower than the close of left bar. Sequences of consecutive increasing numbers above or below the price bars indicate buying or selling pressure in the market.
Helps you to generate CCX Support and Resistance levels which are the highest or lowest prices in the range of settable number of bars. For example, if 9 consecutive CC5 below the price bars is specified, the resistance line will be plotted at the highest price of the most recent 9 bars. Similarly, if 9 consecutive CC5 above the price bars is specified, the support line will be plotted at the lowest price of the most recent 9 bars. These CC5 support and resistance levels often become important price structures in the graph for breakout or trend reversal later on.
Helps you to notice whether the level of MACD is increasing or decreasing by plotting Bollinger bands with the middle band coded in colors. The red middle band means the MACD is decreasing and the green middle band means the MACD is increasing. Increasing or decreasing MACD values may warn you of following increasing or decreasing prices. The Bollinger middle band also play an important role in determination of the price trend. The prices below and above the middle Bollinger band often indicate on going downtrend and uptrend, respectively. Increasing MACD while the Bollinger bands are squeezed often followed by band expansion and price breakout upward. On the other hand, decreasing MACD while the Bollinger bands are squeezed often followed by band expansion and price breakout downward.
Helps you to notice high level of RSI value by printing "H RSI" above the price bar if the RSI value is greater than the preset value such as 70% or notice low level of RSI value by printing "L RSI" below the price bar if the RSI value is less than the preset value such as 30%. The "H RSI" and "L RSI" could be used as warning signs that the reversal of the price trend might follow in the near future.
Helps you to notice the crossing of MACD line and its smoothing Signal line by printing "MACD > Sig" below the price bar if the MACD line crosses above the Signal line and printing "MACD < Sig" above the price bar if the MACD line crosses below the Signal line. Crossing of MACD and Signal lines could be used as warning signs that the reversal of the price trend might follow in the near future.
Helps you to notice the crossing of MACD line between the positive and negative zones by printing "MACD > 0" below the price bar if the MACD line changes to positive region and printing "MACD < 0" above the price bar if the MACD line crosses into the negative region. Changing the sign of MACD value could be used as warning signs that the reversal of the price trend might follow in the near future.
Helps you to notice the crossing of the fast simple moving average line and slow simple moving average line by printing "F > S" below the price bar if the fast SMA line crosses above the slow SMA line and printing "F < S" above the price bar if the fast SMA line crosses below the slow SMA line. Crossings of fast and slow SMA often indicate reversal of the price trends.
Helps you to label the Local Maximum and Local Minimum bars. If the high price of the middle bar inside a group of 3 bars is higher than its left and right neighbors, the label "Max" is printed above that middle price bar. Similarly, the label "Min" is printed below that middle price bar if the low price of it inside a group of 3 bars is lower than those of its left and right neighbors. Local Maximum and Minimum helps a lot in drawing the most recent supply and demand lines in which the price may breakout from.
Parameters of features in the above list could be changed, or turned on/off easily in the input options.
The source code of Forex Insight Pro 2.0 custom indicator is protected. Only invited TradingView members can apply this indicator to their forex, crypto currencies and stock price charts. Lifetime invitation is for 100 USD with free future upgrade and online support. Rental invitation is for 10 USD/month. Paypal and Bitcoin payments are welcome.
The author (Nimit Chomnawang, Ph.D) can be contacted at
Bollinger Bands (BB)
T3 Bollingers Bands Fibonacci Ratios, ver. 3Bollinger Bands featuring:
1. Kalman filter based on Tillson MA for drawing BB
2. Fibo levels within BB
3. Logistic correlation for coloring uptrend/downtrend sections of BB
4. Volume-based bar coloring
5. Jurik MAs for crossovers

Multi SMA EMA WMA HMA BB (5+5 MAs + Bollinger Bands) MTF by RRBMulti SMA EMA WMA HMA BB (5+5 Moving Averages of Any Type with Bollinger Bands) MTF by RagingRocketBull 2018
Version 1.0
This indicator shows multiple MAs of any type (SMA EMA WMA HMA etc) with BB and MTF support
There are several versions: Simple, MTF, Pro MTF and Ultimate MTF. This is the MTF version. The Differences are listed below. All versions have BB
- Simple: you have 2 groups of MAs that can be assigned any type (5+5)
- MTF: +assign 1 custom Timeframe to any group combo (5+5 Custom TF)
- Pro MTF: +multiple Timeframes for multiple MA groups (4*3 MTF), horizontal levels and show max bars back options
- Ultimate MTF: +individual settings for each MA, multiple Timeframes
There are 2 groups of MAs, 3rd group is BB. You can:
- show/hide all MAs in a group. Use length 0 to hide a particular MA independently or uncheck in Style.
- apply any MA type to all MAs in a particular MA group. For example, you can assign all EMAs the HMA type. Groups are called EMAs and SMAs just for reference.
- assign Custom Timeframe to a particular MA/BB group combination or all groups. For example, show daily (D) EMAs+SMAs on H1 Timeframe, or only H4 (240) BB on H1.
You can use different types of MAs as dynamic S/R levels to trade of off and MA crosses as signals for possible trend change (golden/death bull/bear crosses).
Current Timeframe MAs can be used together with Custom Timeframe MAs on a single chart. Higher TF MAs are more important than lower TF MAs.
Most common MA types are: SMA, EMA, WMA, HMA.
Most common MA lengths are: 12, 20, 26, 30, 50, 100, 200, 400 etc.
MTF Notes:
- Script UI uses simple timeframe textbox instead of input resolution dropdown to allow for 240 120 and other custom TFs
- Groups that are not assigned a Custom TF will use Current Timeframe (0).
- MTF will work for any MA type assigned to the group. BB group always uses SMA type.
- MTF works both ways: you can display a higher TF MA/BB on a lower TF or a lower TF MA/BB on a higher TF.
- MTF MA values are normally aligned at the boundary of their native timeframe. This produces stair stepping when a higher TF MA is viewed on a lower TF.
Therefore Point Density/Smoothing is applied by default on MA MTF for visual aesthetics. Set to 0 to disable and see exact ma mtf values (lines with stair stepping and original mtf alignment).
- Smoothing is disabled for BB MTF because fill doesn't work with smoothed MAs after duplicate values are replaced with na.
- MTF MA Value fluctuation is possible on the current bar due to default security lookahead
Features:
- 2 groups of custom 5+5 MAs of any type including Hull Moving Average (HMA)
- BB
- 1x Custom Timeframe with step line smoothing for 3 groups (MAs + BB)
1. based on 3EmaBB, uses plot, fill, security, change, barstate, stdev and custom hma functions
2. you can't set certain constants from input due to Pinescript limitations - change the code as needed, recompile and use as a private script version
3. you can't have plot* inside ?/if/for/function, and implementing condition forks using 2 sets of plots (na vs non-na) doubles indicator params and styles - confusing
4. swma has a fixed length = 4, alma and linreg have additional offset and smoothing params
Feel free to use. Good Luck!

Multi SMA EMA WMA HMA BB (5+5 MAs + Bollinger Bands) by RRB
Multi SMA EMA WMA HMA BB (5+5 Moving Averages of Any Type with Bollinger Bands) by RagingRocketBull 2018
Version 1.0
This indicator shows multiple MAs of any type (SMA EMA WMA HMA etc) with BB on a chart at the same time with/without MTF support depending on the version.
There are several versions (published later): Simple, MTF, Pro MTF and Ultimate MTF. This is the Simple version. The Differences are listed below. All versions have BB
- Simple: you have 2 groups of MAs that can be assigned any type (5+5)
- MTF: +assign 1 custom Timeframe to any group combo (5+5 Custom TF)
- Pro MTF: +multiple Timeframes for multiple MA groups (4*3 MTF), horizontal levels and show max bars back options
- Ultimate MTF: +individual settings for each MA, multiple Timeframes
You can use different types of MAs as dynamic S/R levels to trade of off and MA crosses as signals for possible trend change (golden/death bull/bear crosses).
Most common MA types are: SMA, EMA, WMA, HMA.
Most common MA lengths are: 12, 20, 26, 30, 50, 100, 200, 400 etc.
Features:
- 2 groups of custom 5+5 MAs of any type including Hull Moving Average (HMA)
- BB
1. based on 3EmaBB, uses plot, fill, stdev and custom hma functions
2. swma has a fixed length = 4, alma and linreg have additional offset and smoothing params
Feel free to use. Good Luck!

yutas_RSIver .2.5
Displays signs of two types of RSI (available for different time frames).
二種類のRSI(別のタイムフレーム使用可能)のサインを表示。
VPTbollfibThis indicator based on VPT (volume indicator that show buy and sell power) and Bollinger fibo lines..
So entry is when VPT crossing up the lower fib.. sell is opposite..
I make it open code so have fun and try to make it better:)
alerts inside
Stochastic Bollinger BandsThis indicator started off as a bit of an experiment, but it ended up looking quite useful.
It plots closing price (which can be changed) in relation to the bollinger bands upper and lower bands. This relationship is then run through a Stochastic function much like RSI is with StochasticRSI.
This plot line is smoothed with the K Smoothing value in the settings, and then this plot line is smoothed again with he D Smoothing value to give a signal line.
When the plot lines are outside the horizontal upper and lower limit lines, then this indicates that price is outside the bollinger bands. This can indicate entry and exit signals.
In the background, there is an area plotting a stochastic version of the Bollinger Band width. This would show periods of high and low volatility as it relates to previous volatility.
The stochastic length for the width is set to be very long (144 periods) in order to encapsulate a long range of values to compare to.
Default Settings:
==============
Source: The data point in which to compare to the upper and lower Bollinger Bands - set to close.
BB Length: The length in periods to generate the moving average used for the bands - set at 20 periods.
Mult: This is the multiplier used in the calculations for the bands - set at 2.
BB Width Stochastic Length: This is how far back it looks to compare the current width of the bands to previous widths - set at 144 periods..
BB Stochastic Length: This is how far back to compare closing price in relation to the bands - set at 14 periods..
K Smoothing: This is used to smooth the Stochastic Bollinger band value - set at 3 periods.
D Smoothing: This is a moving average of the smoothed K value in order to provide a signal line - set at 3 periods..
Moving Average Type: This allows you to use either a Simple moving average or an Exponential moving average - set for SMA.
------------------------------------------------------------------------------------------------
Kindest Regards
Created 2018 - by @Squiggles#8806
LTC Tip Jar: LX4bUBdjiRPsagUbZoAczSGgDC4YqTJL7w
Profit Trailer Feeder affiliate link: cryptoprofitbot.com


BB5. Bollinger Bands 5 (oringan)This is bollinger-bands. you can set up 5 BB with this one script.
there are 2 other formular.
0 : classic
1 : my own BB
2 : ATR based BB
I made many custom alert. total 16 alert condition you can see in this script.

CryptoGuru Signals [v2018-08-25]Built an all in one indicator providing buy / sell signals for CryptoGuru
from the ProfitTrailer trading bot discord as a Birthday Present for him.
Others on the discord seemed to like it so I am publishing it here for general use.
He made a request in our TradingView channel:
I'm looking to put together a buy signal for a 5 min time
frame that shows alerts me when a coin in BTC pairs. Is at
the lower of B.B. band or below the lower B.B. band combined
with RSI 30, and a 8/13 cross with the cross showing the coin
moving in up trend.
I made the indicator generic so it will work with any market, trading pair and timeframe.
You can select between ticker price / period or closing price.
The script uses multiple indicators including an EMA cross as its main signal and then optionally
makes use of RSI and Bollinger Bands to support the cross.
These individual indicators parameters can all be configured via the input screen and their colours
changed to suit your preference.
The display of the EMA lines is optional as is the display of the RSI and Bollinger Bands. The
signals will always display based on whatever input criteria you provide. If your input values
don't produce any signals then adjust them until they do.
Copyright (c) 2018, Grant Cause / CryptoCoyns


Fixed TF BBandsCombined daily and 3D Bollinger Bands into one indicator. It will show the BBands uncoupled from the current candle TF's
MA Study: Different Types and More [NeoButane]A study of moving averages that utilizes different tricks I've learned to optimize them. Included is Bollinger Bands, Guppy (GMMA) and Super Guppy.
The method used to make it MtF should be more precise and smoother than regular MtF methods that use the security function. For intraday timeframes, each number represents each hour, with 24 equal to 1 day. For daily, 3 is 3 day, for weekly, 4 is the 4 weekly, etc. If you're on a higher timeframe than the one selected, the length will not change.
Log-space is used to make calculations work on many cryptos. The rules for color changing Guppy is changed to make it not as choppy on MAs other than EMA. Note that length does not affect SWMA and VWAP and source does not affect VWAP.
A short summary of each moving average can be found here: medium.com
List of included MAs:
ALMA: Arnaud Legoux
Double EMA
EMA: Exponential
Hull MA
KAMA: Kaufman Adaptive
Linear Regression Curve
LSMA: Least Squares
SMA: Simple
SMMA/RMA: Smoothed/Running
SWMA: Symm. Weighted
TMA: Triangular
Triple EMA
VWMA: Volume Weighted
WMA: Weighted
ZLEMA: Zero Lag
VWAP: Vol Weighted Average
Welles Wilder MA

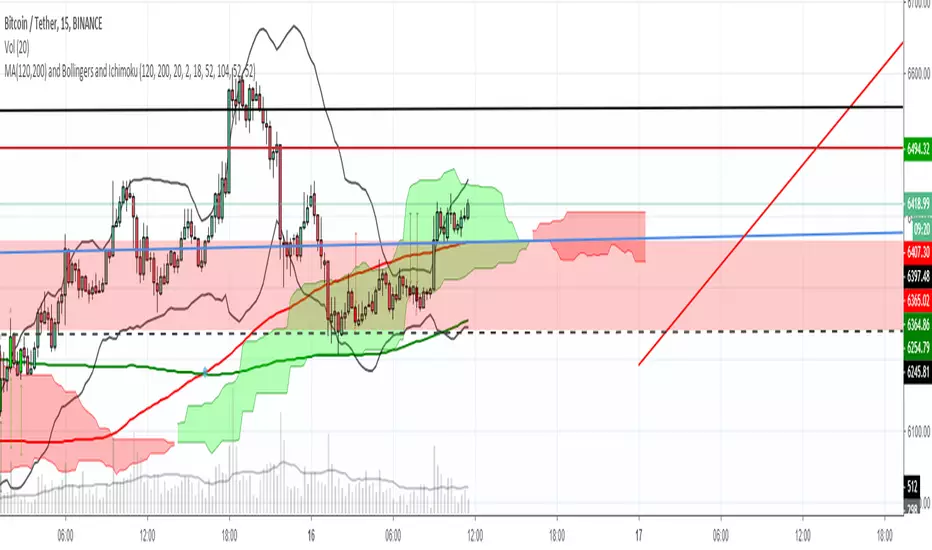
MA(120,200), Bollingers and IchimokuFor you, people who want to put money in trading instead of Tradingview, and still want to have more than 3 indicators ❤
Bolinger Bands & Parabolic SARYou can use Bollinger Bands and Parabolic SAR at the same time.
You can choose BB Moving Average Type from SMA, EMA, RMA, WMA.
(if you want to use another type of MA , let me know)
ボリンジャーバンドとパラボリックSARを同時に描画します。
BBの中心線はSMA、EMA、RMA、WMAから選択できます。
(ほかに使いたい中心線があれば相談ください)

MFI/RSI with Volatility Bands [LazyBear (edited)]Edited version of the script by LazyBear.
Update of my previous script.
Features:
- plot both MFI and/or RSI (LazyBear only allows one of both)
- plot RSI/MFI band (over sold - mid - over bought) + indicator lines

MFI/RSI with Volatility Bands [LazyBear (edited)]Edited version of the script by LazyBear.
Update of my previous script.
Features:
- plot both MFI and/or RSI (LazyBear only allows one of both)
- plot an indicator band (over sold - mid - over bought)


BB & KCThis script is a mix of both the default Bollinger Bands and the default Keltner Channels.
It helps in identifying the squeeze of the bands and also the consolidation of the price movement.

3 in 1 (BB, Stoch ,rsi) with alert On the chart there are the BB with purple and green circles to give the entry signal once the price has come back in the bands.The background alert appair when BOTH RSI and STOCH are in overbuy or oversell. the defalt is 20/80 but can set it by yourself.

Tersus Bollinger Bands Scalping Indicator V1.1Tersus Scalping Indicator
Tersus Scalping Indicator places buy and sell signals for Bitcoin in key areas using Bollinger Bands, Moving Averages, and Trend Analysis.
This indicator is very easy to use and makes for a great second opinion when trading.
The buy and sell positions are marked with B for buy and S for sell, in addition adds to position are market with red and green triangles.
The Bollinger Bands show general constriction and turn from red to green depending on market conditions. Red meaning bearish market, and green meaning bullish.
There are a number of lines all over the place and at first glance they can seem daunting. This is what they mean. The green and yellow dotted lines mark sell target stages 1 and 2, and buy target stages 1 and 2. The red dotted line is your buy and sell stop. The light blue is your buy and sell entry.
The candles also change color depending on if things are over sold or over bought using the Stochastic RSI. Purple for overbought and yellow/orange for oversold. The bars will also change to light blue during entry.
This should be limited to the 15 minute time frame for now. I have noticed some very good signals on the daily and some other time frames but this was written for 15 so don't expect it to be as accurate.
For purchasing information please direct message me.
