MACD+BB (SH v1.1)Twitter: @DrSHelmet. All credit and thanks to @cryptobiasfunke for this strategy.
Disclaimer: I take no responsibility for your usage of this indicator.
Description:
Indicator version: 1.1
This custom script plots the MACD histogram, applies Bollinger bands to the histogram, and then colours the Bollinger bands in different colours depending on whether the bands are contracting or expanding.
Suggested strategy:
Periods of low volatility, seen in a Bollinger band pinch, are followed by large moves (BB expansion). A contraction of the MACD BB may similarly precede a significant move in price. This indicator allows you to see when such a move may be starting, by watching for colour change (default: blue-->orange) on the BB lines after a BB pinch has occured. If the MACD histogram is increasing in magnitude and surfing the BB in a certain direction, this suggests a price move is starting in the direction of the histogram.
Intended for short-timeframe scalping (<1hr charts), but initial testing suggests some validity on higher timeframes.
Bollinger Bands (BB)

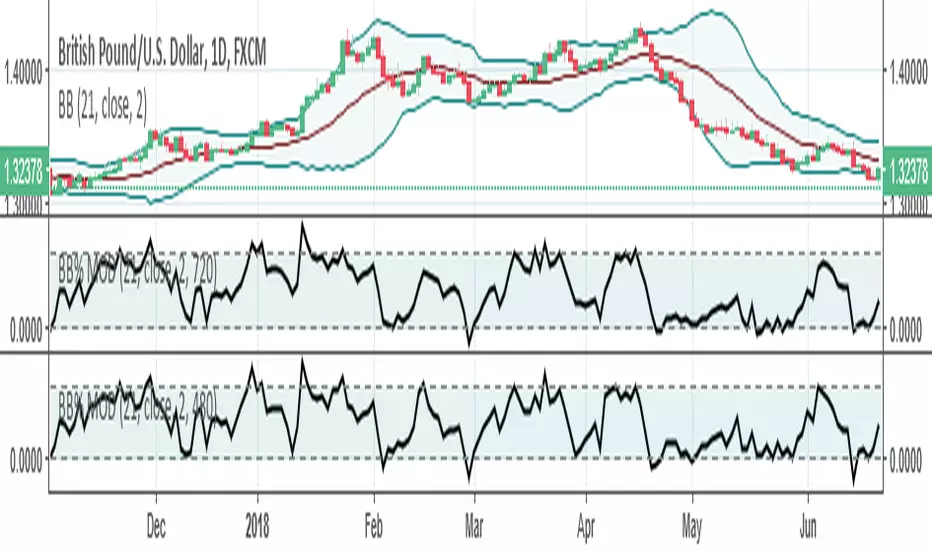
BB% MODHELLO EVERYONE !
I created this indicator to simplify my life in the study of the bollinger bands on a multi-time frame optics.
It works exactly like the bollinger bands %B you have of defaul inside tradingwiew;
BUT you can choose via an integrated button that I integrated if you see the indicator on the chart timeframe or a custom time frame, which can be changed via a window
Timeframe that you can choose from the window: 1M, 3M, 15M, 30M, 45M, 1H, 2H, 4H, 8H, 12H, D, 3D, W
For more info contact me in PM
I usually answer in 1/3 Day
BB% MODHELLO EVERYONE !
I created this indicator to simplify my life in the study of the bollinger bands on a multi-time frame optics.
It works exactly like the bollinger bands %B you have of defaul inside tradingwiew;
BUT you can choose via an integrated button that I integrated if you see the indicator on the chart timeframe or a custom time frame, which can be changed via a window
Timeframe that you can choose from the window: 1M, 3M, 15M, 30M, 45M, 1H, 2H, 4H, 8H, 12H, D, 3D, W .
For more info write me in PM.
I answer in 24/48 H

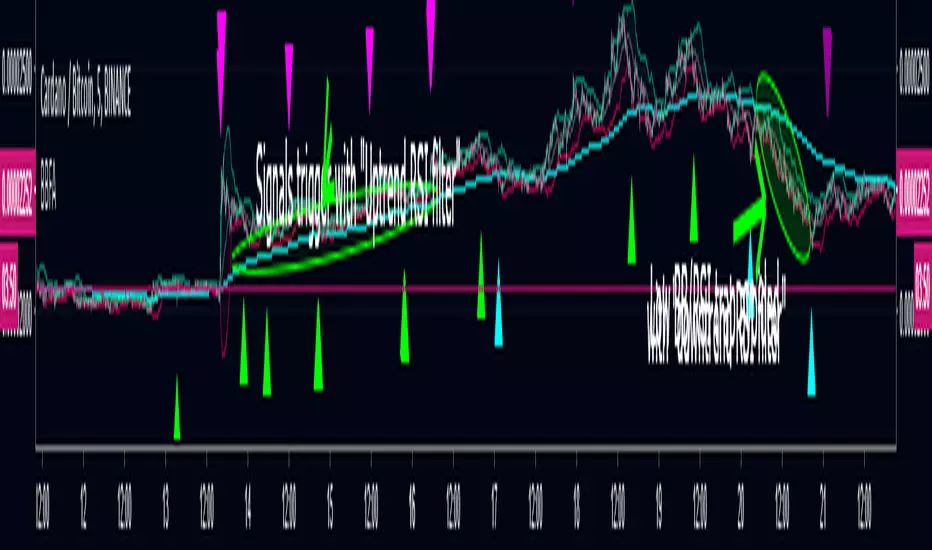
BB Filtered AlertsBollinger Band signals filtered with dual RSIs and EMA.
EMA confirms trend.
Signals above EMA are filtered with "Uptrend RSI" filter
Signals below EMA are filtered with "Downtrend RSI" filter
There is no "one size fits all" setting. Settings are very period and name specific, depending on ATR.
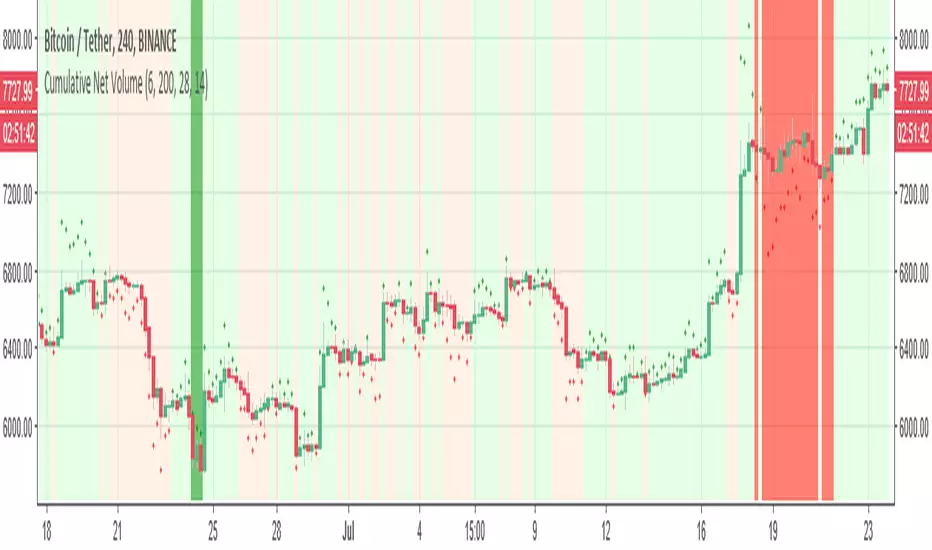
Cumulative Net VolumeThis indicator calculate the Cumulative Net Volume (volume in versus volume out) as seen in red and green cross
I normalize it to be as price indicator -then using color setting it easy to see when volume influx is positive compare to negative period
next step -I add rsi and Bollinger to highlight the area where volume is going up or down with the best period by rsi and Bollinger (green red)
it easy indicator for starter to see where the best buy or sell point
have fun
DBT BandsThe DBT Bands were designed in cooperation with RollinInCrypto. They are bands that find bull and bear divergences. These divergences are perfect in conjunction with the bands for sideways trading. Once a gold ray has formed it is signaling a bear divergence and you should take a short position if price action is confirming a bear move. Maintain a tight stop and target the mid or lower bands. Once a purple ray has formed it is signaling a bullish divergence and you should be looking for a long position if price action is confirming the move. Maintain a tight stop and target the mid or upper band. This indicator is best used on a 15min or 30min time frame on BTCUSD. Do not trade divergences in very strong trends, the divergence is typically not strong enough to reverse the trend. It is best to trade these divergence in a clear sideways pattern when the bands are not too expanded and price is consolidating.
Use at your own risk. This is not financial advise and this indicator is not guaranteed to make you profits. Please message me if you have any questions or feedback. Enjoy.
This is the Official release of the DBT Bands. It will be available on my website upon launch. Please do not ask for access. If you would like access please go to my website once it releases, Thank You.

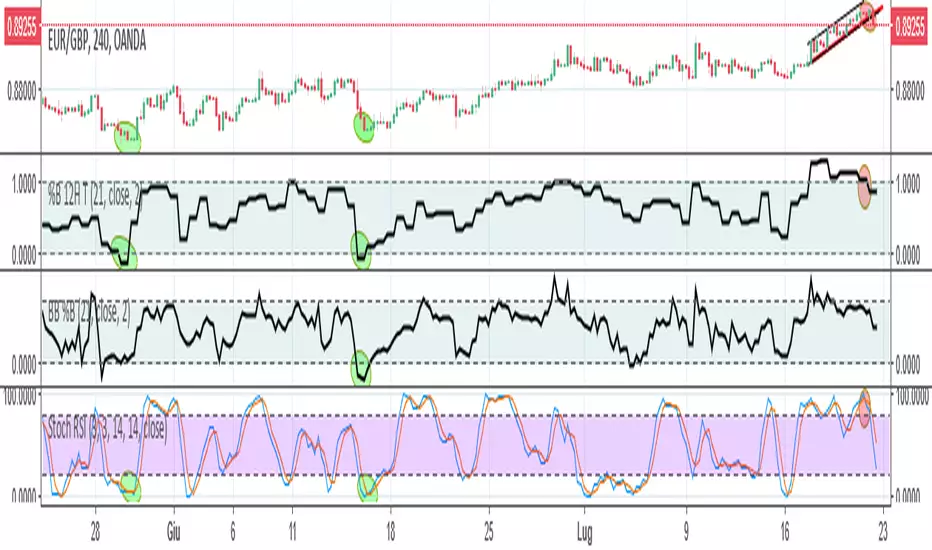
%B 12H THello everyone , I want to share with the comunity my work for look BB %B in a different timeframe without having to change it every time.
I had done to look and study different or multi timeframe a BB %B
I have programmed the script so that it is completely identical to the default one of tradingwiew to simplify its use at all.
I hope this work can be useful to someone else who likes the concept of standard deviation at the base of the bands conceived by Bollinger, but seen as multi timeframe.
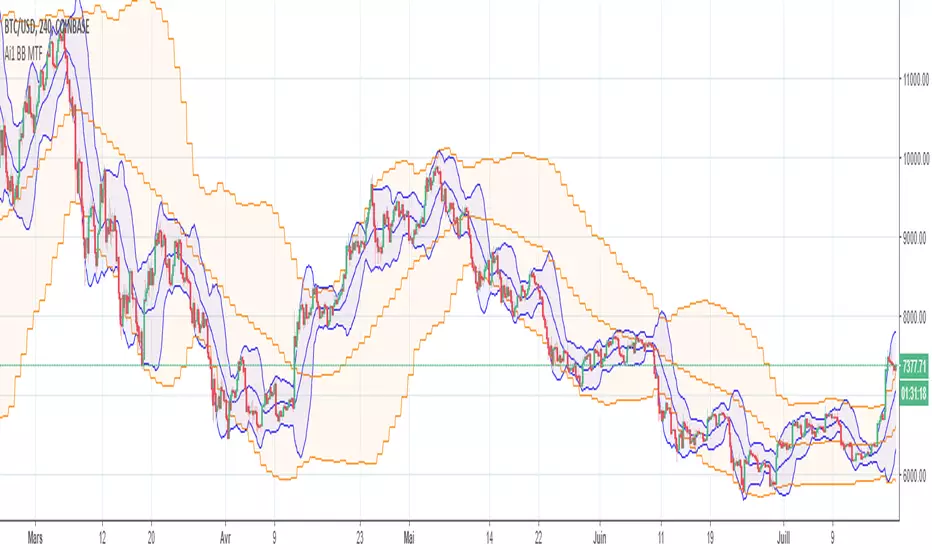
All-in-One Solutions - Bollinger Bands MTF (BB incl Log Scale)Hello,
This indicator is able to plot up to 2 Bollinger Bands in different time frames.
This indicator also solves the issue encountered with TradingView BB in Log scale :
Here is a screenshot of the menu you will have access to:
imgur.com
The alerts are also fully functional if you want to be alerted when value crosses a upper or lower band :
imgur.com
Please contact me in order to get access to this indicator. Please note that by subscribing to my offer, you will have access to all indicators I made and and the futur indicators I will develop according to the demand of the community.
After subscribing, all indicators will be added into your "under invitation indicators list" or you can have a look on my Tradingview page: fr.tradingview.com
I hope my indicators will help you !
volumetrenbollOk in this version which is follow up of volume trend1
we can set the main buy points by the Bollingers (there are two ,only one shown) and length of volume look back
the main buy point is B =buy controlled by Bollinger 1
the exit point control by Bollinger 2
I put also U= up trend volume--there is no alert for it but represent volume increase per bar that significance= uptrend
cycle start from B to S in between you can see the U
have fun
this is set to 1 hour frame , twiking is your job:)

Bollinger Bear Sniper/StudyThis is a simple study with buys and sells alerts. This study uses Bollinger Bands to identify strong candles, buys in the middle of candle and sells on the close of candle without holding any position longer than the period of the candle. This is for those who want to make small profit or loss and move on rather than hodling in down trend market. With this approach, bags and hodling are avoided. You either gain on each candle or lose. When your gains are more than your loses then you are in good business.
Since buys are made on candles that have shown strong upward movement and sells on the close of the same candle, loses or completely minimized. This ensures that higher percentage of the transactions result in profit. This works best when use on 30 minutes or above candles.
Use it at your own risk we are NOT responsible.

Automatic Support and Resistance %BThis script create support and resistance lines based on %B indicator
The script is multi timeframe.
Enjoy

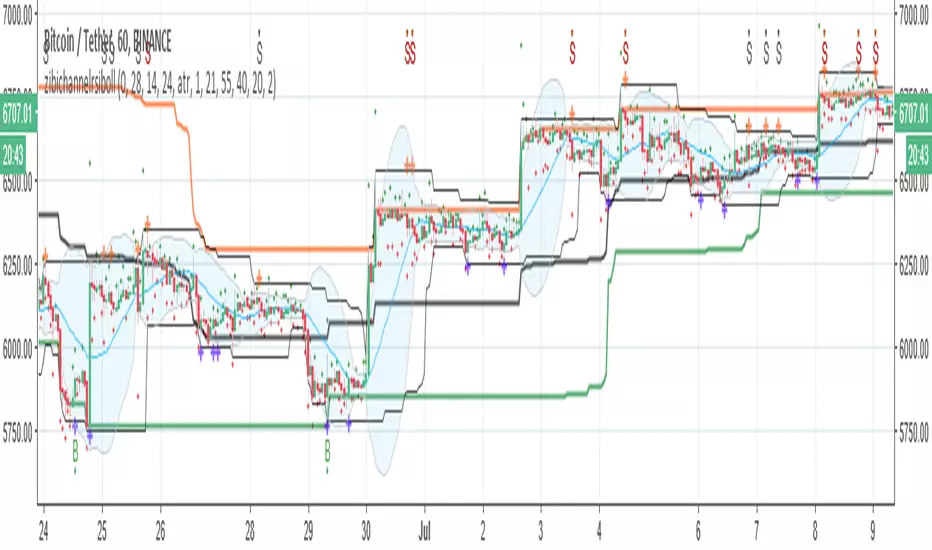
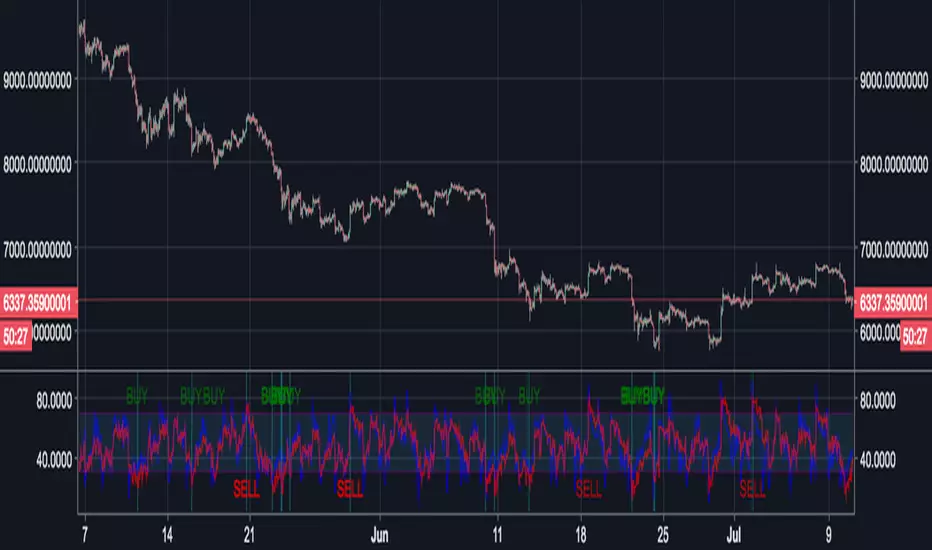
zibichannelrsibollthis version has ATR and RSI and boll combination with zibichannel
the buy point are agreement of ATR Bollinger and RSI (B)
two exit point (red S=agreement of ATR Bollinger and RSI , black S =agreement of ATR Bollinger
alerts inside
Advanced Bollinger BandsThis is a more advanced version of the standard Bollinger Bands indicator. It allows you to change the type of the moving average (Simple, Exponential, Weighted, Volume-weighted, Triple EMA or a moving average that uses RSI ). The indicator also allows you to volume weight the indicator (turned on by default). If you want to weight the oscillator against the true range instead of volume this is also possible. By default, this will be done automatically for assets that do not support volume .
Bollinger Bands %bb (normalised) & RSIIndicator for displaying both Bollinger Bands %bb (normalised) and RSI simultaneously (Usual 0 - 1 range of BB normalised to the 30 - 70 range of RSI).
When both Bollinger Bands %bb and RSI are OB/OS then the column will turn blue and a buy/sell arrow will appear in the indicator provided other conditions pertaining to the OB/OS condition in one of the last two candles are also met.
I use this mainly for Cryptocurrencies for shorter time periods to indicate possible trade opportunities.
You could also set an alert on the arrow indicator appearing to auto trade.
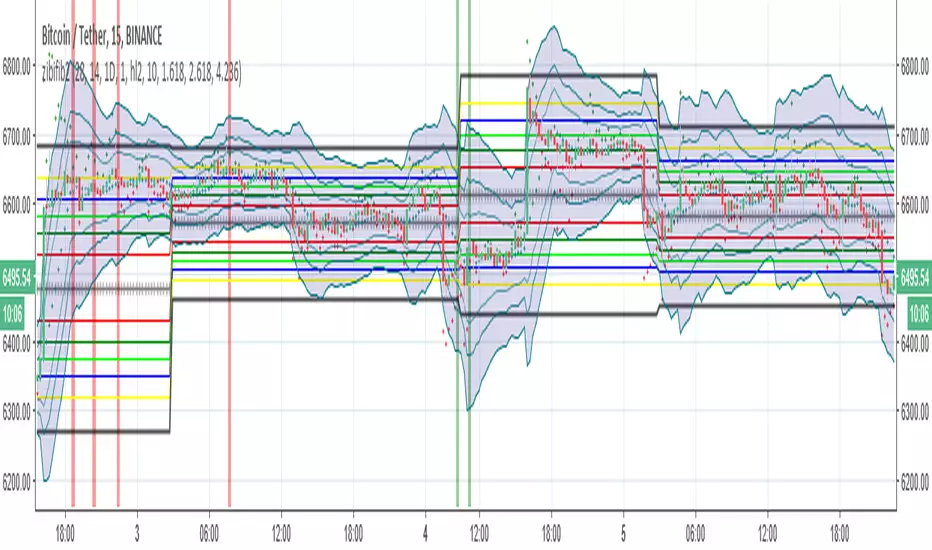
zibi fib3This is major update to Zibifi2 with addition of vwma fibs in order to remove issue that can happen with regular daily fibs (they sometime send bad signals)
in this version the addition will help to eliminate that effect
major buy points in green and red
minor buy and sell points are in lime and orange
have fun

zibi fib2so how this system work:
1. zibi is a volume indicator that similar to obv but it calculate volume per candle differently (my idea)
2.fib
3.bolliger fib
zibi is overshooting indicator since it a volume indicator per candle its signal is before the price candles and its allow us to cross the fib in a smart way
when ever zibi is bellow lowest fib it also in lowest volume possible so buy will be only if it volume start to increase and then we expect the price to move up
since we buy in lowest fib then the cycle will go from down to up as the sell will be exact the opposite.
next we add Bollinger fib to constrain the overshooting of zibi so optimal point only are selected
inside there are alerts ready
for testing check the strategy version of this indicator that combine volume and fib
have fun
BAHbO - multi indicators and signals SMA,BB,RSI,Engulfing,Signal4 SMAs - 9,21,55,200
Bollinger Bands - 21
Engulfing patterns
Fractal Support Resistance
Bullish and Bearish Engulfing signals
Engulfing Candles
Bollinger Bands + RSI combined indicator with signals


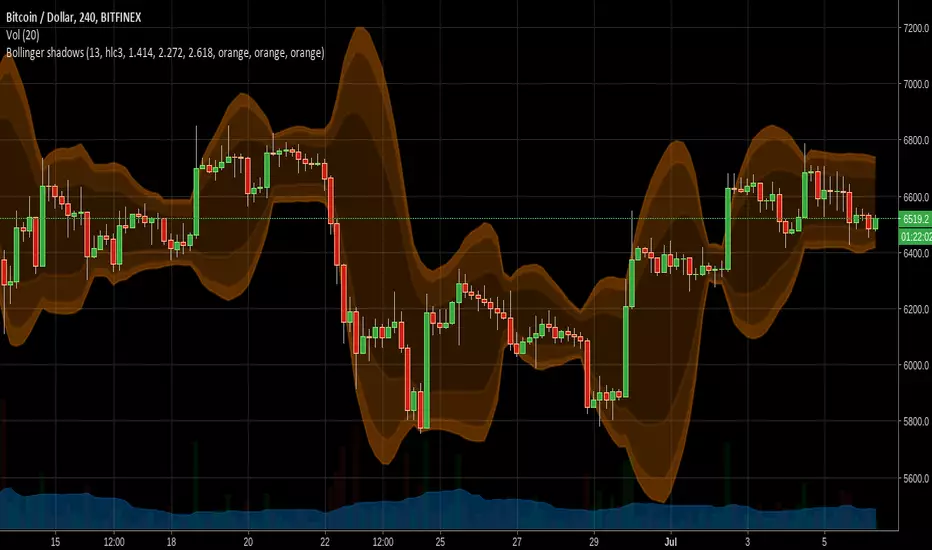
Cooltoyz : Bollinger ShadowsFinally, another gadget for the cooltoyz series :)
this is a simple tool to allow vizualizing bollinger bands with several values/levels. usually boll bands have the levels at 1.5, 2, 3, for multiplier of standadrd deviations. but, just changing those values, we can apply fibbonnaci levels to the bands.
The inputs on this indicator come with fib levels by default, but the values are part of input fields, so it's easy to change to whatever you prefer, back to the calssic std.deviation values, for example. also, the colors are set to make a visual slope, so it's more instinctive to see how strong the candles are moving.
just play with it, and like it. or not :)
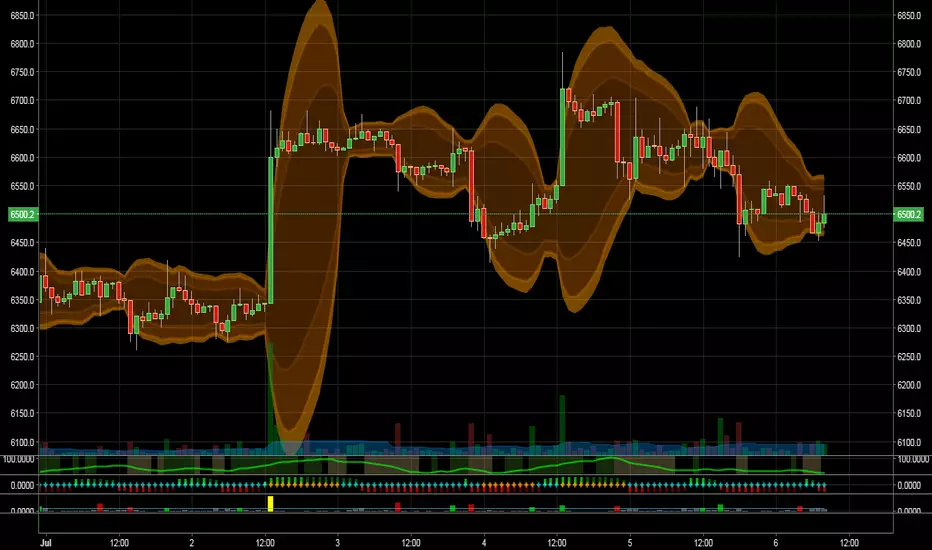
here is another example, where the colors are reversed, to create a more classic "shadowy" effect.
i just like to have the edge level set stronger, it's easier to see when stuff is "on fire" :)
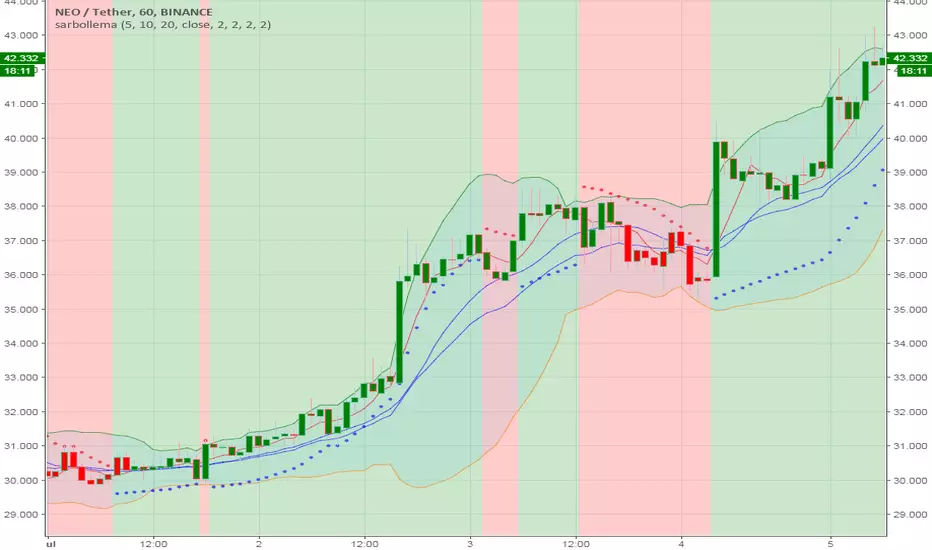
sarbollemav1same as the older version just added support and resistance level to make life more easy
alerts inside for 2 buy points =sar cross and the other based on ema over ma

Cooltoyz: Multi level Bollinger ShadowsFinally, another gadget for the cooltoyz series :)
this is a simple tool to allow vizualizing bollinger bands with several values/levels. usually boll bands have the levels at 1.5, 2, 3, for multiplier of standadrd deviations. but, just changing those values, we can apply fibbonnaci levels to the bands.
The inputs on this indicator come with fib levels by default, but the values are part of input fields, so it's easy to change to whatever you prefer, back to the calssic std.deviation values, for example. also, the colors are set to make a visual slope, so it's more instinctive to see how strong the candles are moving.
just play with it, and like it. or not :)

sarbollemaThere is two buy points one based on ema cross MA= long short alert
sar up or down= long1 short1
color change by change of sar
and bollinger to have fun