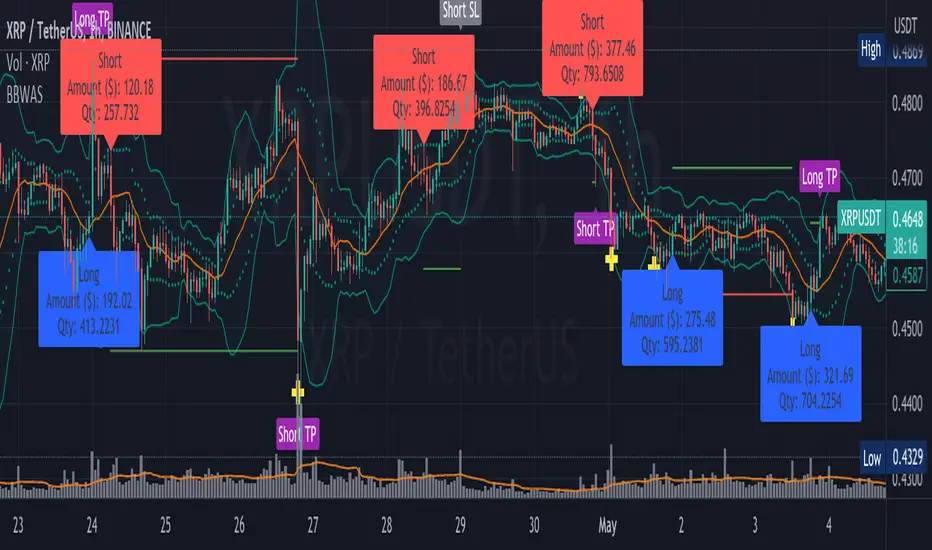
BBWAS Enhanced with Webhook Alerts and Money ManagementThe Enhanced BBWAS Indicator is a powerful tool designed to identify breakouts in the price of a security or asset. It utilizes Bollinger Bands, which consist of three lines: the upper band, the lower band, and the middle band (or basis). These bands help define the expected price range within which the asset is likely to fluctuate.
When the price breaks above the upper band or below the lower band, it indicates a potential breakout. A bullish breakout occurs when the price closes above the upper band, while a bearish breakout occurs when the price closes below the lower band.
In this enhanced version of the indicator, several new features have been added to provide more flexibility and functionality:
Webhook Alerts: Traders now have the ability to configure webhook alerts to trigger a bot or any external system. This allows for timely notifications when a breakout occurs, enabling automated actions or manual intervention as desired.
Multiple Moving Average Types: The indicator now supports different types of moving averages for increased customization. Traders can choose from popular moving average types such as Simple Moving Average (SMA), Exponential Moving Average (EMA) and Weighted Moving Average (WMA). This enables users to experiment and find the moving average type that best suits their trading strategy.
Money Management: To assist traders in managing risk, a money management feature has been incorporated into the indicator. It calculates the optimal position size or number of units to purchase for each trade, considering the desired risk per trade. By specifying a maximum risk per trade, traders can ensure that their position sizes are adjusted accordingly, helping to maintain risk control in their trading activities.
Dear traders, while we strive to provide you with the best trading tools and resources, we want to remind you to exercise caution and diligence in your investing decisions.
It is important to always do your own research and analysis before making any trades. Remember, the responsibility for your investments ultimately lies with you.
Happy trading!
Bollinger Bands (BB)
custom Bollinger bands with filters - indicator (AS)-----------Description-------------
This indicator is basically Bollinger bands with many ways to customize. It uses highest and lowest values of upper and lower band for exits. I think something is wrong with the script but cant find any mistakes – most probably smoothing. The ATR filter is implemented but is working incorrectly. In code you can also turn it into strategy but I do not recommend it for now as it is not ready yet.
So this is my first script and I am looking for any advice, ideas to improve this script, sets of parameters, markets to apply, logical mistakes in code or any ideas that you may have. Indicator was initially designed for EURUSD 5MIN but I would be interested in other ideas.
-----------SETTINGS--------------
---START - In starting settings we can choose
Line 1: what parts to use BB/DC/ATR
Line 2: what parts to plot on chart
Line 3 Whether or not apply smoothing to BB or ATR filter
Line 4 Calculate deviation for BB from price or Moving average
Line 5 Fill colors and plot other parts for debug (overlay=false)
Line 6:( for strategy) – enable Long/Short Trades
---BB and DC – here we modify Bollinger bands and Donchian
Line 1: Length and type of BB middle line and also length of DC from BB
Line 2: Length and type of BB standard deviation and multiplier
Line 3: Length and type of BB smoothing and %width for BB filter
---ATR filter – (not ready fully yet)
Line 1: type and length of ATR
Line 2: threshold and smoothing value of ATR
---DATE and SESSION
Line 1: apply custom date or session?
Line 2: session hours settings
Line 3:Custom starting date
Line 4: Custom Ending date
-----------HOW TO USE--------------
We open Long if BB width is bigger than threshold and close when upper band is no longer highest in the period set. Exact opposite with Short

Damage Indicator by Scipio ProScipio Pro's Damage Indicator detects strong momentum on tops and bottoms. It is intended for swing trading.
The script analyzes both recent and less-recent price action and performs candle stick analysis. It also uses SDs and multiple Bollinger Bands to find dynamic levels for entries.
A Bears Damaged signal emerges whenever there is convincing proof of strength at a bottom. Often, when the market reverses quickly, traders are caught offside and are forced to buy higher. The reverse goes for Bulls Damaged signals, which mean there is convincing proof of bearish strength at a (local?) top.
Whether the move gets legs depends in large part on the structure in which the show of momentum takes place. It is sensible to wonder after each signal whether the market structure (and other relevant context such as the majority of cash having been sidelined) dictates that risk-reward is skewed to the upside or to the downside. If, for example, a Bears Damaged signal emerges on the daily and risk-reward on the weekly is skewed to the upside, go 4x larger (again, just an example). If, on the other hand, the same signal emerges on the daily while the risk-reward is skewed to the downside on the weekly, bet much smaller and tighten your stop-loss. For best results, I suggest you always check one timeframe higher for your long-term risk-reward bias. (No financial advice, of course.)
Under Settings you'll find the so-called Noise Protection , which is switched "on" by default. We recommend you keep this switched on. Noise Protection ensures you do not see Damage signals on timeframes lower than the 4 hour. After all, chasing momentum on low timeframes is a losing game. The amount of noise increases exponentially as you move lower down the timeframes. Again, this indicator is for swing trades. Don't use it for scalping.
It should be useful for all assets, but is of course more useful on some than on others. As with all indicators, signals tend to be more meaningful if the asset in question is at least somewhat liquid, for instance.
As always, use at your own risk. Using indicators is no substitute for using one's brain.

5EMA BollingerBand Nifty Stock Scanner
What ?
We all heard about (well: over-heard) 5-EMA strategy. Which falls into the broader category of mean reversal type of trading setup.
What is mean reversal?
Price (or any time series, in fact) tries to follow a mean . Whenever price diverges from the mean it tries to meet it back.
It is empirically observed by some traders (I honestly don't know who first time observed it) that in Indian context specially, 5 Exponential Moving Average (5-EMA) works pretty good as that mean.
So whenever price moves away from that 5-EMA, it ultimately comes back and attain total nirvana :) Means: if price moved way higher than the 5EMA without touching it, then price will correct to meet it's 5-EMA and if price moved way lower, it will be uplifted to meet it's 5-EMA. Funny - but it works !
Now there are already enough social media coverage on this 5-EMA strategy/setup. Even TradingView has some excellent work done on these setups. Kudos to all those great souls.
So when we came to know about this, we were thinking what we should do for the community. Because it is well cover topic (specially in Indian context). Also, there are public indicators.
Then we thought why not come up with a scanner which will scan all the Nifty-50 constituent stocks and find out on the fly, real-time which all stocks are matching this 5-EMA setup and causing a Buy/Sell trade recommendation.
Hence here we are with the first version of our first scanner on the 5EMA setup (well it has some more masala than merely a 5-EMA setup).
Why?
Parts of why is already covered up.
Now instead of blindly following 5-EMA setup, we added the Bollinger band as well. Again: it's also not new. There are enough coverage in social media about the 5-EMA+BB strategy/setup. We mercilessly borrowed from all of these.
Suppose you have an indicator.
Now you apply the indicator in your chart. And then you need to (rock) and roll through your watchlist of Nifty-50 stocks (note: TradingView has no default watchlist of Nifty-50 stock by default - you have to create one custom watchlist to list all manually) to find out which all are matching the setup, need to take a note about the trade recomendations (entry, SL, target) and other stuffs like VWAP, Volume, volatility (Bollinger Band Width).
Not any more.
This scanner will track all the Nifty-50 stocks (technically: 40 stocks other than Banking stocks) and provide which one to Buy or Sell (if any), what's the entry, SL, target, where is the VWAP of the day, what's the picture in volume (high, low, rising, falling) and the implied volatility (using Bolling band width). Also it has a naive alerting mechanism as well.
In fact the code is there to monitor the (Future) OI also and all the OI drama (OI vs price and all the 4 stuffs like long build up, long unwinding, short covering, short buildup). But unfortunately, due to some limitations of the TradingView (that one can not monitor more than 40 `ta.security` call) we have to comment out the code. If you wish you can monitor only 20 stocks and enable the OI monitoring also (20 for stocks + 20 for their OI monitoring .. total 40 `ta.security` call).
How?
To know the divergence from 5-EMA we just check if the high of the candle (on closing) is below the 5-EMA. Then we check if the closing is inside the Bollinger Band (BB). That's a Buy signal. SL: low of the candle, T: middle and higher BB.
Just opposite for selling. 5-EMA low should be above 5-EMA and closing should be inside BB (lesser than BB higher level). That's a Sell signal. SL: high of the candle, T: middle and lower BB.
Along with we compare the current bar's volume with the last-20 bar VWMA (volume weighted moving average) to determine if the volume is high or low.
Present bar's volume is compared with the previous bar's volume to know if it's rising or falling.
VWAP is also determined using `ta.vwap` built-in support of TradingView.
The Bolling Band width is also notified, along with whether it is rising or falling (comparing with previous candle).
Simple, but effective.
Customization
As usual the EMA setup (5 default), the BB setup (20 SMA with 1.5 standard deviation), we provided option wherther to include or exclude BB role in the 5-EMA setup (as we found out there are two schools of thought .. some people use BB some don't. Lets make all happy :))
We also provide options to choose other symbols using Settings if they wish so. We have the default 40 non banking Nifty stocks (why non-banking? - Bank Nifty is in ATH :) .. enough :)). But if user wishes can monitor others too (provided the symbol is there in TradingView).
Although we strongly recommend the timeframe as 30 minutes , you can choose what's fit you most.
The output of the scanner is a table. By default the table is placed in the right-bottom (as we are most comfortable with that). However you can change per your wish. We have the option to choose that.
What is unique in it ?
This is more of an indicator. This is a scanner (of Nifty-50 stocks). So you can apply (our recommendation is in 30m timeframe) it to any chart (does not matter which chart it is) and it will show every 30 mins (which is also configurable) which all stocks (along with trade levels) to Buy and Sell according to the setup.
It will ease your trading activity.
You can concentrate only on the execution, the filtering you can leave it to this one.
Limitations
There is a build in limitation of the TradingView platform is that one can call only upto 40 securities API. Not beyond that. So naturally we are constraint by that. Otherwise we could monitor 190 Nifty F&O stocks itself.
30m is the recommended timeframe. In very lower (say 5m) this script tends to go out of heap (out of memory). Please note that also.
How to trade using this?
Put any chart in 30m (recommended) timeframe.
Apply this screener from Indicators (shortcut to launch indicators is just type / in your keyboard).
This will provide the Buy (shown in green color) or Sell (shown in red color) recommendations in a table, at every 30m candle closing.
Note the volume and BB width as well.
Wait for at least 2 5-minutes candles to close above/below the recommended level .
Take the trade with the SL and target mentioned.
Mentions
@QuantNomad. The whole implementation concept we mercilessly borrowed from him, even some of his code snippet we took it (after asking him through one of his videos comment section and seeking explicit permission which he readily granted within an hour). Thank You sir @QuantNomad. Indebted to you.
Monika (Rawat) ji: for reviewing, correcting, providing real time examples during live market hours, often compromising her own trading activities, about the effectiveness and usefulness of this setup. Thank You madam ji. Indebted to you.
There are innumerable contents in social media about this. Don't even know whom all we checked. Thanks to all of them.
Happy Trading (in stocks - isn't enough of Indices already?)
Disclaimer
This piece of software does not come up with any warrantee or any rights of not changing it over the future course of time.
We are not responsible for any trading/investment decision you are taking out of the outcome of this indicator.

VWAP Xing D, Prv.D, W, Q, M, & Y + SD [UOI]Introducing the "VWAP Xing D, Prv.D, W, Q, M, & Y + SD" Indicator: A Comprehensive, Multi-Timeframe Trading Tool for the Modern Trader
In today's dynamic and fast-paced financial markets, traders require versatile and powerful tools that can help them navigate the complex world of trading. The "VWAP Xing D, Prv.D, W, Q, M, & Y + SD" indicator is designed to be the ultimate, all-in-one solution for traders seeking a comprehensive and robust trading indicator. This cutting-edge tool combines the power of an extensive VWAP library with the versatility of Bollinger Bands, Donchian Channels, standard deviation multi-timeframe analysis, and an auto boxed range identifier, all to provide traders with the crucial insights needed to identify reversals, breakdowns, and breakups.
Offering the magnetic daily, previous day, weekly, monthly, quarterly, and even yearly VWAP levels, this comprehensive library caters to traders with varying time horizons and strategies. Coupled with the precision of Bollinger Bands and Donchian Channels, the indicator allows for accurate tracking of price volatility, enabling traders to make more informed decisions in response to changing market conditions. The integration of multi-timeframe standard deviation analysis further bolsters the indicator's ability to identify potential trading opportunities, ensuring that users can stay ahead of the curve.
Finally, the auto boxed range identifier serves as the cherry on top, automatically detecting critical price levels where reversals, breakdowns, and breakups are most likely to occur. This powerful feature not only helps traders confirm potential entry and exit points but also allows for more effective risk management.
Overall, the "VWAP Xing D, Prv.D, W, Q, M, & Y + SD" indicator is a comprehensive, multi-timeframe trading tool that empowers traders with unparalleled insights, precision, and adaptability. Whether you're a seasoned professional or a novice trader, this powerful indicator is a must-have tool for anyone looking to excel in today's competitive financial markets.
Multi-timeframe Volume Weighted Average
First let's define Volume Weighted Average Price (VWAP):
Volume Weighted Average Price (VWAP) is a widely-used technical analysis indicator that calculates the average price of a security, taking into account both price and trading volume. In essence, it represents the average price at which a security has been traded throughout a specified time period, giving more weight to transactions with higher volume.
The VWAP is often used by traders and investors to assess the market's trend and gauge the relative value of a security. It serves as a benchmark for institutional investors, who often use it to evaluate their trading performance and determine whether they are buying or selling at favorable prices.
The formula for calculating VWAP is:
VWAP = (Sum of (Price * Volume)) / Total Volume
By incorporating volume into the calculation, the VWAP provides a more accurate representation of a security's true average price, as it takes into consideration the impact of larger trades on the price. This makes it a valuable tool for traders seeking to make more informed decisions in the market and avoid getting caught in unfavorable trading positions.
VWAP is a crucial indicator that provides insights into the average price at which a financial asset, such as a stock or cryptocurrency, has been traded throughout a specific period. It takes into consideration the volume of trades executed at each price level during that period. The VWAP lines included in the " VWAP Xing D, Prv. D, W, Q, M, & Y" indicator offer various timeframe perspectives, allowing traders to analyze different levels of market trends and behaviors.
Here's a detailed explanation of the VWAP lines and their significance:
1. Daily VWAP (D): The daily VWAP line represents the average price at which the asset has been traded throughout the current trading day. It resets at the beginning of each trading session. Traders often use the daily VWAP as a reference point to gauge the fairness of their trade executions relative to the prevailing market prices. Price deviations from the daily VWAP can indicate shifts in market sentiment and potential trading opportunities.
2. Previous Day VWAP (Prv.D): The previous day VWAP line reflects the average price at which the asset was traded during the preceding trading day. It helps traders assess the continuity or deviation of the current day's price action relative to the previous day's trading activity. Traders often observe the previous day VWAP for insights into potential support or resistance levels and to identify whether the current day's price is trading above or below the previous day's average price.
3. Weekly VWAP (W): The weekly VWAP line calculates the average price of the asset over the entire week, taking into account the volume traded at each price level. Traders use the weekly VWAP to gain a broader perspective on the asset's price movement and potential trend directions. It can act as a significant support or resistance level, especially when the price interacts with the weekly VWAP.
4. Monthly VWAP (M): The monthly VWAP line provides a longer-term perspective by averaging the asset's price and volume data over the entire month. It helps traders identify key price levels that are significant within the monthly timeframe. Traders often observe the monthly VWAP to assess the overall trend and to determine whether the current price is trading above or below the monthly average.
5. Quarterly VWAP (Q): The quarterly VWAP line calculates the average price and volume data over a three-month period, representing a longer-term view of market activity. Traders use the quarterly VWAP to identify significant price levels and to analyze the broader trend within the quarterly timeframe. Deviations from the quarterly VWAP can indicate potential shifts in market sentiment and trading opportunities.
6. Yearly VWAP (Y): The yearly VWAP line represents the average price and volume data over the course of a year. It offers a comprehensive long-term perspective on the asset's price behavior and trend. Traders often consider the yearly VWAP as a key reference point for assessing the asset's overall performance and identifying major support or resistance levels.
By observing the VWAP lines, traders can gain insights into the prevailing market sentiment, potential support or resistance levels, and deviations from average prices. These deviations can be useful for identifying potential trading opportunities, such as when the price significantly deviates from the VWAP lines, suggesting potential overbought or oversold conditions. Additionally, VWAP can serve as a benchmark for evaluating trade executions and assessing the fair value of an asset.
It's important to note that while VWAP is a valuable tool, it should be used in conjunction with other technical analysis indicators and strategies to make informed trading decisions. Traders should consider factors like market context, trend analysis, and risk management principles to validate signals and confirm potential trading opportunities.
Bollinger Bands and Donchian Channels
In addition to VWAP this indicator also has combined the power of Bollinger Bands and Donchian Channels to produce a solid framework. The time frame by default is set to 30 min which is good for intraday trading but you can also change that in the setting to always use chart time frame intervals which works better on longer time frames.
IMPORTANT: You can change the time frame to always use chart or keep the default on 30 min or change it to another timeframe manually. If you allow the chart to always provide the intervals then the default 30 min will be ineffective and it automatically adjust to chart timeframe. Personally I think a fixed timeframe work better so keep in that way if you trade on 30 min or lower time frame.
Bollinger Bands and Donchian Channels are two popular technical analysis tools that provide valuable insights into price volatility, potential breakout levels, and support/resistance areas. When used in combination, they offer a comprehensive framework for analyzing market conditions and identifying trading opportunities.
Bollinger Bands: Bollinger Bands consist of two lines plotted above and below a moving average, typically a simple moving average (SMA). The upper band is calculated by adding the standard deviation of price multiplied by a customizable standard deviation factor to the SMA. The lower band is calculated by subtracting the standard deviation multiplied by the same factor from the SMA. The key features of Bollinger Bands are as follows:
1. Volatility Measurement: Bollinger Bands expand and contract based on market volatility. When the bands widen, it indicates higher volatility, and when they narrow, it suggests lower volatility. Traders can observe the width of the bands to gauge the potential for price movements and volatility expansions.
2. Overbought/Oversold Levels: Bollinger Bands can help identify overbought and oversold conditions in the market. When the price reaches or exceeds the upper band, it may indicate that the asset is overbought and due for a potential reversal or pullback. Conversely, when the price reaches or falls below the lower band, it may suggest oversold conditions and a possible bounce or reversal.
Donchian Channels: Donchian Channels consist of two lines representing the highest high and lowest low within a specified period. The key characteristics of Donchian Channels are as follows:
1. Breakout Levels: The upper line of the Donchian Channel represents the highest high within the specified period, while the lower line represents the lowest low. Traders often use Donchian Channels to identify potential breakout levels. When the price breaks above the upper channel line, it may indicate a bullish breakout and the potential for further upward momentum. Conversely, a break below the lower channel line suggests a bearish breakout and the possibility of downward momentum.
2. Support/Resistance Areas: Donchian Channels also act as dynamic support and resistance levels. The upper channel line can act as a resistance level where the price may encounter selling pressure. The lower channel line can act as a support level where the price may find buying interest. Traders can monitor price interactions with these levels to make informed trading decisions.
Advantages of Using Bollinger Bands and Donchian Channels Together: By combining Bollinger Bands and Donchian Channels, traders can gain a more comprehensive view of market conditions and potential trading opportunities. Here are some advantages of using them together:
1. Volatility Confirmation: Bollinger Bands help identify periods of high or low volatility, while Donchian Channels confirm breakouts and potential trend changes. When the bands widen and a breakout occurs above or below the Donchian Channels, it can provide confirmation of increased volatility and the start of a new trend.
2. Price Extremes and Breakouts: Bollinger Bands assist in identifying overbought and oversold conditions, while Donchian Channels help pinpoint breakout levels. When price reaches an extreme level according to Bollinger Bands and coincides with a breakout from the Donchian Channels, it can signal a significant trading opportunity.
3. Support/Resistance Validation: Donchian Channels act as dynamic support and resistance levels, and Bollinger Bands can validate these levels. When price bounces off the upper or lower Bollinger Band near a Donchian Channel level, it provides additional confirmation of the support or resistance area.
4. Risk Management: The combination of Bollinger Bands and Donchian Channels enables traders to set more precise stop-loss levels and define risk. They can place stop-loss orders beyond the support or resistance levels identified.
Standard Deviation
Standard deviation bands by default are disabled but you can easily enable them in the setting. The 1 standard deviation bands are made invisible by default to avoid a crowded space. You can reduce the transparency to view them.
In intraday trading, the Daily VWAP (Volume Weighted Average Price) with 3 standard deviations is a powerful tool that helps traders gauge price movements and potential trading opportunities. Here's how it works and why it is useful:
1. Calculation of Daily VWAP: The Daily VWAP is the average price at which a security has traded throughout the trading day, weighted by the volume of each trade. It provides a measure of the average price that traders have paid for the asset during the day.
2. Standard Deviation: Standard deviation is a statistical measure that quantifies the dispersion or variability of prices around the Daily VWAP. It gives an indication of how much prices deviate from the average. A higher standard deviation suggests greater price volatility.
3. Three Standard Deviations: By adding and subtracting three times the standard deviation from the Daily VWAP, you create bands that represent the potential price range within which the majority of intraday trading activity is expected to occur. These bands act as potential support and resistance levels and help traders identify price extremes.
4. Price Reversals: When the intraday price extends beyond the upper or lower band (three standard deviations), it suggests an overextended move or potential price reversal. Traders interpret this as an opportunity to enter or exit trades. If the price moves beyond the upper band, it may indicate overbought conditions and a possible reversal to the downside. Conversely, if the price moves below the lower band, it may signal oversold conditions and a potential reversal to the upside.
5. Volatility and Breakouts: Intraday traders often look for volatility and breakout opportunities. The three standard deviation bands on the Daily VWAP provide valuable information about price volatility. When the price breaks out of the bands, it suggests a significant increase in volatility and potential opportunities for intraday traders to take advantage of strong momentum moves.
6. Risk Management: The three standard deviation bands help traders define their risk and set stop-loss orders. By placing stop-loss orders outside the bands, traders can protect their positions in case the price moves beyond the expected range. This risk management technique allows traders to limit their potential losses and preserve capital.
7. Confirmation with Other Indicators: Intraday traders often use the three standard deviation bands on the Daily VWAP in conjunction with other technical indicators or chart patterns to strengthen their trading decisions. The bands can validate other signals or provide additional confirmation before entering or exiting a trade.
Overall, the Daily VWAP with three standard deviations is a valuable tool for intraday traders as it helps identify price extremes, potential reversals, volatility, and breakout opportunities. By incorporating this indicator into their trading strategies, traders can make more informed decisions and enhance their intraday trading performance.
Auto Boxed Range Detector
The true innovation in the "VWAP Xing D, Prv.D, W, Q, M, & Y + SD" indicator lies in the integration of the sophisticated 'Auto Boxed Range Detector.' This feature serves as the cornerstone of the tool's enhanced functionality, shedding light on critical price ranges to give traders a distinct advantage when identifying potential breakouts or breakdowns.
Meticulously designed with the needs of traders in mind, the Auto Boxed Range Detector automates the process of pinpointing trading ranges, resulting in increased precision and swiftness in your decision-making. By automating this crucial aspect of technical analysis, traders can now focus on other essential factors, ultimately maximizing their trading efficiency.
Furthermore, the Auto Boxed Range Detector helps traders avoid falling prey to false breakouts. By identifying the top of the boxed range in relation to resistance levels, users can more accurately predict the likelihood of a breakout. For instance, if the top of the boxed range is situated near a resistance line, the chances of a breakout are diminished unless the market is experiencing a trend day.
In essence, the Auto Boxed Range Detector not only streamlines the identification of trading ranges but also provides invaluable insights into the validity of potential breakouts or breakdowns. This innovative feature makes the "VWAP Xing D, Prv.D, W, Q, M, & Y + SD" indicator an indispensable tool for traders seeking to capitalize on opportunities while minimizing risk in today's fast-paced financial markets.
Once you get used to this tool it will be an integral part of your trading.

SuperBollingerTrend (Expo)█ Overview
The SuperBollingerTrend indicator is a combination of two popular technical analysis tools, Bollinger Bands, and SuperTrend. By fusing these two indicators, SuperBollingerTrend aims to provide traders with a more comprehensive view of the market, accounting for both volatility and trend direction. By combining trend identification with volatility analysis, the SuperBollingerTrend indicator provides traders with valuable insights into potential trend changes. It recognizes that high volatility levels often accompany stronger price momentum, which can result in the formation of new trends or the continuation of existing ones.
█ How Volatility Impacts Trends
Volatility can impact trends by expanding or contracting them, triggering trend reversals, leading to breakouts, and influencing risk management decisions. Traders need to analyze and monitor volatility levels in conjunction with trend analysis to gain a comprehensive understanding of market dynamics.
█ How to use
Trend Reversals: High volatility can result in more dramatic price fluctuations, which may lead to sharp trend reversals. For example, a sudden increase in volatility can cause a bullish trend to transition into a bearish one, or vice versa, as traders react to significant price swings.
Volatility Breakouts: Volatility can trigger breakouts in trends. Breakouts occur when the price breaks through a significant support or resistance level, indicating a potential shift in the trend. Higher volatility levels can increase the likelihood of breakouts, as they indicate stronger market momentum and increased buying or selling pressure. This indicator triggers when the volatility increases, and if the price is near a key level when the indicator alerts, it might trigger a great trend.
█ Features
Peak Signal Move
The indicator calculates the peak price move for each ZigZag and displays it under each signal. This highlights how much the market moved between the signals.
Average ZigZag Move
All price moves between two signals are stored, and the average or the median is calculated and displayed in a table. This gives traders a great idea of how much the market moves on average between two signals.
Take Profit
The Take Profit line is placed at the average or the median price move and gives traders a great idea of what they can expect in average profit from the latest signals.
-----------------
Disclaimer
The information contained in my Scripts/Indicators/Ideas/Algos/Systems does not constitute financial advice or a solicitation to buy or sell any securities of any type. I will not accept liability for any loss or damage, including without limitation any loss of profit, which may arise directly or indirectly from the use of or reliance on such information.
All investments involve risk, and the past performance of a security, industry, sector, market, financial product, trading strategy, backtest, or individual's trading does not guarantee future results or returns. Investors are fully responsible for any investment decisions they make. Such decisions should be based solely on an evaluation of their financial circumstances, investment objectives, risk tolerance, and liquidity needs.
My Scripts/Indicators/Ideas/Algos/Systems are only for educational purposes!

FibonRSI / ErkOziHello,
This software is a technical analysis script written in the TradingView Pine language. The script creates a trading indicator based on Fibonacci retracement levels and the RSI indicator, providing information about price movements and asset volatility by using Bollinger Bands.
There are many different scripts in the market that draw RSI and Fibonacci retracement levels. However, this script was originally designed by me and shared publicly on TradingView.
***The indicator uses RSI (Relative Strength Index) and Bollinger Bands (BB) as the basis for the FibonRSI strategy. RSI measures the strength of a price movement, and BB measures the volatility of an asset. The FibonRSI strategy is based on the idea that the Fibonacci ratios and RSI can be used to predict a asset's price retracement levels.
***The script allows for various parameters to be adjusted. Users can specify the price source type and adjust the periods for RSI and Bollinger Bands. The standard deviation number for Bollinger Bands can also be customized.
***The script calculates the current RSI indicator position and the basic, upper, and lower levels of Bollinger Bands. It then calculates and draws the Fibonacci retracement levels. The color of the RSI line is determined by the upper and lower distribution levels of Bollinger Bands. Additionally, the color of the Fibonacci retracement levels can also be customized by the user.
***This script can be used to determine potential buy and sell signals using Fibonacci retracement levels and RSI. For example, when the RSI is oversold and the price is close to a Fibonacci retracement level, it can be interpreted as a buying opportunity. Similarly, when the RSI is overbought and the price is close to a Fibonacci retracement level, it can be interpreted as a selling opportunity.
***The script takes input parameters such as the price source used for calculation, the period for the RSI indicator, the period for the Moving Average in Bollinger Bands, and the number of standard deviations used in Bollinger Bands.
***The script's conditions include elements such as calculating the current position of the RSI indicator, calculating the upper and lower Bollinger Bands, calculating the dispersion factor, and calculating Fibonacci levels.
***The parameters in the code can be adjusted for calculation, including the price type used, the RSI period, the Moving Average period for BB, and the standard deviation count for BB. After this, the current position of the RSI, Moving Average, and standard deviation for BB are calculated. After calculating the upper and lower BB, the levels above and below the average are calculated using a specific dispersion constant.
CONDITIONS FOR THE SCRIPT
current_rsi = ta.rsi(src, for_rsi) // Current position of the RSI indicator
basis = ta.ema(current_rsi, for_ma)
dev = for_mult * ta.stdev(current_rsi, for_ma)
upper = basis + dev
lower = basis - dev
dispersion = 1
disp_up = basis + (upper - lower) * dispersion
disp_down = basis - (upper - lower) * dispersion
// Fibonacci Levels
f100 = basis + (upper - lower) * 1.0
f78 = basis + (upper - lower) * 0.78
f65 = basis + (upper - lower) * 0.65
f50 = basis
f35 = basis - (upper - lower) * 0.65
f23 = basis - (upper - lower) * 0.78
f0 = basis - (upper - lower) * 1.0
***When calculating Fibonacci levels, the distance between the average of BB and the upper and lower BB is used. These levels are 0%, 23.6%, 35%, 50%, 65%, 78.6%, and 100%. Finally, the RSI line that changes color according to a specific RSI position, Fibonacci levels, and BB are visualized. Additionally, the levels of 70, 30, and 50 are also shown.
The script then sets the color of the RSI position according to the EMA and draws Bollinger Bands, RSI, Fibonacci levels, and the 70, 30, and 50 levels.
In conclusion, this script enables traders to analyze market trends and make informed decisions. It can also be customized to suit individual trading strategies.
This script analyzes the RSI indicator using Bollinger Bands and Fibonacci levels. The default settings are 14 periods for RSI, 233 periods and 2 standard deviations for BB. The MA period inside BB is selected as the BB period and is used when calculating Fibonacci levels.
***The reason for selecting these settings is to provide enough time for BB period to confirm a possible trend. Additionally, the MA period inside BB is matched with the BB period and used when calculating Fibonacci levels.
***Fibonacci levels are calculated from the distance between the upper and lower bands of BB and show how RSI movement is related to these levels. Better results can be achieved when RSI periods are set to Fibonacci numbers such as 21, 55, and 89. Therefore, the use of Fibonacci numbers is recommended when adjusting RSI periods. Fibonacci numbers are among the technical analysis tools that can capture the reflection of naturally occurring movements in the market. Therefore, the use of Fibonacci numbers often helps to better track fluctuations in the market.
Finally, the indicator also displays the 70 and 30 levels and the middle level (50) with Fibonacci levels drawn in circles. Changing these settings can help optimize the Fibonacci levels and further improve the indicator.
Thank you in advance for your suggestions and opinions......

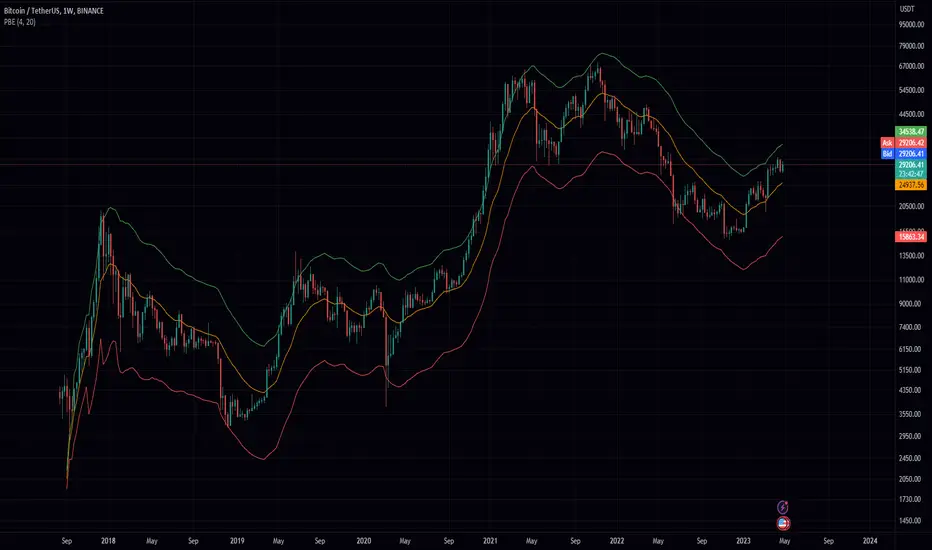
Probability Envelopes (PBE)Introduction
In the world of trading, technical analysis is vital for making informed decisions about the future direction of an asset's price. One such tool is the use of indicators, mathematical calculations that can help traders predict market trends. This article delves into an innovative indicator called the Probability Envelopes Indicator, which offers valuable insights into the potential price levels an asset may reach based on historical data. This in-depth look explores the statistical foundations of the indicator, highlighting its key components and benefits.
Section 1: Calculating Price Movements with Log Returns and Percentages
The Probability Envelopes Indicator provides the option to use either log returns or percentage changes when calculating price movements. Each method has its advantages:
Log Returns: These are calculated as the natural logarithm of the ratio of the current price to the previous price. Log returns are considered more stable and less sensitive to extreme price fluctuations.
Percentage Changes: These are calculated as the percentage difference between the current price and the previous price. They are simpler to interpret and easier to understand for most traders.
Section 2: Understanding Mean, Variance, and Standard Deviation
The Probability Envelopes Indicator utilizes various statistical measures to analyze historical price movements:
Mean: This is the average of a set of numbers. In the context of this indicator, it represents the average price movement for bullish (green) and bearish (red) scenarios.
Variance: This measure represents the dispersion of data points in a dataset. A higher variance indicates a greater spread of data points from the mean. Variance is calculated as the average of the squared differences from the mean.
Standard Deviation: This is the square root of the variance. It is a measure of the amount of variation or dispersion in a dataset. In the context of this indicator, standard deviations are used to calculate the width of the bands around the expected mean.
Section 3: Analyzing Historical Price Movements and Probabilities
The Probability Envelopes Indicator examines historical price movements and calculates probabilities based on their frequency:
The indicator first identifies and categorizes price movements into bullish (green) and bearish (red) scenarios.
It then calculates the probability of each price movement occurring by dividing the frequency of the movement by the total number of occurrences in each category (bullish or bearish).
The expected green and red movements are calculated by multiplying the probabilities by their respective price movements and summing the results.
The total expected movement, or weighted average, is calculated by combining the expected green and red movements and dividing by the total number of occurrences.
Section 4: Constructing the Probability Envelopes
The Probability Envelopes Indicator utilizes the calculated statistics to construct its bands:
The expected mean is calculated using the total expected movement and applied to the current open price.
An exponential moving average (EMA) is used to smooth the expected mean, with the smoothing length determining the degree of responsiveness.
The upper and lower bands are calculated by adding and subtracting the mean green and red movements, respectively, along with their standard deviations multiplied by a user-defined multiplier.
Section 5: Benefits of the Probability Envelopes Indicator
The Probability Envelopes Indicator offers numerous advantages to traders:
Enhanced Decision-Making: By providing probability-based estimations of future price levels, the indicator can help traders make more informed decisions and potentially improve their trading strategies.
Versatility: The indicator is applicable to various financial instruments, such as stocks, forex, commodities, and cryptocurrencies, making it a valuable tool for traders in different markets.
Customization: The indicator's parameters, including the use of log returns, multiplier values, and smoothing length, can be adjusted according to the user's preferences and trading style. This flexibility allows traders to fine-tune the Probability Envelopes Indicator to better suit their needs and goals.
Risk Management: The Probability Envelopes Indicator can be used as a component of a risk management strategy by providing insight into potential price movements. By identifying potential areas of support and resistance, traders can set stop-loss and take-profit levels more effectively.
Visualization: The graphical representation of the indicator, with its clear upper and lower bands, makes it easy for traders to quickly assess the market and potential price levels.
Section 6: Integrating the Probability Envelopes Indicator into Your Trading Strategy
When incorporating the Probability Envelopes Indicator into your trading strategy, consider the following tips:
Confirmation Signals: Use the indicator in conjunction with other technical analysis tools, such as trend lines, moving averages, or oscillators, to confirm the strength and direction of the market trend.
Timeframes: Experiment with different timeframes to find the optimal settings for your trading strategy. Keep in mind that shorter timeframes may generate more frequent signals but may also increase the likelihood of false signals.
Risk Management: Always establish a proper risk management strategy that includes setting stop-loss and take-profit levels, as well as managing your position sizes.
Backtesting: Test the Probability Envelopes Indicator on historical data to evaluate its effectiveness and fine-tune its parameters to optimize your trading strategy.
Section 7: Cons and Limitations of the Probability Envelopes Indicator
While the Probability Envelopes Indicator offers several advantages to traders, it is essential to be aware of its potential cons and limitations. Understanding these can help you make better-informed decisions when incorporating the indicator into your trading strategy.
Lagging Nature: The Probability Envelopes Indicator is primarily based on historical data and price movements. As a result, it may be less responsive to real-time changes in market conditions, and the predicted price levels may not always accurately reflect the market's current state. This lagging nature can lead to late entry and exit signals.
False Signals: As with any technical analysis tool, the Probability Envelopes Indicator can generate false signals. These occur when the indicator suggests a potential price movement, but the market does not follow through. It is crucial to use other technical analysis tools to confirm the signals and minimize the impact of false signals on your trading decisions.
Complex Statistical Concepts: The Probability Envelopes Indicator relies on complex statistical concepts and calculations, which may be challenging to grasp for some traders, particularly beginners. This complexity can lead to misunderstandings and misuse of the indicator if not adequately understood.
Overemphasis on Past Data: While historical data can be informative, relying too heavily on past performance to predict future movements can be limiting. Market conditions can change rapidly, and relying solely on past data may not provide an accurate representation of the current market environment.
No Guarantees: The Probability Envelopes Indicator, like all technical analysis tools, cannot guarantee success. It is essential to approach trading with realistic expectations and understand that no indicator or strategy can provide foolproof results.
To overcome these limitations, it is crucial to combine the Probability Envelopes Indicator with other technical analysis tools and utilize a comprehensive risk management strategy. By doing so, you can better understand the market and increase your chances of success in the ever-changing financial markets.
Section 8: Probability Envelopes Indicator vs. Bollinger Bands
Bollinger Bands and the Probability Envelopes Indicator are both technical analysis tools designed to identify potential support and resistance levels, as well as potential trend reversals. However, they differ in their underlying concepts, calculations, and applications. This section will provide a deep dive into the differences between these two indicators and how they can complement each other in a trading strategy.
Underlying Concepts and Calculations:
Bollinger Bands:
Bollinger Bands are based on a simple moving average (SMA) of the price data, with upper and lower bands plotted at a specified number of standard deviations away from the SMA.
The distance between the bands widens during periods of increased price volatility and narrows during periods of low volatility, indicating potential trend reversals or breakouts.
The standard settings for Bollinger Bands typically involve a 20-period SMA and a 2 standard deviation distance for the upper and lower bands.
Probability Envelopes Indicator:
The Probability Envelopes Indicator calculates the expected price movements based on historical data and probabilities, utilizing mean and standard deviation calculations for both upward and downward price movements.
It generates upper and lower bands based on the calculated expected mean movement and the standard deviation of historical price changes, multiplied by a user-defined multiplier.
The Probability Envelopes Indicator also allows users to choose between using log returns or percentage changes for the calculations, adding flexibility to the indicator.
Key Differences:
Calculation Method: Bollinger Bands are based on a simple moving average and standard deviations, while the Probability Envelopes Indicator uses statistical probability calculations derived from historical price changes.
Flexibility: The Probability Envelopes Indicator allows users to choose between log returns or percentage changes and adjust the multiplier, offering more customization options compared to Bollinger Bands.
Risk Management: Bollinger Bands primarily focus on volatility, while the Probability Envelopes Indicator incorporates probability calculations to provide additional insights into potential price movements, which can be helpful for risk management purposes.
Complementary Use:
Using both Bollinger Bands and the Probability Envelopes Indicator in your trading strategy can offer valuable insights into market conditions and potential price levels.
Bollinger Bands can provide insights into market volatility and potential breakouts or trend reversals based on the widening or narrowing of the bands.
The Probability Envelopes Indicator can offer additional information on the expected price movements based on historical data and probabilities, which can be helpful in anticipating potential support and resistance levels.
Combining these two indicators can help traders to better understand market dynamics and increase their chances of identifying profitable trading opportunities.
In conclusion, while both Bollinger Bands and the Probability Envelopes Indicator aim to identify potential support and resistance levels, they differ significantly in their underlying concepts, calculations, and applications. By understanding these differences and incorporating both tools into your trading strategy, you can gain a more comprehensive understanding of the market and make more informed trading decisions.
In conclusion, the Probability Envelopes Indicator is a powerful and versatile technical analysis tool that offers unique insights into expected price movements based on historical data and probability calculations. It provides traders with the ability to identify potential support and resistance levels, as well as potential trend reversals. When compared to Bollinger Bands, the Probability Envelopes Indicator offers more customization options and incorporates probability-based calculations for a different perspective on market dynamics.
Although the Probability Envelopes Indicator has its limitations and potential cons, such as the reliance on historical data and the assumption that past performance is indicative of future results, it remains a valuable addition to any trader's toolkit. By using the Probability Envelopes Indicator in conjunction with other technical analysis tools, such as Bollinger Bands, traders can gain a more comprehensive understanding of the market and make more informed trading decisions.
Ultimately, the success of any trading strategy relies on the ability to interpret and apply multiple indicators effectively. The Probability Envelopes Indicator serves as a unique and valuable tool in this regard, providing traders with a deeper understanding of the market and its potential price movements. By utilizing this indicator in combination with other tools and techniques, traders can increase their chances of success and optimize their trading strategies.
Bollinger Bands %B (ValueRay)One of the key features of this BB%B is its ability to highlight overbought and oversold conditions. This allows you to make informed decisions on when to enter and exit a trade, helping you maximize your profits and minimize your losses.
- Bollinger Bands %B with the ability to change to a different Time Frame.(Defaults to current Chart Time Frame).
- Ability To Turn On/Off Background Highlighting if BB %B is Above/Below 0 / 1 thresholds.
- Ability To Turn On/Off Background Highlighting when BB %B Crosses back above/unser 0/1 thresholds.
---
My personal recommandation use: combine with CM_Ultimate RSI Multi Time Frame (ChrisMoody) and have solid oversold/overbought levels, when hes RSI and my BB %B are bot red/green

Bollinger Band ribbonThis indicator plots 9 upper and lower lines with increasing length. Lines are 0.618 upper and lower level of Bollinger band.
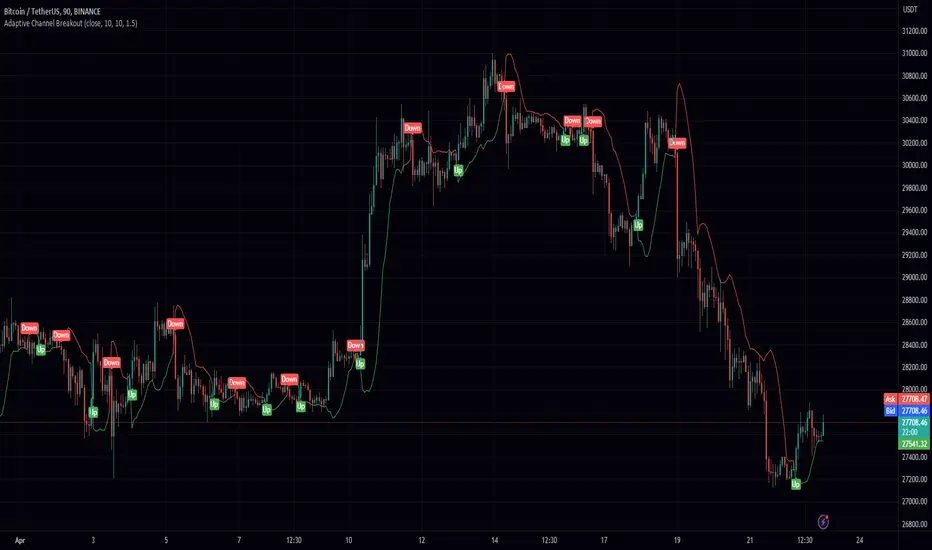
Adaptive Channel BreakoutIntroducing the "Adaptive Channel Breakout" indicator, an advanced charting tool that employs the acb function from the PeacefulIndicators library. This powerful indicator helps traders detect potential breakouts and trends by displaying an adaptive channel on the chart.
Key features of the Adaptive Channel Breakout indicator include:
Customizable input parameters: Adjust the moving average length, volatility length, and multiplier to suit your trading preferences and strategy.
Utilizes the acb function from the PeacefulIndicators library, which calculates the adaptive channel using a simple moving average (SMA) and standard deviation to measure volatility. The function also tracks the trend direction based on price crossovers and crossunders.
Clear visual representation: The adaptive channel is displayed as a linebr plot, with the color indicating the current trend direction (green for uptrends and red for downtrends).
Trend signals: The indicator includes up and down arrow labels that signify potential trend reversals, providing traders with valuable entry and exit points.
Overlay functionality: Designed to be displayed directly on the price chart for easy analysis and correlation with price action.
To use the Adaptive Channel Breakout indicator, simply add the script to your chart and customize the input parameters as needed.
BB_MDL_V1Simple indicator that is based on the average line of the bollinger bands and the exponential average of 200 periods.
The customizable variable is bollinger bands length, currently the default is 35, you can tweak it to your liking and see how trend identification changes.
My recommendation is to work in 5-minute time frames in values such as SOL, FTM or MASK (cryptos)
This simple strategy can be combined with many others to gain more insight and get better market entries and exits.

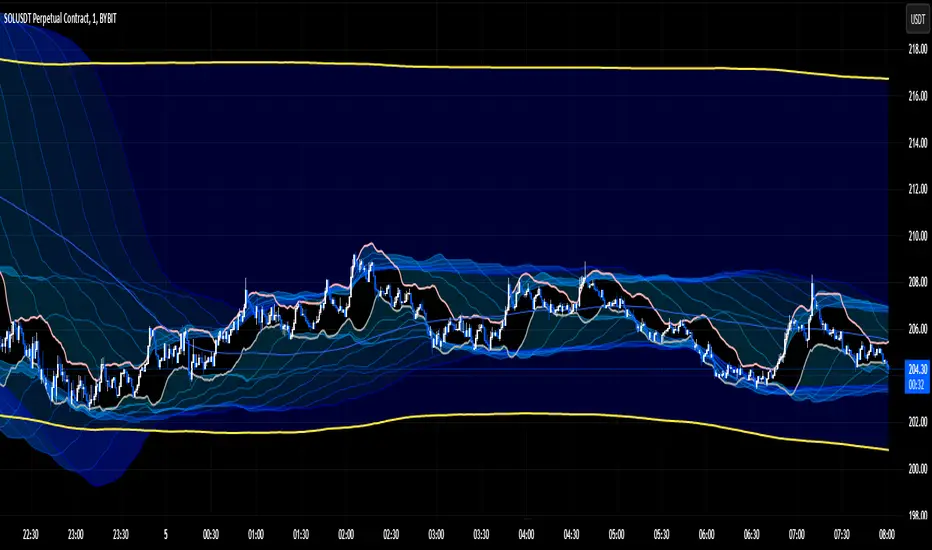
Galactic Bollinger Bands Envelope (GBBE)The Galactic Bollinger Bands Envelope (GBBE) is a technical indicator that is used to identify potential areas of support and resistance in a trading instrument's price. The GBBE indicator is similar to the traditional Bollinger Bands (BB) indicator but offers certain advantages and improvements over the standard BB indicator.
The GBBE indicator is based on a similar concept to the BB indicator, where the bands are plotted around a moving average of the price. However, the GBBE indicator uses a more sophisticated calculation that accounts for the volatility of the instrument being analyzed. The GBBE indicator is designed to adjust to changing market conditions and provide more accurate signals.
One of the key strengths of the GBBE indicator is that it offers a clearer signal for traders to identify potential buy and sell opportunities. This is because the GBBE indicator has a tighter range compared to the standard BB indicator, which can sometimes generate false signals due to the wider range.
The GBBE indicator also has the advantage of being more responsive to sudden price movements, which makes it particularly useful for short-term traders who need to make quick decisions. The GBBE indicator is able to adjust to sudden market changes, which means that traders are less likely to miss out on trading opportunities.
Another advantage of the GBBE indicator is that it can be customized to suit individual trading styles and preferences. Traders can adjust the input parameters of the GBBE indicator, such as the length of the moving average and the multiplier, to optimize the indicator for different market conditions.
In conclusion, the Galactic Bollinger Bands Envelope (GBBE) is a powerful technical indicator that offers several advantages over the standard Bollinger Bands (BB) indicator. The GBBE indicator is designed to be more responsive and accurate, which makes it particularly useful for short-term traders. The GBBE indicator also offers traders more flexibility to customize the indicator to suit individual trading styles and preferences. Overall, the GBBE indicator is a valuable tool for traders looking to identify potential buy and sell opportunities in the markets.

Trend IndicatorThis indicator has different features:
1. Ichimoku = this indicator can plot Ichimoku calculated both in the common formula and with the volume average, you can choose the calculator method for each line.
2. Channel and Bands = this mode allows the user to choose from channel and band, "channel" shows the Keltner channel, and "band" shows the Bollinger bands. Both the indicators are calculated including the volume in the formula of the average midpoint.
3. Color candle = this function allows the user to see two different colors of candles on the chart, the positive color occurs when both the long-term average and the short team average of price calculated using the volume is above the two averages calculated without the volume. This function is great to analyze the volume pressure, useful to identify trend continuation and exhaustion.
4. Extreme reversal zones = this is a version of the Keltner channels calculated over a high number of candles and with high deviation, to identify the potential zones of reversal.
Note that in the "Ichimoku" indicator, the backline is the T.R.A.M.A. indicator, created and published open source by Lux Algo, which I thank for the script.

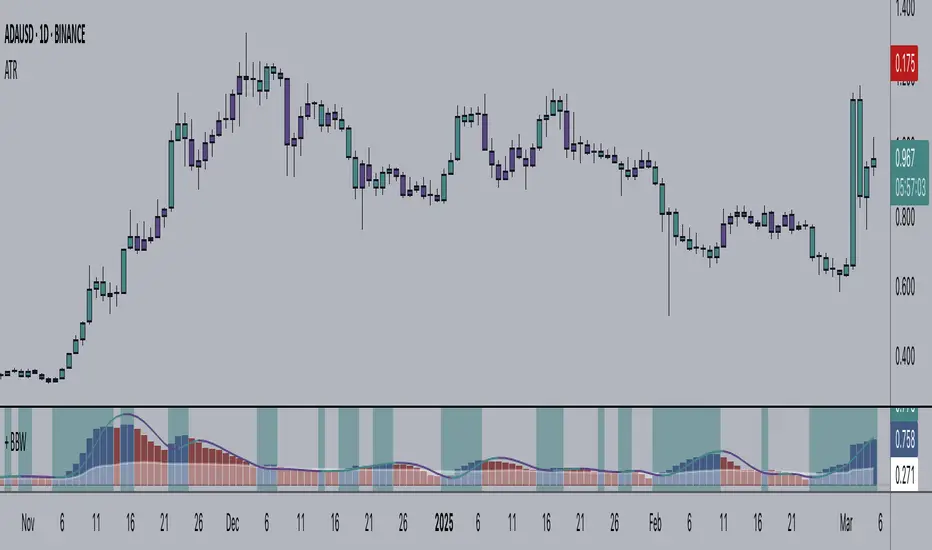
+ Bollinger Bands WidthHere is my rendition of Bollinger Bands Width. If you are unfamiliar, Bollinger Bands Width is a measure of the distance between the top and bottom bands of Bollinger Bands. Bollinger Bands themselves being a measure of market volatility, BB Width is a simpler, cleaner way of determining the amount of volatility in the market. Myself, I found the original, basic version of BB Width a bit too basic, and I thought that by adding to it it might make for an improvement for traders over the original.
Simple things that I've done are adding a signal line; adding a 'baseline' using Donchian Channels (such as that which is in my Average Candle Bodies Range indicator); adding bar and background coloring; and adding alerts for increasing volatility, and baseline and signal line crosses. It really ends up making for a much improved version of the basic indicator.
A note on how I created the baseline:
First, what do I mean by 'baseline?' I think of it as an area of the indicator where if the BB Width is below you will not want to enter into any trades, and if the BB Width is above then you are free to enter trades based on your system. It's basically a volatility measure of the volatility indicator. Waddah Attar Explosion is a popular indicator that implements something similar. The baseline is calculated thus: make a Donchian Channel of the BB Width, and then use the basis as the baseline while not plotting the actual highs and lows of the Donchian Channel. Now, the basis of a Donchian Channel is the average of the highs and the lows. If we did that here we would have a baseline much too high, however, by making the basis adjustable with a divisor input it no longer must be plotted in the center of the channel, but may be moved much lower (unless you set the divisor to 2, but you wouldn't do that). This divisor is essentially a sensitivity adjustment for the indicator. Of course you don't have to use the baseline. You could ignore it and only use the signal line, or just use the rising and falling of the BB Width by itself as your volatility measure.
I should make note: the main image above at default settings is an 8 period lookback (so, yes, that is quite fast), and the signal line is a Hull MA set to 13. The background and bar coloring are simply set to the rising and falling of the BB Width. Images below will show some different settings, but definitely play with it yourself to determine if it might be a good fit for your system.
Above, settings are background and bar coloring tuned to BB Width being above the baseline, and also requiring that the BB Width be rising. Background coloring only highlights increasing volatility or volatility above a certain threshold. Grey candles are because the BB Width is above the baseline but falling. We'll see an example without the requirement of BB Width rising, below.
Here, we see that background highlights and aqua candles are more prevalent because I've checked off the requirement that BB Width be rising. The idea is that BB Width is above the baseline therefor there is sufficient volatility to enter trades if our indicators give us the go-ahead.
This here is set to BB Width being above the signal line and also requiring a rising BB Width. Keep in mind the signal line is a Hull MA.
And this fourth and final image uses a volume-weighted MA as the signal line. Bar coloring is turned off, and instead the checkboxes for volatility advancing and declining are turned on under the signal line options. BB Width crosses up the signal line is advancing volatility, while falling below it is declining volatility. Background highlights are set to baseline and not requiring a rising BB Width. This way, with a quick glance you can see if the rising volatility is legitimate, i.e., is the cross up of the signal line coupled with it being above the baseline.
Please enjoy.
Ignition Band Angles are Bollinger Bands with numeric angleI developed Bollinger Bands that provide a numeric value indicating their strength. To achieve this, I used the degree of the angle of attack and color-coded the numbers. The top band displays the number in the upper corner of the chart, the bottom band in the bottom corner, and the Basis is in the left middle. These numbers quantify the slope of the bands, which can be difficult to discern on a chart because stretching out the x and y axis can flatten or exaggerate a slope. With my Bollinger Bands, you get a constant reading that provides an accurate measurement of the angle and strength of a trend. I hope this helps.

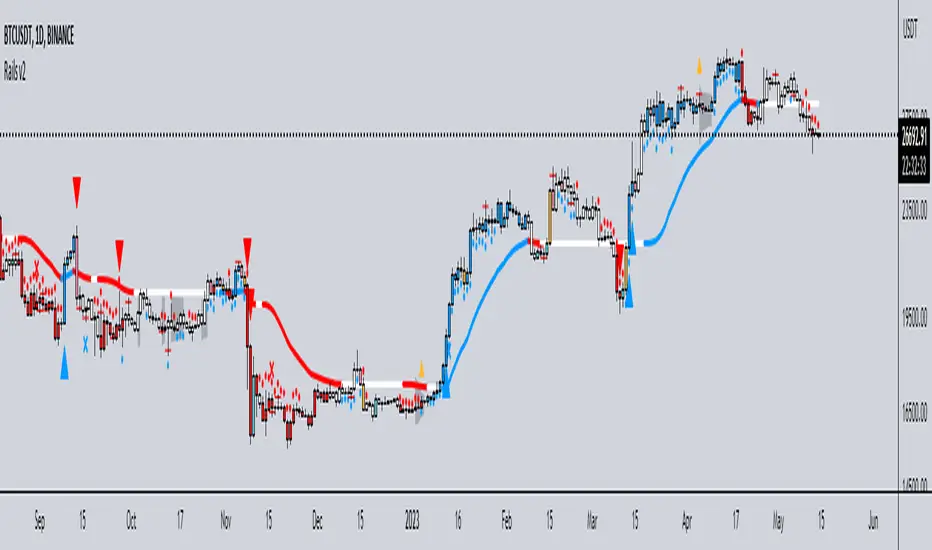
Rails v2Centered around a Variable Moving Average (Rail Line). The Variable Moving Average (VMA) is a study that uses an Exponential Moving Average being able to automatically adjust its smoothing factor according to the market volatility.
In addition to the Rail Line or VMA, the indicator makes use of Bollinger Bands in two ways. First, it displays when the Bollinger Bands are in a squeeze and the potential direction of the breakout. The "squeeze" is the central concept of Bollinger Bands. When the bands come close together, constricting the moving average, it is called a squeeze. A squeeze signals a period of low volatility and is considered by traders to be a potential sign of future increased volatility and possible trading opportunities. The Bollinger Bands are also utilized to highlight when price action might reverse. This signals when price closes outside of the bands, quickly reverts and closes within the bands
The indicator makes use of the Hull Moving Average as a method to quickly capture price action moves thanks to its ability to eliminate lag while managing to improve smoothing at the same time.
Finally, the indicator utilizes Volume Point of Control (VPOC) to determine points in price where the highest amount of volume was traded. Unlike the market profile, the indicator will plot the Volume POC per candle. The script will also plot Trapped Volume. This is important as it tends to serve a signal for reversal. The more price moves away from the trapped volume, Long/Short traders might be forced to cover and price could quickly move away from the area.
DEFAULT SIGNALS: All signals can be turned Off/On by user
Dots = Short Term Trend
Rails Bar Color = Medium Term Trend
Rail Line (VMA) = Long Term Trend
Crossover of Moving Averages = X
Volume Pulse = Large Up/Down Triangle
Potential Bullish Reversal = Light Blue Candle
Potential Bearish Reversal = Pink Candle
Potential Reversal Confirmation = Orange Candle
Squeeze = Shaded White Cloud
Potential Breakout Direction = Small Golden Triangle
Hull Moving Average = Thin Golden Line
Volume POC = Thin Horizontal White Line on Candle
Volume Threshold POC = Thin Horizontal Yellow Line on Candle
Trapped Volume POC = Thin Horizontal Red Line on Candle
Weighted Deviation Bands [Loxx]What are Weighted Deviation Bands?
Variation of the Bollinger bands but it uses linear weighted average and weighted deviation via Mladen Rakic.
What is Weighted Deviation?
This weighted deviation is a sort of all linear weighted deviation. It uses linear weighting in all the steps calculated (which makes it different from the built in deviation in a case when linear weighted ma is used in the ma method). It is more responsive than the standard deviation
Included
Bar coloring

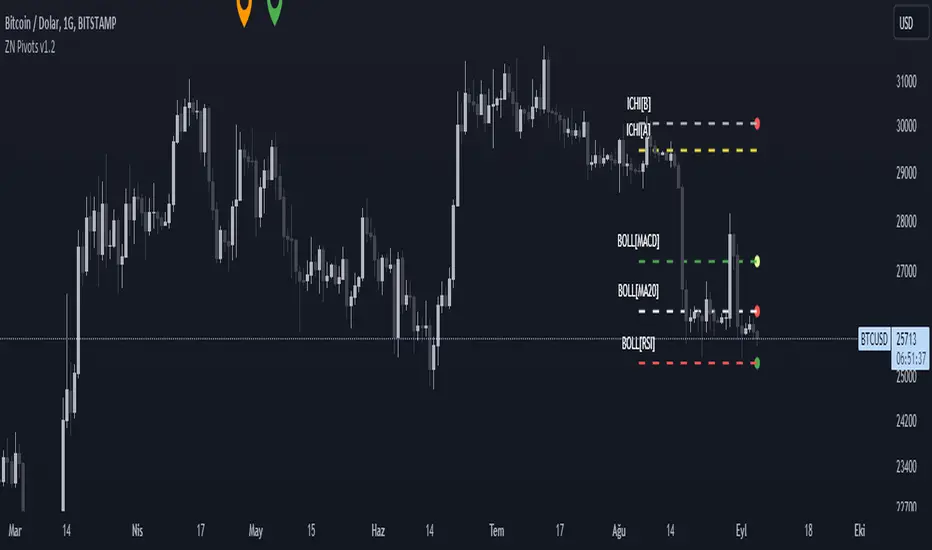
ZN PivotsDescription
This indicator is aimed at showing the pivot points of the trend by using Ichimoku cloud and Bollinger bands.
BOLL : Upper Bollinger Band. The red circle formed on it refers to the downward intersection of the MACD indicator. In the downward intersection, a red circle appears.
BOLL : Middle Bollinger Band.
BOLL : Lower Bollinger Band. The red circle formed on it refers to the downward intersection of the RSI indicator. In the downward intersection, a red circle appears.
ICHI : Ichimoku Leading A Line. The green circle formed on it refers to the upward intersection of the ICHIMOKU indicator.
ICHI : Ichimoku Leading B Line. The red circle formed on it refers to the downward intersection of the ICHIMOKU indicator.
Warning
As a result, this indicator should be expected to give an idea of the trend direction, not a trading signal.
Version
v1.0
Fibonacci Volatility BandsFibonacci Volatility Bands are just an alternative that allows for more margin than regular Bollinger Bands. They are created based on an average of moving averages that use the Fibonacci sequence as lookback periods.
The use of the Fibonacci Volatility Bands is exactly the same as the Bollinger Bands.

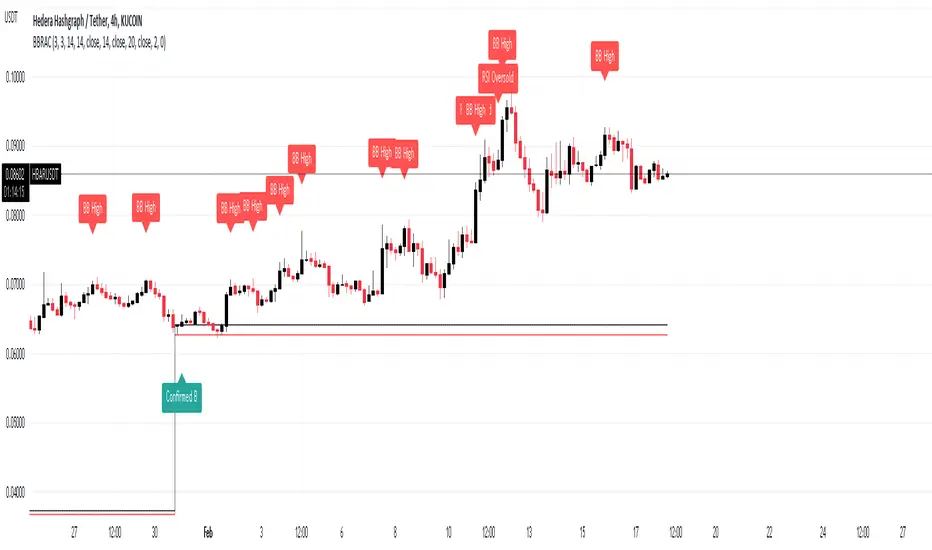
BB Running Away CandleHello,
here is an indicator that can be helpful for your trading that is simple and easy to use.
Our culprit here is a candle that opens and closes below the lower band of Bollinger Band, Black and red lines are put on the high and low of that candle.
Green Arrows are happening when:
1- When candle closes above the black line and Stochastic RSI is in the oversold area >> "Confirmed B"
2- When candle closes above the black line >> "B"
Note that you can choose from the settings whether you want it confirmed or not.
Red Arrows are happening when:
1- Price reached the higher band of Bollinger Bands >> "BB High"
2- Stochastic crosses down from above 80 level >> "Stoch Crossdown"
3- RSI reached above 70 levle >> "RSI Oversold"
Note that you can choose to turn these on or off from the settings.
Settings of indicators are set to default.
NOTE: Alerts are put there however i didn't get the chance to test them, so would like to hear your feedback about them.
THE USE OF THIS INDICATOR IS YOUR OWN RESPONSIBILITY.
wishing you the best.
GKD-V Waddah Attar Explosion (WAE) [Loxx]Giga Kaleidoscope Waddah Attar Explosion (WAE) is a Volatility / Volume module included in Loxx's "Giga Kaleidoscope Modularized Trading System".
█ Giga Kaleidoscope Modularized Trading System
What is Loxx's "Giga Kaleidoscope Modularized Trading System"?
The Giga Kaleidoscope Modularized Trading System is a trading system built on the philosophy of the NNFX (No Nonsense Forex) algorithmic trading.
What is an NNFX algorithmic trading strategy?
The NNFX algorithm is built on the principles of trend, momentum, and volatility . There are six core components in the NNFX trading algorithm:
1. Volatility - price volatility ; e.g., Average True Range , True Range Double, Close-to-Close, etc.
2. Baseline - a moving average to identify price trend
3. Confirmation 1 - a technical indicator used to identify trends.
4. Confirmation 2 - a technical indicator used to identify trends.
5. Continuation - a technical indicator used to identify trends.
6. Volatility / Volume - a technical indicator used to identify volatility / volume breakouts/breakdown.
7. Exit - a technical indicator used to determine when a trend is exhausted.
How does Loxx's GKD (Giga Kaleidoscope Modularized Trading System) implement the NNFX algorithm outlined above?
Loxx's GKD v1.0 system has five types of modules (indicators/strategies). These modules are:
1. GKD-BT - Backtesting module (Volatility , Number 1 in the NNFX algorithm)
2. GKD-B - Baseline module (Baseline and Volatility / Volume , Numbers 1 and 2 in the NNFX algorithm)
3. GKD-C - Confirmation 1/2 and Continuation module (Confirmation 1/2 and Continuation, Numbers 3, 4, and 5 in the NNFX algorithm)
4. GKD-V - Volatility / Volume module (Confirmation 1/2, Number 6 in the NNFX algorithm)
5. GKD-E - Exit module (Exit, Number 7 in the NNFX algorithm)
(additional module types will added in future releases)
Each module interacts with every module by passing data between modules. Data is passed between each module as described below:
GKD-B => GKD-V => GKD-C(1) => GKD-C(2) => GKD-C(Continuation) => GKD-E => GKD-BT
That is, the Baseline indicator passes its data to Volatility / Volume . The Volatility / Volume indicator passes its values to the Confirmation 1 indicator. The Confirmation 1 indicator passes its values to the Confirmation 2 indicator. The Confirmation 2 indicator passes its values to the Continuation indicator. The Continuation indicator passes its values to the Exit indicator, and finally, the Exit indicator passes its values to the Backtest strategy.
This chaining of indicators requires that each module conform to Loxx's GKD protocol, therefore allowing for the testing of every possible combination of technical indicators that make up the six components of the NNFX algorithm.
What does the application of the GKD trading system look like?
Example trading system:
Backtest: Strategy with 1-3 take profits, trailing stop loss, multiple types of PnL volatility, and 2 backtesting styles
Baseline: Hull Moving Average
Volatility/Volume: Waddah Attar Explosion (WAE) as shown on the chart above
Confirmation 1: Halftrend Averages
Confirmation 2: Williams Percent Range
Continuation: Fisher Transform
Exit: Rex Oscillator
Each GKD indicator is denoted with a module identifier of either: GKD-BT, GKD-B, GKD-C, GKD-V, or GKD-E. This allows traders to understand to which module each indicator belongs and where each indicator fits into the GKD protocol chain.
Giga Kaleidoscope Modularized Trading System Signals (based on the NNFX algorithm)
Standard Entry
1. GKD-C Confirmation 1 Signal
2. GKD-B Baseline agrees
3. Price is within a range of 0.2x Volatility and 1.0x Volatility of the Goldie Locks Mean
4. GKD-C Confirmation 2 agrees
5. GKD-V Volatility / Volume agrees
Baseline Entry
1. GKD-B Baseline signal
2. GKD-C Confirmation 1 agrees
3. Price is within a range of 0.2x Volatility and 1.0x Volatility of the Goldie Locks Mean
4. GKD-C Confirmation 2 agrees
5. GKD-V Volatility / Volume agrees
6. GKD-C Confirmation 1 signal was less than 7 candles prior
Continuation Entry
1. Standard Entry, Baseline Entry, or Pullback; entry triggered previously
2. GKD-B Baseline hasn't crossed since entry signal trigger
3. GKD-C Confirmation Continuation Indicator signals
4. GKD-C Confirmation 1 agrees
5. GKD-B Baseline agrees
6. GKD-C Confirmation 2 agrees
1-Candle Rule Standard Entry
1. GKD-C Confirmation 1 signal
2. GKD-B Baseline agrees
3. Price is within a range of 0.2x Volatility and 1.0x Volatility of the Goldie Locks Mean
Next Candle:
1. Price retraced (Long: close < close or Short: close > close)
2. GKD-B Baseline agrees
3. GKD-C Confirmation 1 agrees
4. GKD-C Confirmation 2 agrees
5. GKD-V Volatility / Volume agrees
1-Candle Rule Baseline Entry
1. GKD-B Baseline signal
2. GKD-C Confirmation 1 agrees
3. Price is within a range of 0.2x Volatility and 1.0x Volatility of the Goldie Locks Mean
4. GKD-C Confirmation 1 signal was less than 7 candles prior
Next Candle:
1. Price retraced (Long: close < close or Short: close > close)
2. GKD-B Baseline agrees
3. GKD-C Confirmation 1 agrees
4. GKD-C Confirmation 2 agrees
5. GKD-V Volatility / Volume Agrees
PullBack Entry
1. GKD-B Baseline signal
2. GKD-C Confirmation 1 agrees
3. Price is beyond 1.0x Volatility of Baseline
Next Candle:
1. Price is within a range of 0.2x Volatility and 1.0x Volatility of the Goldie Locks Mean
3. GKD-C Confirmation 1 agrees
4. GKD-C Confirmation 2 agrees
5. GKD-V Volatility / Volume Agrees
█ Waddah Attar Explosion (WAE)
What is Waddah Attar Explosion (WAE)
Waddah Attar Explosion (WAE) Backtest is a momentum strategy that accounts for volatility in the market. It is the combination of MACD and Bollinger Bands with volatility cutoffs to determine entry and exit points. This version of WAE also includes a non-lag MACD option.
Other things to note
The GKD trading system requires that a GKD-V indicator be present in the indicator chain, but the GKD-V indicator doesn't need to be active. You can turn on/off the Volatility Ratio as you wish so you can backtest your trading strategy with the filter on or off.
Additional features will be added in future releases.

Faytterro Bandswhat is Faytterro Bands?
it is a channel indicator like "Bollinger Bands".
what it does?
creates a channel using standard deviations and means. thus giving users an idea about the expensive and cheap zones. It uses a special weighted moving average different from standard bollinger bands, it also averages not only price but also deviations.
how it does it?
it uses this formulas:
how to use it?
its usage is the same as "bollinger band".
length represents the number of candles to be taken into account, source represents the source of those candles and stdev represents the coefficient of the standard deviation.
you can use it with other indicators:
