Stoch X, an Indicator of Indicators by DGTStochastic refers to a randomly determined process and financial markets use stochastic models to represent the seemingly random behaviour of assets and then used by quantitative analysts to value options on asset prices
The stochastic oscillator, developed by George Lane, presents the location of the closing price of a stock in relation to the high and low range of the price of a stock over a period of time. Lane has said that the stochastic oscillator does not follow price or volume or anything similar. He indicates that the oscillator follows the speed or momentum of price.
Traditionally, readings over 80 are considered in the overbought range, and readings under 20 are considered oversold. Please note that, very strong trends can maintain overbought or oversold conditions for an extended period and traders should look to changes in the stochastic oscillator for clues about future trend shifts. It is advised to check the higher timeframe of your trading timeframe and see where you are in the “big picture”
Signal crosses , intersection of stochastic and its signal line is considered to be a signal that a reversal may be in the works
Divergence between the stochastic oscillator and trending price action is also seen as an important reversal signal
Lane also reveals in interviews that, as a rule, the momentum or speed of the price of a stock changes before the price changes itself . In this way, the stochastic oscillator can be used to foreshadow reversals when the indicator reveals bullish or bearish divergences. This signal is the first, and arguably the most important, trading signal Lane identified.
What is Stochastic X ?
Stochastic X , is essentially an indicator of an indicator, providing stochastic calculation to some of well known indicators, such as RSI, MFI, OBV, etc. This means that it is a measure of selected specific indicator relative to its own high/low range over a user defined period of time.
Features of Stoch X
1- Displays Stoch of and indicator plus a companion indicator (companion display can be disabled from user dialog box)
Available options
Stoch Source plus PM A, where Source is close price and PMA refers to Price Distance to its Moving Average (for further details you may check my study of Price Distance to its MA by DGT, and different application of distance concept available with “MACD-X, More Than MACD" And “P-MACD”)
Stoch RSI plus RSI , Stoch RSI, developed by Tushar Chande and Stanley Kroll, is a build-in indicator available on Trading View, where Stoch X adds RSI as a companion indicator to Stoch RSI
Stoch MFI and MFI , where MFI is Money Flow Index, measures buying and selling pressure through analyzing both price and volume
Stoch OBV + VO , Where OBV is On Balance Volume, is a momentum indicator that measures positive and negative volume flow. VO stands for Volume Oscillator which aims to confirm a market turnaround or trend reversal
Stoch EWO + EWO , EWO stands for Elliott Wave Oscillator
By default the threshold levels are indicated and are displayed differently for the regular Stoch or Stoch RSI. Overbought band (70-80), oversold band (20-30) and middle line (0) are emphasized
Warning : Centered Oscillators base line is moved from 0 to 50 to better suit with Stoch X, which is applied to PMA, VO and EWO
2- Can be plotted along with Stoch in the same window using the same scaling
To avoid misinterpreting the area between Stoch X and its Signal Line is highlighted automatically in case Stoch is selected to be plotted
3- Squeeze Indicator added as Add-on in the bottom of the Stoch X
During volatile market conditions the stochastic oscillator has been known to produce false signals. One way to help with this is to take the price trend as a filter, or basic chart pattern analysis can help to identify major, underlying trends and increase the Stoch X's accuracy.
This study implements Squeeze Indicator to help and add additional insight for filtering false signals. Blue diamond shapes indicates the squeeze release, that is volatility increased and according to momentum direction the buy/sell possibility can be considered. Orange ones displays consolidation periods, that is low volatility and the market is assumed to be in squeeze and no trade is recommended. in this phase.
Disclaimer: Trading success is all about following your trading strategy and the indicators should fit within your trading strategy, and not to be traded upon solely
The script is for informational and educational purposes only. Use of the script does not constitutes professional and/or financial advice. You alone the sole responsibility of evaluating the script output and risks associated with the use of the script. In exchange for using the script, you agree not to hold dgtrd TradingView user liable for any possible claim for damages arising from any decision you make based on use of the script
Breadth Indicators

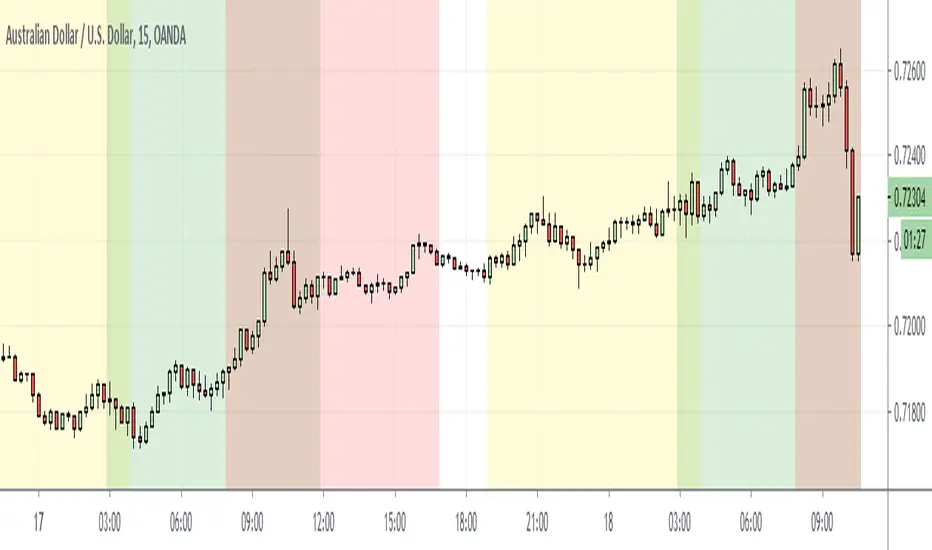
Simple Market Session by GavThis is a simple script to highlight market sessions.
It highlights Sydney, Tokyo, London, and New York sessions with transparent background colors.
You are able to change session times, color, and transparency.
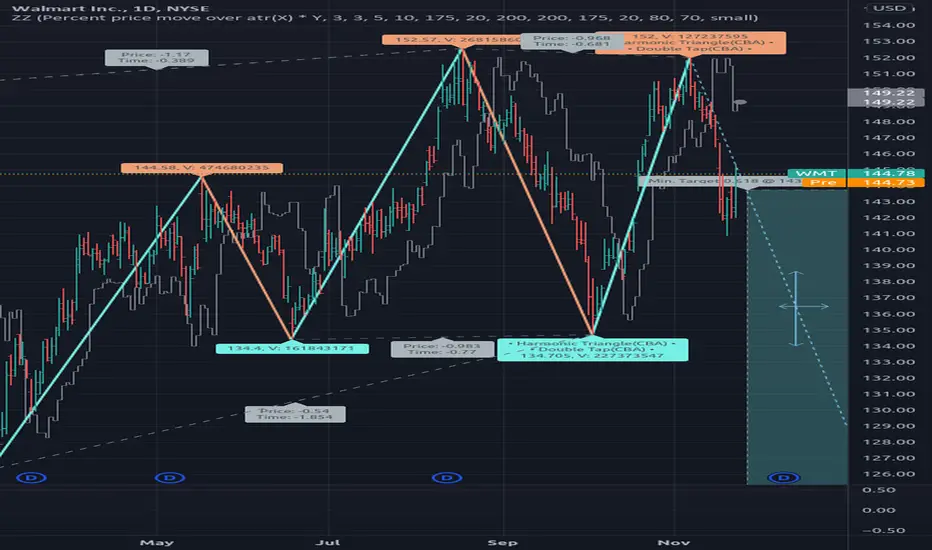
[RS]ZigZag Multiple Methods - Forecast - patterns - labelsexperimental:
zigzag indicator with all the zigzag methods that im aware of(that matter atleast), theres something for all tastes there :P
this will be the basis for zigzag tools i make in the future.
note: some zigzags REPAINT.
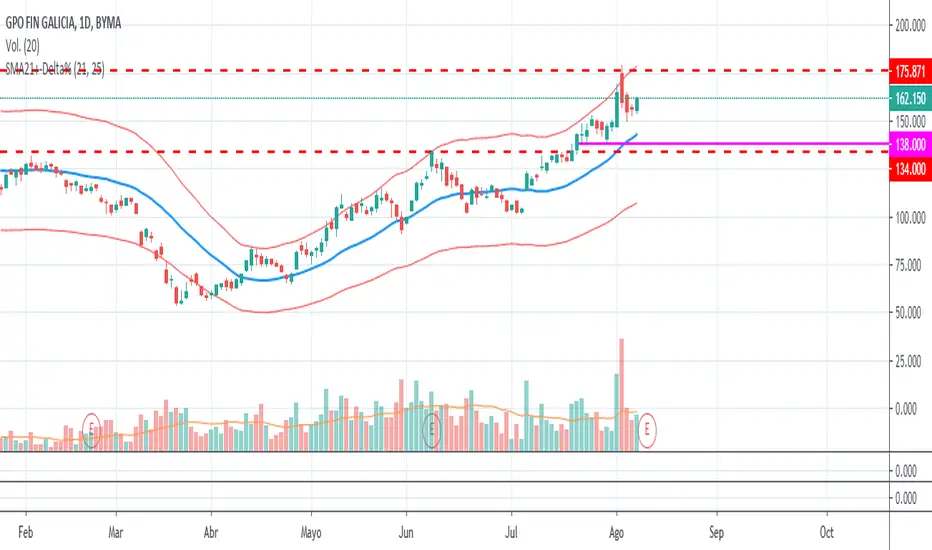
SMA21+-Delta%A simple script that plots a SMA of "length" periods, plus and minus "Delta %" of SMA value. Many Stocks shows a pattern off bulixh/bearish correction based on a % instead of any numbes of Standard Deviations, like Bollinger Bands do.
Default values:
length = 21
Delta% = 25
Un script simple que permite graficar una SMA de "length" períodos, +- "Delta%", un porcentage fijo respecto a la SMA. Muchos papeles muestran payrones de corrección basados en este tipo de límites, en lugar de una cierta cantidad de desvíos estándar, como es el caso de las Bandas de Bollinger.
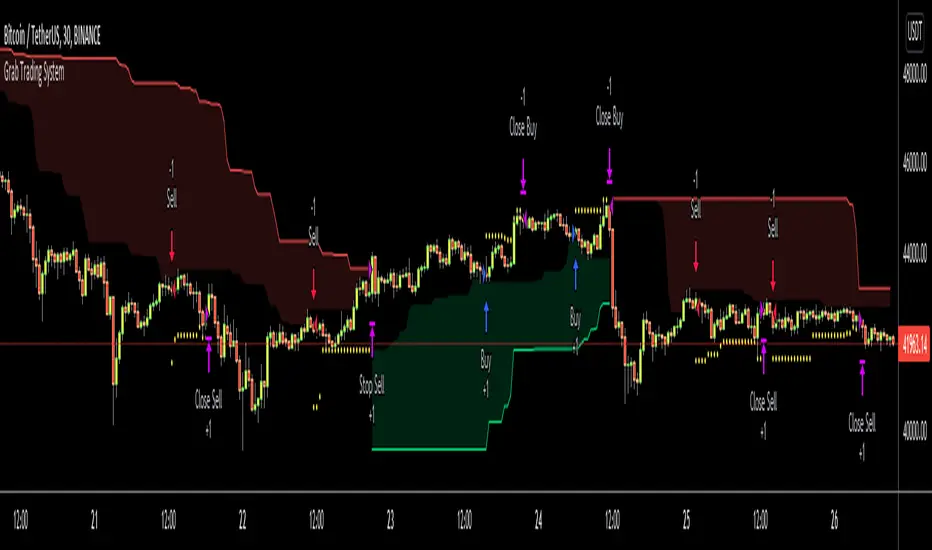
Grab Trading SystemHello All,
This is "Grab Trading System" script defined in the book "Trend Following" by Michael W. Covel. also named as "Two-box system". I made small changes and I guess that it can be improved more.
The definition: Far box defines major trend; system trades only in same direction as major trend, meanwhile fading the signals of near box. Last trade in each trend exits at break of far box - at the same time as the trend reverses. All trades, except the last in the trend, use a limit order, as they are fading the near box. The last trade exits on a stop, as the trend changes.
As you can see there is Longterm Period and Shortterm Period in the indicator options. Longterm period is used for major trend and shortterm period is used to take position according to major trend. in my test I got better performance in small time frames. you need to set longterm/shortterm periods by your trading strategies.
Enjoy!
Bollinger Bands BB 1.0The "BB 1.0" strategy is to buy in the upper band and sell in the lower band.
The logic behind the "BB 1.0" strategy is to enter an operation that has room to develop.

MACD-ASHello All,
This the script for Moving Average Convergence Divergence – MACD of Thomas Aspray, and called as MACD-AS and you may get earlier signals than MACD.
As MACD and MACD-AS are trend following indicators, they do not function well in sideway markets.
An example how it gets earlier signals than MACD
Good luck!

[KY]Stocks above MA Percentage(1) What is Percentage of Stocks above Moving Average?
Percentage of Stocks above Moving Average is a breadth indicator and could
be used for both trend-followers and contrarians.
a) Trend-Follow
If 50%-70% of Stocks are above their 200MA, bullish momentum is forming and
rally could last for next several weeks, months. (Confirmation)
b) Contrarian
If only 0-5% of Stocks are above their 200MA, the market should have been horrible
but it's a good opportunity to start building equities long position.
And if you short, you want to consider about dead cat bounce next.
(2) How to use this indicator?
- Add this indicator to your chart.
- Select the market type from options (S&P500, Dow Jones Industrials, Rullsel 2000 etc)
For sector analysis, you can select from S&P500 sectors.
- Select the Days of MA length from options ("200", "150", "100", "50", "20")

BankNifty Modified McClellan OscillatorThe McClellan Oscillator developed by Marian McClellan is a useful breadth indicator because it describes the acceleration that takes place in the breadth numbers.
How to read McClellan Oscillator
A positive or negative value gives a simplistic bullish or bearish statement about the short-term trend of the market
Very low readings show oversold conditions
Very high readings show overbought conditions
Divergences are also important to look for as a sign that the strength of a trend is waning
Here same oscillator is rebuilded for BANKNIFTY using the difference between Capital weighted Up Volume and Down Volume instead of Advance - Decline.

[KY]Cumulative Advance Decline Line(1) What is Cumulative A/D Line?
Cumulative A/D Line is a total of advancing issues - declining issues of all time.
This can be used to know long-term trend.(weeks, months long)
(2) How to use this?
- Add this script to your chart.
- Select the market from "Nasdaq", "NYSE", "Nasdaq+NYSE"
- You could change the moving average.

[KY]New High New Low Ratio(1) What is New High/New Low ratio?
New High/New Low ratio is a ratio based on new 52-week high issues and new 52-week low issues.
This indicator is best for identifying a bottom if you use this with other breadth indicators.
However, this is not so useful to know the timing for short because bull momentum tends to continue.
(Market top period is long, market bottom period is short.)
Reference: Stochcharts.com
school.stockcharts.com
(2) How to use?
- Add this indicator to your chart.
- Overbought >85 tends to continue, so don't short too early. You rather want to hold long until bull momentum deteriorates.
Dark green = bullish momentum zone.
- Oversold < 30 and if rolls over at the bottom, you can pile up long position.

[KY]McClellan Summation Index RSIThis script contains McClellan Summation Index(MSI) and McClellan Oscillator(MO)
(1) What is McClellan Summation Index(MSI)
McClellan Summation Index(MSI) is a breadth indicator derived the McClellan Oscillator(MO),
which is a breadth indicator based on Net Advances (advancing issues less declining issues).
The Summation Index is simply a running total of the McClellan Oscillator values.
To identify the market direction, I prefer to use the relative strength(RSI) of MSI rather than MSI itself
because MSI is a summation so it's difficult to compare with previous market patterns. So I use RSI applied MSI.
Reference: Stockcharts.com has a nice set of detailed explanation about MSI.
school.stockcharts.com
(2) How to use this script
- Add this script to your chart.
- You can choose one of two options ("MSI RSI" or "MO").
- You can also choose the market from three options ("Nasdaq", "NYSE", "Nasdaq+NYSE")
(3) "MSI RSI" or "MO"
a) "MSI RSI"
For swing trade(sevelal weeks), MSI RSI is much better to identify the broad market direction.
I backtested last several years of S&P500. The result was not symmetrical between MT bear/bull market.
For bull side, when MSI RSI curls up from the bottom(e.g. RSI 30 level), 90% of times out of them the market rallied.
For bear side, when MSI RSI rolles over to downside from the top(e.g. RSI 70 level), only 60% of times out of them the market declined.
So the market tends to hit negatively diverrgent high from advancing/declining issues perspective. Be careful to use MSI oscilator.
b) "MO"
For short term trade(intraday, 2-3 days of holding), MO is better because MSI is a summation so lags several days. MO is quick.
MO is sometimes very noisy, so you need to draw trendlines or horizontal levels to compare with the previous cases.
For beginners, I recommend to use "MSI RSI".


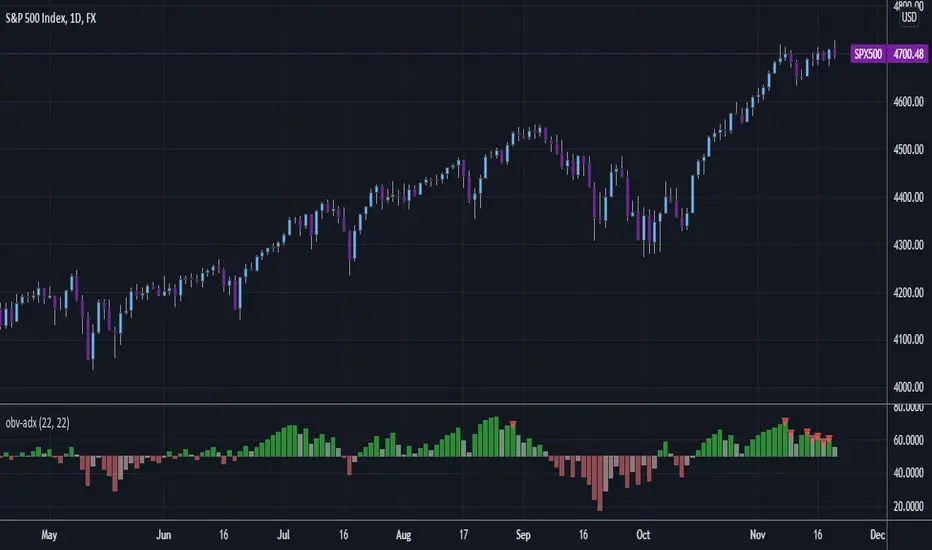
OBV - ADX and DI+/-This is the ADX and DI+/- indicator applied to OBV!
This really clearly shows up and down, but using VOLUME! Don't ignore it, there is too much information captured in the OBV.
If you just love the ADX/DI format, it is included in a checkbox.
Want some excellent background highlighting, turn in on in a checkbox.
Shout out to some inspirations
csw-dmi
unRekt-KISS-Addie
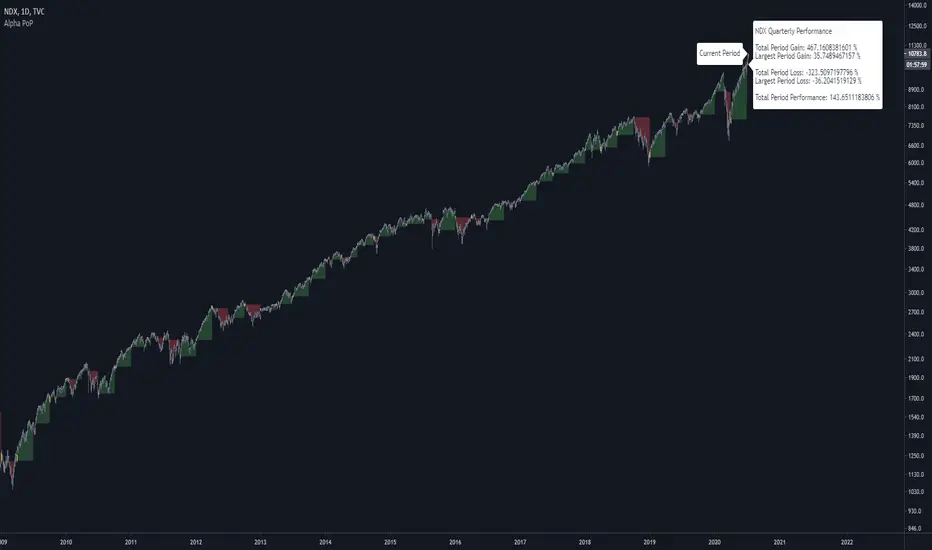
Alpha Performance of PeriodAlpha Performance of Period (PoP) produces a visualization of returns (gains and losses) over a quarterly, monthly, or annual period. It also displays the total % gain and loss over any length of days, months, and years as defined by the user.
Performance of Period (PoP) can be used to understand the performance of an asset over multiple periods using a single chart layout, and to compare the performance of different assets by using a multi-chart layout.
This can, for example, be used to compare the NASDAQ, S&P, and DJI over the past 20 years to create a dow vs. nasdaq vs. s&p performance chart. This can help you understand a comparison of historical returns by showing which performs the best month-over-month, quarter-to-quarter, year-to-year, throughout any custom period of days/months/years.
The ability to get a visualization of the % gain/loss can help to better understand how markets have performed over time and which markets have historically performed the best.
Check out the up and coming Educational Idea we will be releasing soon after this is live to see an example of how we use this tool.
Current Period Label
-----
Current Period : This label shows the current period's performance only when you hover over it.
(This label is located to the left of the current period's open candle and at the current candles close price)
TICKER "Time Period" Performance Label
-----
Total Period Gain : The total of all % gain periods from the start to end date.
Largest Period Gain : The biggest % gain period from the start to end date.
Total Period Loss : The total of all % loss periods from the start to end date.
Largest Period Loss : The biggest % loss period from the start to end date.
Total period Performance : The total % performance, the difference between the total gain and total loss.
NOTE : The "Current Period" performance is excluded from ALL five of the above-mentioned figures. This was done to avoid giving inaccurate comparison figures due to the period not being finished yet.
Inputs
-----
Current Script Version + Info : A drop-down list of instructions for the user to refer to.
Dark Mode Labels : Toggle on for Dark Mode. This is done since Labels text and background color can not be adjusted separately within the visual inputs so this is the best fit solution.
Time Period of Returns : Pick the period of performance you would like to emulate monthly/quarterly/annual.
Start Date : The day to start tracking performance.
Start Month : The month to start tracking performance.
Start Year : The year to start tracking performance.
End Date : The day to stop tracking performance.
End Month : The month to stop tracking performance.
End Year : The year to stop tracking performance.
As always if you have any feedback let us know in the comments and leave a like if you enjoy this tool :)
MMP Indicator 4-step WeeklyFading levels using martingale (limit orders, rebate venue) with no stop-loss orders, long the wings at the end of Support and Resist levels from prior week Friday right before the close. Re-hedge the order book units when there is a breakout.
