Multi-Timeframe S&R Zones (Shaded)This indicator automatically plots support and resistance zones based on recent price action across multiple timeframes:
🟥 Daily
🟧 4-Hour
🟨 1-Hour
🟩 30-Minute
🟦 5-Minute
Each zone is color-coded by timeframe and represented as a shaded region instead of a hard line, giving you a clearer and more dynamic view of key market levels. The zones are calculated from recent swing highs (resistance) and swing lows (support), and each zone spans ±5 pips for precision.
Only the most recent levels are displayed—up to 3 per timeframe—and are limited to the last 48 hours to avoid chart clutter and keep your workspace clean.
✅ Key Benefits:
Price Action Based: Zones are drawn from actual market structure (swings), not arbitrary levels.
Multi-Timeframe Clarity: View confluence across major intraday and higher timeframes at a glance.
Color-Coded Zones: Instantly distinguish between timeframes using intuitive colour coordination.
Clean Charts: Only shows the latest relevant levels, automatically expires old zones beyond 48 hours.
Flexible & Lightweight: Built for Tradingview Essential; optimized for performance.
Breadth Indicators

FX Majors (+CN) Currency Basket ComparisonDescription:
This indicator shows how individual FX major currencies (including CNY) have performed relative to each other. It calculates each currency's performance against a "Trade Weighted" basket of other major currencies.
I created this because I couldn't find it, and I wanted an easy way to see currency behaviour and flows.
Purpose:
It lets you see the relative strength and weakness of each currency, similar to how the DXY measures USD strength, but for all the major currencies. Each basket and currency weights are based on Trade Weighted values from literature/economics.
This way you can maybe decide which crosses / pairs to trade.
Can helps you visualise how events (economic, news or otherwise) affect currency flows.
Features:
Relative Performance: Focuses on how a currency's value has changed over time, rather than its absolute level.
Normalization: Adjusts currency values to a starting date, making it easy to compare their performance.
Adjustable Start Date: You can set the anchor date to choose the starting point for calculating relative performance.
Customizable Weights: The indicator allows you to use custom weights for each currency basket should you wish.

Enhanced Volume w/ Pocket Pivots, Milestones & LiquiditySure! Here’s a professional and clear **description** you can use when saving or publishing the script on TradingView:
---
## 📄 Script Description: *Enhanced Volume w/ Pocket Pivots, Milestones & Liquidity*
This custom volume indicator enhances the default volume view by combining key institutional-level insights into a single tool. It highlights meaningful volume activity, liquidity conditions, and milestone events to help traders better understand accumulation/distribution and smart money participation.
### 🔍 Features:
* **Color-coded volume bars**:
* 🔵 **Pocket Pivot Volume (PPV)**: Up-day with volume > highest down-day volume of last 10 bars.
* 🟢 **Up Volume**: Up-day with volume > 50-day average.
* 🔴 **Down Volume**: Down-day with volume > 50-day average.
* 🟠 **Dry Volume**: Low-volume bars < 20% of 50-day average.
* ⚫ **Neutral/Other bars**: No significant signal.
* **Volume Milestones**:
* **HVE**: Highest volume ever (20 years lookback).
* **HVY**: Highest volume in the past 1 year (252 bars).
* **HVQ**: Highest volume in the past quarter (63 bars).
* **Projected Volume**:
* Real-time estimate of end-of-day volume based on elapsed session time.
* **Liquidity Metrics**:
* Displays current and 50-day average dollar volume.
* Estimates 1-minute liquidity for large-position feasibility.
* **Relative Volume Label**:
* Displays how today’s volume compares to the 50-day average.
* **Alerts Included**:
* Set alerts for HVE, HVY, and HVQ to catch key breakout or climactic volume events.
---
### 🧠 Ideal For:
* Growth stock traders
* Volume/price analysts
* Intraday & swing traders
* Institutions or prop traders needing liquidity benchmarks
---
Let me know if you'd like a short or promotional version (for sharing with others).

S&P 500 Estimated PE (Sampled Every 4)📊 **S&P 500 Estimated PE Ratio (from CSV)**
This indicator visualizes the forward-looking estimated PE ratio of the S&P 500 index, imported from external CSV data.
🔹 **Features:**
- Real historical daily data from 2008 onward
- Automatically aligns PE values to closest available trading date
- Useful for macro valuation trends and long-term entry signals
📌 **Best for:**
- Investors interested in forward-looking valuation
- Analysts tracking over/undervaluation trends
- Long-term timing overlay on price action
Category: `Breadth indicators`, `Cycles`

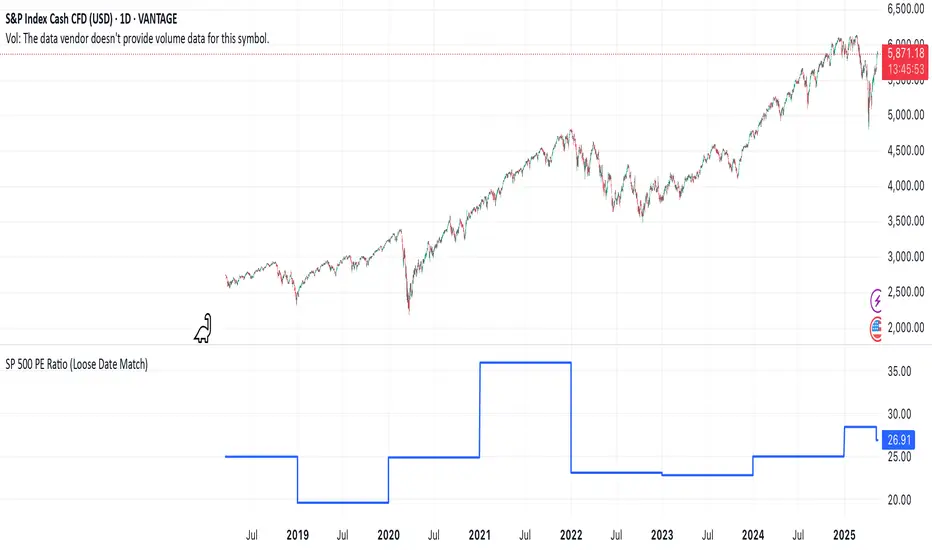
SP 500 PE Ratio (Loose Date Match)📈 **S&P 500 PE Ratio (from Excel Data)**
This custom indicator visualizes the historical S&P 500 Price-to-Earnings (PE) Ratio loaded from Excel. Each data point represents a snapshot of the market valuation at a specific time, typically on an annual or quarterly basis.
🔹 **What it does:**
- Plots the PE ratio values on the chart aligned with historical dates
- Uses stepwise or linear rendering to account for missing trading days
- Helps identify valuation cycles and extremes (e.g., overvalued vs undervalued)
🔍 **Use case:**
- Long-term market analysis
- Compare PE trends with price performance
- Spot long-term entry/exit zones based on valuation
🛠️ Future plans:
- Add value zone highlighting (e.g., PE > 30 = red, PE < 15 = green)
- Support for dynamic datasets (via Google Sheets or Notion)
Category: `Breadth indicators`, `Cycles`
💡 Source: Manually imported data (can be replaced with any custom macro data series)
Market Breadth Toolkit [LuxAlgo]The Market Breadth Toolkit allows traders to use up to 6 different market breadth measures on two different exchanges, for a total of 12 different views of the market.
This toolkit includes divergence detection and allows setting custom fixed levels for traders who want to experiment with them.
🔶 USAGE
The main idea behind Breadth is to measure the number of advancing and declining issues and/or volume by exchange to have an idea of the underlying strength of the whole exchange.
On the other hand, thrusts represent big impulses in the breadth, as it is described by technicians to be the start of a new bullish trend.
By default, the Toolkit is set to "Breadth Thrust Zweig", with divergences enabled.
We will now explain all the different breadth measures available in the toolkit.
🔹 Deemer Breakaway Momentum
The "Breakaway Momentum" is a concept related to market breadth introduced by legendary technical analyst Walter Deemer.
As stated on his website:
We coined the term "breakaway momentum" in the 1970's to describe this REALLY powerful upward momentum
and:
We now know that the stock market generates breakaway momentum when the 10-day total advances on the NYSE are greater than 1.97 times the 10-day total NYSE declines OR the 20-day total advances on the NYSE are greater than 1.72 times the 20-day total NYSE declines.
As we can see in the chart above, which shows both methods, momentum is identified when the ratio of advancing issues to declining issues is greater than 1.97 for the 10-day average or 1.72 for the 20-day average.
🔹 Zweig Breadth Tools
Legendary trader and author Marting Zweig, best known as the author of "Winning on Wall Street" and the creator of the Put/Call Ratio.
In this toolkit, we feature two of his other tools:
Breadth Thrust: Number of Advancing / (Number of Advancing + Number of Declining Stocks)
Market Thrust: (Number of Advancing × Advancing Volume) — (Number of Declining Stocks × Declining Volume)
As we can see on the above chart, the Breadth Thrust printed a new signal on April 24, 2025, which is a bullish signal on the daily chart that can last several months, considering the previous signals.
On the right side, we have the Market Thrust as the delta between advancing minus declining volume weighted.
🔹 Whaley Measures
Wayne Whaley received the 2010 Charles Dow Award from the CMT Association, as stated on their website: "In 1994, the CMT Association established the Charles H. Dow Award to recognize outstanding research in technical analysis."
We include two of the tools from this paper:
Advance Decline Thrust: Number of Advancing / (Number of Advancing + Number of Declining Stocks)
Up/Down Volume Thrust Advancing Volume / (Advancing Volume + Declining Volume)
The chart above shows Thrust signals at extreme readings as described in the paper.
🔹 Divergences
The divergence detector is enabled by default, traders can disable it and fine-tune the detection length in the settings panel.
🔹 Fixed Levels
Traders can adjust the Thrust detection thresholds in the settings panel.
In the image above, we can see the Deemer Breakaway Momentum 10 with the original threshold (below) and with the 3.0 threshold (above).
🔶 SETTINGS
Breadth: Choose between 6 different breadth thrust measurement methods.
Data: Choose between NYSE or NASDAQ exchanges.
Divergences: Enable/Disable divergences and select the length detection.
🔹 Levels
Use Fixed Levels: Enable/Disable Fixed Levels.
Top Level: Select the top-level threshold.
Bottom Level: Select bottom level threshold.
Levels Style: Choose between dashed, dotted, or solid style.
🔹 Style
Breadth: Select breadth colors
Divergence: Select divergence colors

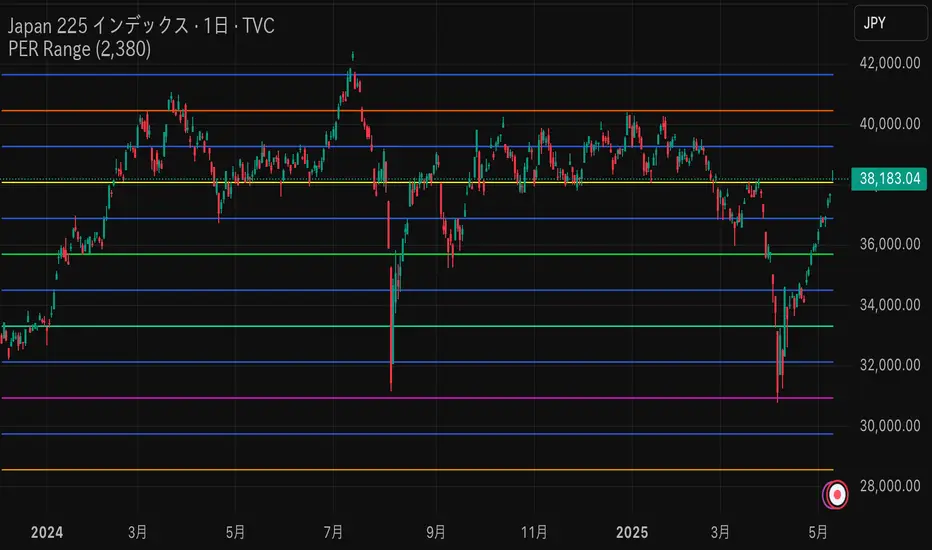
PER x RangeThis Pine Script calculates the target price of the Nikkei Average based on the EPS (Earnings Per Share) and different PER (Price-to-Earnings Ratio) multiples ranging from 17.5x to 12x, in increments of 0.5x. It then plots these target prices on the chart.
Key Features:
Input EPS: You can manually input the current EPS value of the Nikkei Average (the example uses 2380, but you can replace it with the actual EPS).
PER Multiples Calculation: The script calculates target prices for different PER multiples (17.5x, 17x, 16.5x, ..., down to 12x).
Plotting Target Prices: The calculated target prices (EPS * PER) are plotted on the chart as blue lines, showing you different target price scenarios based on varying PER multiples.
Ind JDV 2.2 PRO🛡️ Ind JDV 2.0 PRO – Chandelier Exit + FVG + EMA (Precise Entry)
Description:
Ind JDV 2.0 PRO is an advanced indicator that combines three powerful confirmations to find the best trading opportunities:
Chandelier Exit: Filters trade direction based on volatility breakouts controlled by ATR.
Fair Value Gap (FVG): Detects price inefficiency zones at their very first appearance.
EMA (Exponential Moving Average): Acts as a trend filter to ensure trading with the dominant market flow.
🔍 Key Features:
Marks only one precise signal on the candle where the FVG starts.
Confirms the trend using a 150-period EMA (fully adjustable).
Optionally draws Take Profit and Stop Loss target lines for clear visual guidance.
Background color changes (green or red) to reflect the active market trend.
Built-in automatic alerts for buy or sell opportunities.
Optimized code for maximum speed across all timeframes.
✅ Perfect for trading indices, forex, cryptocurrencies, and stocks.
✅ Compatible with all timeframes (5m, 15m, 1H, 4H, Daily).
✅ Fully customizable to fit scalping, intraday, or swing trading styles.
⚙️ Default Parameters:
ATR Period: 10
ATR Multiplier: 3.0
EMA Period: 150
FVG Lookback: 3 candles
Take Profit: 100 points
Stop Loss: 50 points
(All values are adjustable in settings.)
📈 How it works:
The indicator analyzes price structure.
Detects a valid Fair Value Gap (FVG) formation.
Confirms the breakout with a Chandelier Exit signal.
Verifies price alignment with the EMA trend.
Triggers a single entry signal (BUY or SELL) exactly on the first candle that meets all conditions.
🚀 Optimize your trading by focusing on high-probability zones, supported by solid confirmations and clean visual signals.
Add Ind JDV 2.0 PRO to your trading arsenal and take your strategy to the next level! 🔥

5m Gold Strategy - Session Break + Previous Day High/LowHere is your complete Pine Script v5 code for TradingView that:
Implements your 5-minute Gold breakout strategy.
Uses previous day high/low levels.
Confirms entry based on 15-minute SMA trend (SMA 9 > SMA 21).
Marks session time.
Filters news time (pause trading 15 minutes before/after major red news from ForexFactory).

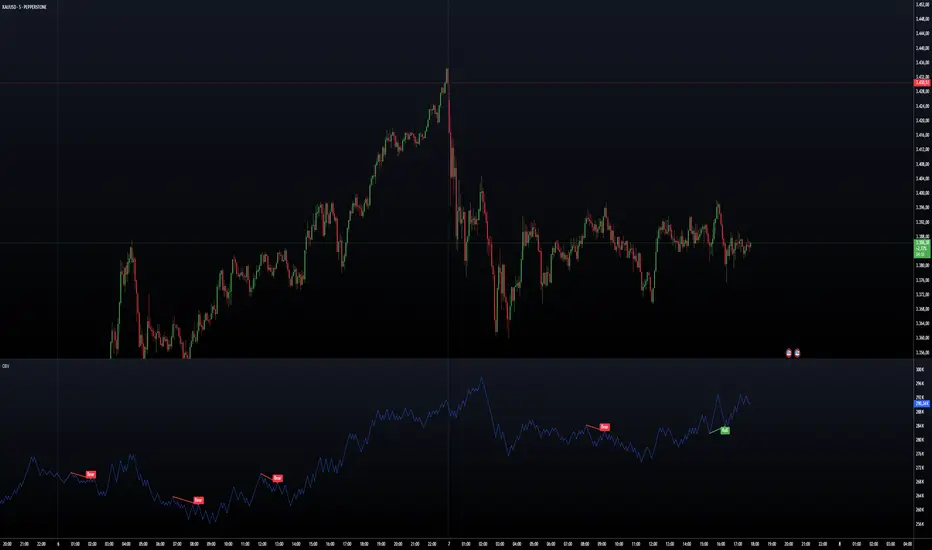
OBV by readCrypto
-------------------------------------
OBV is used as a leading indicator to predict stock price movements by measuring changes in trading volume.
Reflecting the cumulative value of trading volume,
- When the price rises, if the trading volume increases, OBV rises,
- When the price falls, if the trading volume decreases, OBV falls.
Therefore, the movement of the OBV indicator must be checked along with the price movement, and it has the disadvantage of being unreliable for coins (tokens) with low trading volume.
---------------------------------------
(First interpretation method)
By adding a signal line for the OBV indicator,
- If the OBV indicator moves above the signal line, it is likely to show an upward trend,
- If the OBV indicator moves beyond the signal line, it is likely to show a downward trend.
This interpretation method is difficult to use in actual trading strategies because the OBV indicator often moves up and down repeatedly based on the signal line.
Therefore, it is recommended to use this interpretation method as reference when analyzing charts.
-------------------------------
(Second interpretation method)
Draw support and resistance lines based on the high and low points of the OBV indicator
- If the OBV indicator breaks through the previous high point, it is likely to show an upward trend,
- If the OBV indicator breaks through the previous low point, it is likely to show a downward trend.
This interpretation method is a bit more reliable than the first interpretation method, but it has the disadvantage of having to consider support and resistance lines separately based on the high and low points.
-
To compensate for this, a High line for the high point and a Low line for the low point were added.
- If the OBV indicator shows an upward breakout of each line (Low, HL2, High), the price is likely to rise,
- If the OBV indicator shows a downward breakout of each line (Low, HL2, High), the price is likely to fall.
-
Also, the Low and High lines can be interpreted like Bollinger Bands.
That is, if the Low and High lines show a contraction, the price is likely to move sideways, and if they show an expansion, the price is likely to show a trend.
Therefore, if the High line breaks upward in a contracted state,
- It is likely to show an upward trend,
- If the Low line breaks downward, it is likely to show a downward trend.
In an expanded state, you should focus on finding the point to realize profits rather than conducting new transactions.
--------------------------------
It is not easy to interpret the change in actual transaction volume and use it to create a trading strategy.
In particular, it is more difficult in the coin market where multiple exchanges are linked to show movements for one coin (token).
Therefore, the coin market is actively conducting transactions without referring to trading volume at all by following trends.
However, I think that if you interpret the change in trading volume and use it to find a trading point, it can help you find a more accurate trading point.
In that sense, I think that an indicator that adds the High and Low lines of the OBV indicator can be used as meaningful reference material.
-----------------------------------------------------------------
-------------------------------------
OBV는 거래량의 변화를 측정하여 주가 움직임을 예측하는 선행 지표로 활용됩니다.
거래량의 누적값을 반영하여
- 가격이 상승할 때 거래량이 증가면 OBV가 상승하고,
- 가격이 하락할 때 거래량이 줄면 OBV가 하락하게 됩니다.
따라서, 가격의 움직임과 함께 OBV 지표의 움직임을 확인하여야 하고 거래량이 적은 코인(토큰)에서는 신뢰성이 떨어지는 단점도 가지고 있습니다.
---------------------------------------
(첫번째 해석 방법)
OBV 지표에 대한 Signal선을 추가하여
- OBV 지표가 Signal선 이상에서 이동하게 되면 상승세를 보일 가능성이 높고,
- OBV 지표가 Signal선 이항에서 이동하게 되면 하락세를 보일 가능성이 높습니다.
이러한 해석 방법은 Signal선을 기준으로 OBV 지표가 반복적으로 위아래로 움직임을 보이는 경우가 많기 때문에 실제 거래 전략에 활용되기가 어려운 면이 있습니다.
따라서, 이러한 해설 방법은 차트 분석을 할 때 참고 자료로 활용하는 것이 좋습니다.
-------------------------------
(두번째 해석 방법)
OBV 지표의 고점과 저점을 기준하여 지지와 저항선을 그려
- OBV 지표가 이전 고점을 상향 돌파하면 상승세를 보일 가능성이 높고,
- OBV 지표가 이전 저점을 하향 돌파하면 하락세를 보일 가능성이 높습니다.
이러한 해석 방법은 첫번째 해석 방법보다 좀 더 신뢰성이 있는 방법이지만, 고점과 저점을 기준으로 지지와 저항선을 나누어 생각해야 하는 단점이 있습니다.
-
이를 보완하고자 고점에 대한 High선과 저점에 대한 Low선을 추가하였습니다.
- OBV 지표가 각 선(Low, HL2, High)을 상향 돌파하는 모습을 보이면 가격이 상승할 가능성이 높고,
- OBV 지표가 각 선(Low, HL2, High)을 하향 돌파하는 모습을 보이면 가격이 하락할 가능성이 높습니다.
-
또한, Low선과 High선을 볼린저밴드와 같이 해석할 수 있습니다.
즉, Low선과 High선이 수축하는 모습을 보이면 가격은 횡보할 가능성이 높고, 확장하는 모습을 보이면 가격은 추세를 나타낼 가능성이 높습니다.
따라서, 수축한 상태에서
- High선을 상향 돌파하게 되면 상승세를 나타낼 가능성이 높고,
- Low선을 하향 돌파하게 되면 하락세를 나타낼 가능성이 높습니다.
확장된 상태에서는 신규 거래를 진행하기 보다 수익 실현할 시점을 찾는데 집중해야 합니다.
--------------------------------
실제 거래량의 변화를 해석하여 거래 전략을 만드는데 활용하기가 쉽지 않습니다.
특히, 하나의 코인(토큰)에 대해서 여러 개의 거래소가 연동되어 움직임을 나타내는 코인 시장에서는 더욱 어려움이 있습니다.
따라서, 코인 시장은 추세 추종으로 아예 거래량을 참고하지 않고 거래를 진행하는 방법이 활성화되어 있기도 합니다.
하지만, 거래량의 변화를 해석하여 거래 시점을 찾는데 활용한다면 보다 정확한 거래 시점을 찾는데 도움을 받을 수 있다고 생각합니다.
그러한 의미에서 OBV 지표의 High선과 Low선을 추가한 지표가 의미 있는 참고 자료로 활용될 수 있다고 생각합니다.
-------------------------------------------------------------------

HMA 200 + EMA 20 Crossover StrategyThis strategy combines a long-term trend filter using the Hull Moving Average (HMA 200) with a short-term entry trigger using the Exponential Moving Average (EMA 20).
📈 Entry Logic:
Buy Entry: When price is above the HMA 200 and crosses above the EMA 20.
Sell Entry: When price is below the HMA 200 and crosses below the EMA 20.
The strategy closes the current position and reverses on the opposite signal.
⚙️ Strategy Settings (Backtest Configuration):
Position size: 10% of equity per trade
Commission: 0.1% per trade (to simulate broker fees)
Slippage: 2 ticks (to reflect realistic fill conditions)
✅ Purpose:
This script is designed to identify high-probability trades in the direction of the overall trend, avoiding whipsaw conditions. It is useful for traders looking for a dynamic crossover-based system that filters trades based on longer-term momentum.
🔎 Make sure to test across multiple assets and timeframes. For best results, apply this strategy to liquid trending markets like major FX pairs, indices, or high-cap stocks.

Market Sentiment Index US Top 40 [Pt]▮Overview
Market Sentiment Index US Top 40 [Pt} shows how the largest US stocks behave together. You pick one simple measure—High Low breakouts, Above Below moving average, or RSI overbought/oversold—and see how many of your chosen top 10/20/30/40 NYSE or NASDAQ names are bullish, neutral, or bearish.
This tool gives you a quick view of broad-market strength or weakness so you can time trades, confirm trends, and spot hidden shifts in market sentiment.
▮Key Features
► Three Simple Modes
High Low Index: counts stocks making new highs or lows over your lookback period
Above Below MA: flags stocks trading above or below their moving average
RSI Sentiment: marks overbought or oversold stocks and plots a small histogram
► Universe Selection
Top 10, 20, 30, or 40 symbols from NYSE or NASDAQ
Option to weight by market cap or treat all symbols equally
► Timeframe Choice
Use your chart’s timeframe or any intraday, daily, weekly, or monthly resolution
► Histogram Smoothing
Two optional moving averages on the sentiment bars
Markers show when the faster average crosses above or below the slower one
► Ticker Table
Optional on-chart table showing each ticker’s state in color
Grid or single-row layout with adjustable text size and color settings
▮Inputs
► Mode and Lookback
Pick High Low, Above Below MA, or RSI Sentiment
Set lookback length (for example 10 bars)
If using Above Below MA, choose the moving average type (EMA, SMA, etc.)
► Universe Setup
Market: NYSE or NASDAQ
Number of symbols: 10, 20, 30, or 40
Weights: on or off
Timeframe: blank to match chart or pick any other
► Moving Averages on Histogram
Enable fast and slow averages
Set their lengths and types
Choose colors for averages and markers
► Table Options
Show or hide the symbol table
Select text size: tiny, small, or normal
Choose layout: grid or one-row
Pick colors for bullish, neutral, and bearish cells
Show or hide exchange prefixes
▮How to Read It
► Sentiment Bars
Green means bullish
Red means bearish
Near zero means neutral
► Zero Line
Separates bullish from bearish readings
► High Low Line (High Low mode only)
Smooth ratio of highs versus lows over your lookback
► MA Crosses
Fast MA above slow MA hints rising breadth
Fast MA below slow MA hints falling breadth
► Ticker Table
Each cell colored green, gray, or red for bull, neutral, or bear
▮Use Cases
► Confirm Market Trends
Early warning when price makes highs but breadth is weak
Catch rallies when breadth turns strong while price is flat
► Spot Sector Rotation
Switch between NYSE and NASDAQ to see which group leads
Watch tech versus industrial breadth to track money flow
► Filter Trade Signals
Enter longs only when breadth is bullish
Consider shorts when breadth turns negative
► Combine with Other Indicators
Use RSI Sentiment with trend tools to spot overextended moves
Add volume indicators in High Low mode for breakout confirmation
► Timeframe Analysis
Daily for big-picture bias
Intraday (15-min) for precise entries and exits

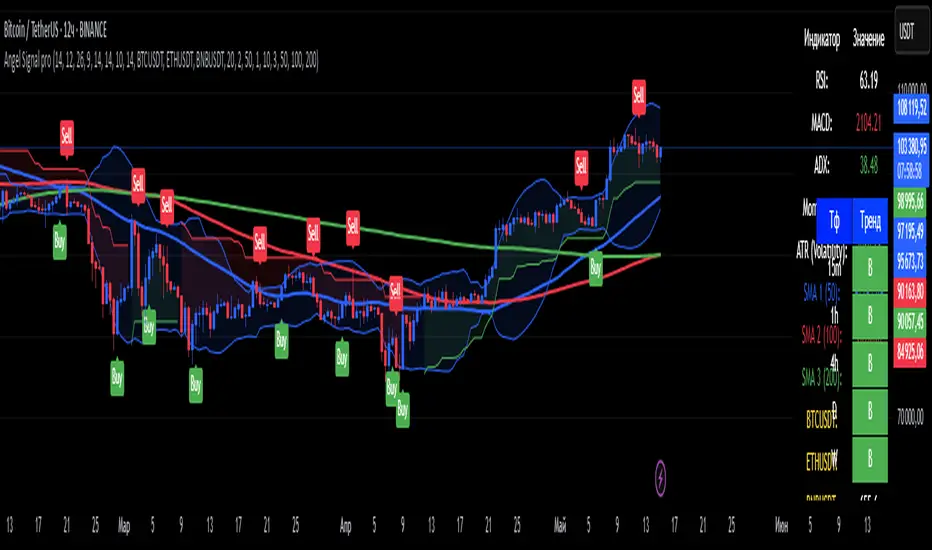
Angel Signal proAngel Signal Pro is a comprehensive technical analysis tool that integrates multiple indicators for a structured market assessment.
RSI, MACD, and ADX — evaluate trend strength and identify potential entry and exit points.
Momentum and ATR — measure price acceleration and volatility, assisting in risk management.
Stochastic Oscillator — detects overbought and oversold conditions.
SMA (50, 100, 200) — tracks key moving averages with the option to enable all at once.
Cryptocurrency price display — select and monitor real-time prices of any cryptocurrency available on the BINANCE exchange.
Automatic trend detection— classifies trends as bullish, bearish, or neutral based on RSI and MACD signals.
Customizable table — presents key indicator values in a structured and convenient format. The table also provides automatic trend detection across different timeframes (TF), allowing you to assess the current market situation more accurately on various levels.
Automatic gap detection — identifies market gaps, helping to spot potential trading opportunities.
Buy and sell signals — the system generates buy and sell signals based on the analysis of five key indicator values, allowing traders to respond quickly to market changes.
Bollinger Bands — helps assess market volatility and identify support and resistance levels, as well as potential reversal points, by detecting when prices move outside of normal volatility ranges.
Customization settings — in Angel Signal Pro, you can select which indicators and features you want to display. All elements can be turned on or off according to your preferences. There is also the ability to change colors and the appearance of each element, allowing you to tailor the interface to your personal preferences and make the tool more convenient to use.
Angel Signal Pro is suitable for traders of all experience levels and helps navigate market conditions with confidence.
29 мар.
Информация о релизе
Added Super Trend, improved the quality of buy and sell signals, and enhanced settings. Now, all toggle buttons for enabling and disabling indicators follow one another.
30 мар.
Информация о релизе
Fixed several errors in the settings and improved gap search.
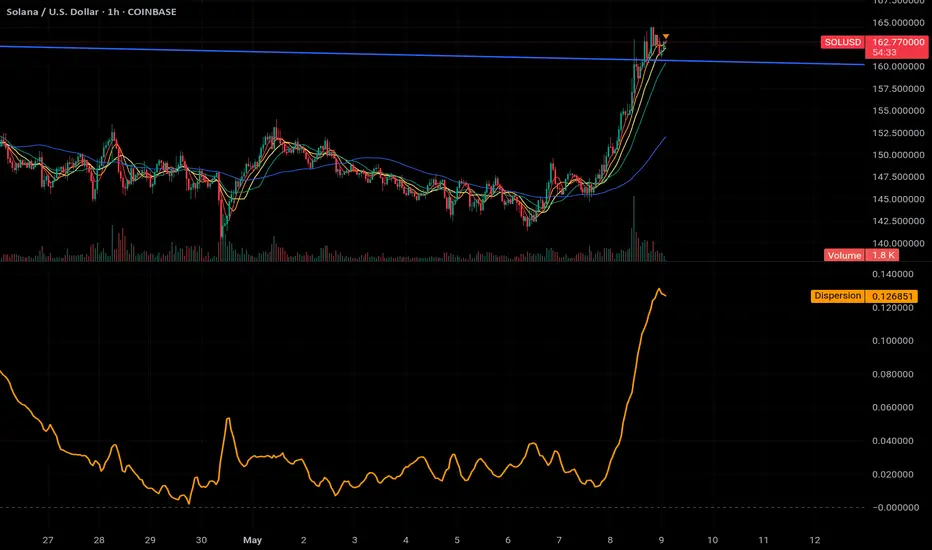
MA Dispersion+MA Dispersion+ — read the “breathing space” between your moving-averages
Get instant feedback on trend strength, volatility expansion and mean-reversion — across any timeframe.
MA Dispersion+ turns the humble moving-average stack into a single, easy-to-read oscillator that tells you at a glance whether price is coiling or fanning out.
🧩 What it does
Plugs into your favourite MA setup
• Pick the classic 5 / 20 / 50 / 200 lengths or disable any combination with one click.
• Choose the MA engine you trust — SMA, EMA, RMA, VWMA or WMA.
• Works on any timeframe thanks to TradingView’s security() engine.
Measures “spread”
For every bar it calculates the absolute distance of each selected MA from their average.
The tighter the stack, the lower the value; the wider the fan, the higher the value.
Adds professional-grade controls
• Weighting — let short-term MAs dominate (Inverse Length), keep everything equal, or dial in your own custom weights.
• Normalisation — convert the raw distance into a percentage of price, ATR multiples, or scale by the MAs’ own mean so you can compare symbols of any price or volatility.
🔍 How traders use it
Trend confirmation – rising dispersion while price breaks out = momentum is genuine.
Volatility squeeze – dispersion parking near zero warns that a big move is loading.
Multi-TF outlook – drop one pane per timeframe (e.g. 5 m, 1 h, 1 D) and see which layer of the market is driving.
Mean-reversion plays – spikes that fade quickly often coincide with exhaustion and snap-backs.
⚙️ Quick-start
Add MA Dispersion+ to your chart.
Set the pane’s timeframe in the first input.
Tick the MA lengths you actually use.
(Optional) Pick a weighting scheme and a normaliser.
Repeat the indicator for as many timeframes as you like — each instance keeps its own settings.
✨ Why you’ll love it
Zero clutter – one orange line tells you what four separate MAs whisper.
Configurable yet bullet-proof – all lengths are hard-coded constants, so Pine never complains.
Context aware – normalisation lets you compare BTC’s $60 000 chaos with EURUSD’s four--decimals calm.
Lightweight – no labels, no drawings, no background processing — perfect for mobile and multi-pane layouts.
Give MA Dispersion+ a try and let your charts breathe — you’ll never look at moving-average ribbons the same way again.
Happy trading!
Smart Trend Lines [The_lurker]
Smart Trend Lines
A multi-level trend classifier that detects bullish and bearish conditions using a methodology based on drawing trend lines—main, intermediate, and short-term—by identifying peaks and troughs. The tool highlights trend strength by applying filters such as the Average Directional Index (ADX) (A), Relative Strength Index (RSI) (R), and Volume (V), making it easier to interpret trend strength. The filter markers (V, A, R) in the Smart Trend Lines indicator are powerful tools for assessing the reliability of breakouts. Breakouts containing are the most reliable, as they indicate strong volume support, trend strength, and favorable momentum. Breakouts with partial filters (such as or ) require additional confirmation, while breakouts without filters ( ) should be avoided unless supported by other strong signals. By understanding the meaning of each filter and the market context.
Core Functionality
1. Trend Line Types
The indicator generates three distinct trend line categories, each serving a specific analytical purpose:
Main Trend Lines: These are long-term trend lines designed to capture significant market trends. They are calculated based on pivot points over a user-defined period (default: 50 bars). Main trend lines are ideal for identifying macro-level support and resistance zones.
Mid Trend Lines: These are medium-term trend lines (default: 21 bars) that focus on intermediate price movements. They provide a balance between short-term fluctuations and long-term trends, suitable for swing trading strategies.
Short Trend Lines: These are short-term trend lines (default: 9 bars) that track rapid price changes. They are particularly useful for scalping or day trading, highlighting immediate support and resistance levels.
Each trend line type can be independently enabled or disabled, allowing traders to tailor the indicator to their preferred timeframes.
2. Breakout Detection
The indicator employs a robust breakout detection system that identifies when the price crosses a trend line, signaling a potential trend reversal or continuation. Breakouts are validated using the following filters:
ADX Filter: The Average Directional Index (ADX) measures trend strength. A user-defined threshold (default: 20) ensures that breakouts occur during strong trends, reducing false signals in range-bound markets.
RSI Filter: The Relative Strength Index (RSI) identifies overbought or oversold conditions. Breakouts are filtered based on RSI thresholds (default: 65 for overbought, 35 for oversold) to avoid signals in extreme market conditions.
Volume Filter: Breakouts are confirmed only when trading volume exceeds a moving average (default: 20 bars) and aligns with the breakout direction (e.g., higher volume on bullish breakouts when the candle closes higher).
Breakout events are marked with labels on the chart, indicating the type of trend line broken (Main, Mid, or Short) and the filters satisfied (Volume, ADX, RSI). Alerts are triggered for each breakout, providing real-time notifications.
3. Customization Options
The indicator offers extensive customization through input settings, organized into logical groups for ease of use:
Main Trend Line Settings
Length: Defines the number of bars used to calculate pivot points (default: 50).
Bullish Color: Color for upward-sloping (bullish) main trend lines (default: green).
Bearish Color: Color for downward-sloping (bearish) main trend lines (default: red).
Style: Line style options include solid, dashed, or dotted (default: solid).
Mid Trend Line Settings
Length: Number of bars for mid-term pivot points (default: 21).
Show/Hide: Toggle visibility of mid trend lines (default: enabled).
Bullish Color: Color for bullish mid trend lines (default: lime).
Bearish Color: Color for bearish mid trend lines (default: maroon).
Style: Line style (default: dashed).
Short Trend Line Settings
Length: Number of bars for short-term pivot points (default: 9).
Show/Hide: Toggle visibility of short trend lines (default: enabled).
Bullish Color: Color for bullish short trend lines (default: teal).
Bearish Color: Color for bearish short trend lines (default: purple).
Style: Line style (default: dotted).
General Display Settings
Break Check Price: Selects the price type for breakout detection (Close, High, or Low; default: Close).
Show Previous Trendlines: Option to display historical main trend lines (default: disabled).
Label Size: Size of breakout labels (Tiny, Small, Normal, Large, Huge; default: Small).
Filter Settings
ADX Threshold: Minimum ADX value for trend strength confirmation (default: 25).
Volume MA Period: Period for the volume moving average (default: 20).
RSI Filter: Enable/disable RSI filtering (default: enabled).
RSI Upper Threshold: Upper RSI limit for overbought conditions (default: 65).
RSI Lower Threshold: Lower RSI limit for oversold conditions (default: 35).
4. Technical Calculations
The indicator relies on several technical calculations to ensure accuracy:
Pivot Points: Pivot highs and lows are detected using the ta.pivothigh and ta.pivotlow functions, with separate lengths for Main, Mid, and Short trend lines.
Slope Calculation: The slope of each trend line is calculated as the change in price divided by the change in bar index between two pivot points.
ADX Calculation: ADX is computed using a 14-period Directional Movement Index (DMI), with smoothing over 14 bars.
RSI Calculation: RSI is calculated over a 14-period lookback using the ta.rsi function.
Volume Moving Average: A simple moving average (SMA) of volume is used to determine if current volume exceeds the average.
5. Strict Mode Validation
To ensure the reliability of trend lines, the indicator employs a strict mode check:
For bearish trend lines, all prices between pivot points must remain below the projected trend line.
For bullish trend lines, all prices must remain above the projected trend line.
Post-pivot break checks ensure that no breakouts occur between pivot points, enhancing the validity of the trend line.
6. Trend Line Extension
Trend lines are dynamically extended forward until a breakout occurs. The extension logic:
Projects the trend line using the calculated slope.
Continuously validates the extension using strict mode checks.
Stops extension upon a breakout, fixing the trend line at the breakout point.
7. Alerts and Labels
Labels: Breakout labels are placed above (for bearish breakouts) or below (for bullish breakouts) the price bar. Labels include:
A prefix indicating the trend line type (B for Main, M for Mid, S for Short).
A suffix showing satisfied filters (e.g., for Volume, ADX, and RSI).
Alerts: Each breakout triggers a one-time alert per bar close, with a descriptive message indicating the trend line type and filters met.
Detailed Code Breakdown
1. Initialization and Inputs
The script begins by defining the indicator with indicator('Smart Trend Lines ', overlay = true), ensuring it overlays on the price chart. Input settings are grouped into categories (Main, Mid, Short, General Display, Filters) for user convenience. Each input includes a tooltip in both English and Arabic, enhancing accessibility.
2. Technical Indicator Calculations
Volume MA: Calculated using ta.sma(volume, volPeriod) to compare current volume against the average.
ADX: Computed using custom dirmov and adx functions, which calculate the Directional Movement Index and smooth it over 14 periods.
RSI: Calculated with ta.rsi(close, rsiPeriod) over 14 periods.
Price Selection: The priceToCheck function selects the price type (Close, High, or Low) for breakout detection.
3. Pivot Detection
Pivot points are detected using ta.pivothigh and ta.pivotlow for each trend line type. The lookback period is set to the respective trend line length (e.g., 50 for Main, 21 for Mid, 9 for Short).
4. Trend Line Logic
For each trend line type (Main, Mid, Short):
Bearish Trend Lines: Identified when two consecutive pivot highs form a downward slope. The script validates the trend line using strict mode and post-pivot break checks.
Bullish Trend Lines: Identified when two consecutive pivot lows form an upward slope, with similar validation.
Trend lines are drawn using line.new, with separate lines for the initial segment (between pivots) and the extended segment (from the second pivot forward).
5. Breakout Detection and Labeling
Breakouts are detected when the selected price crosses the trend line level. The script checks:
Volume conditions (above average and aligned with candle direction).
ADX condition (above threshold).
RSI condition (within thresholds if enabled). Labels are created with label.new, and alerts are triggered with alert.
6. Trend Line Extension
The extendTrendline function dynamically updates the trend line’s endpoint unless a breakout occurs. It uses strict mode checks to ensure the trend line remains valid.
7. Previous Trend Lines
If enabled, previous main trend lines are stored in arrays (previousBearishStartLines, previousBullishTrendLines, etc.) and displayed on the chart, providing historical context.
Disclaimer:
The information and publications are not intended to be, nor do they constitute, financial, investment, trading, or other types of advice or recommendations provided or endorsed by TradingView.

Current Fractal High/Low (Dynamic)
This indicator dynamically tracks the most recent confirmed Fractal High and Fractal Low across any timeframe using custom left/right bar configurations.
🔍 Key Features:
Detects Fractal Highs and Lows based on user-defined pivot settings.
Draws a green line and label ("FH") at the most recent Fractal High.
Draws a red line and label ("FL") at the most recent Fractal Low.
All lines extend from the confirmation bar to the current candle.
Automatically removes old lines and labels for a clean, uncluttered chart.
🛠️ Customizable Inputs:
Left & Right bars for pivot sensitivity
Line width for visibility
📌 Use Cases:
Identifying structure shifts
Recognizing key swing points
Supporting liquidity and breakout strategies
💡 Fractals are confirmed only after the full formation of the pattern (left and right bars). This ensures reliability over reactivity.
This script is designed for intraday to swing traders who want a reliable way to visualize market turning points with minimal noise.

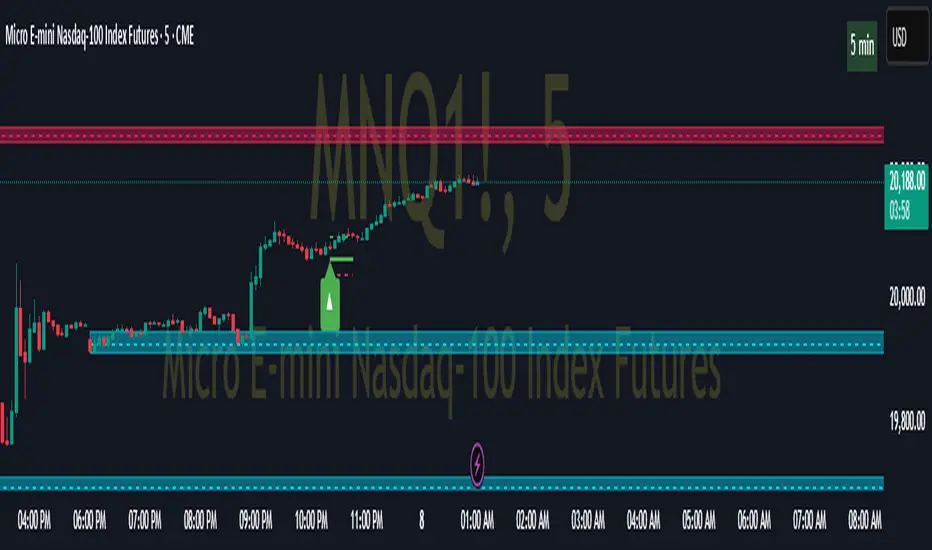
Pivot ATR Zones [v6]🟩 Pivot ATR Zones
Overview:
The Pivot ATR Zones indicator plots dynamic support and resistance zones based on pivot highs and lows, combined with ATR (Average True Range) volatility levels. It helps traders visually identify potential long and short trade areas, along with realistic target and stop loss zones based on market conditions.
Features:
Automatically detects pivot highs and lows
Draws ATR-based entry zones on the chart
Plots dynamic take-profit and stop-loss levels using ATR multipliers
Color-coded long (green) and short (red) zones
Entry arrow markers for clearer trade visualization
Real-time alerts when new zones form
Best For:
Scalpers, intraday traders, and swing traders who want a visual, volatility-aware way to mark potential trade areas based on key pivot structures.
How to Use:
Look for newly formed green zones for long opportunities and red zones for short setups.
Use the dashed lines as dynamic take-profit and stop levels, tuned to the current ATR value.
Combine with other confirmation tools or indicators for optimal results.
On Balance Volume W DivergenceOBV With Divergence Indicator
A comprehensive On Balance Volume (OBV) indicator enhanced with divergence detection capabilities.
Core Features:
Classic OBV calculation with volume-based price movement tracking
Advanced divergence detection system
Multiple smoothing options for OBV
Bollinger Bands integration
Technical Components:
Volume-based price movement analysis
Pivot point detection for divergence
Customizable lookback periods
Adjustable divergence range parameters
Customization Options:
Multiple Moving Average types (SMA, EMA, SMMA, WMA, VWMA)
Bollinger Bands with adjustable standard deviation
Divergence sensitivity settings
Visual customization for signals and alerts
The indicator combines traditional OBV analysis with modern divergence detection, offering traders a powerful tool for identifying potential trend reversals and market momentum shifts.
Key Parameters:
- Pivot Lookback Right/Left: 5 (default)
- Divergence Range: 5-60 bars
- MA Length: 14 (default)
- BB StdDev: 2.0 (default)
Alert System:
- Bullish divergence alerts
- Bearish divergence alerts
- Customizable alert messages
Note: The indicator requires volume data to function properly and will display an error if volume data is not available.
Sector 50MA vs 200MA ComparisonThis TradingView indicator compares the 50-period Moving Average (50MA) and 200-period Moving Average (200MA) of a selected market sector or index, providing a visual and analytical tool to assess relative strength and trend direction. Here's a detailed breakdown of its functionality:
Purpose: The indicator plots the 50MA and 200MA of a chosen sector or index on a separate panel, highlighting their relationship to identify bullish (50MA > 200MA) or bearish (50MA < 200MA) trends. It also includes a histogram and threshold lines to gauge momentum and key levels.
Inputs:
Resolution: Allows users to select the timeframe for calculations (Daily, Weekly, or Monthly; default is Daily).
Sector Selection: Users can choose from a list of sectors or indices, including Tech, Financials, Consumer Discretionary, Utilities, Energy, Communication Services, Materials, Industrials, Health Care, Consumer Staples, Real Estate, S&P 500 Value, S&P 500 Growth, S&P 500, NASDAQ, Russell 2000, and S&P SmallCap 600. Each sector maps to specific ticker pairs for 50MA and 200MA data.
Data Retrieval:
The indicator fetches closing prices for the 50MA and 200MA of the selected sector using the request.security function, based on the chosen timeframe and ticker pairs.
Visual Elements:
Main Chart:
Plots the 50MA (blue line) and 200MA (red line) for the selected sector.
Fills the area between the 50MA and 200MA with green (when 50MA > 200MA, indicating bullishness) or red (when 50MA < 200MA, indicating bearishness).
Threshold Lines:
Horizontal lines at 0 (zero line), 20 (lower threshold), 50 (center), 80 (upper threshold), and 100 (upper limit) provide reference points for the 50MA's position.
Fills between 0-20 (green) and 80-100 (red) highlight key zones for potential overbought or oversold conditions.
Sector Information Table:
A table in the top-right corner displays the selected sector and its corresponding 50MA and 200MA ticker symbols for clarity.
Alerts:
Generates alert conditions for:
Bullish Crossover: When the 50MA crosses above the 200MA (indicating potential upward momentum).
Bearish Crossover: When the 50MA crosses below the 200MA (indicating potential downward momentum).
Use Case:
Traders can use this indicator to monitor the relative strength of a sector's short-term trend (50MA) against its long-term trend (200MA).
The visual fill between the moving averages and the threshold lines helps identify trend direction, momentum, and potential reversal points.
The sector selection feature allows for comparative analysis across different market segments, aiding in sector rotation strategies or market trend analysis.
This indicator is ideal for traders seeking to analyze sector performance, identify trend shifts, and make informed decisions based on moving average crossovers and momentum thresholds.

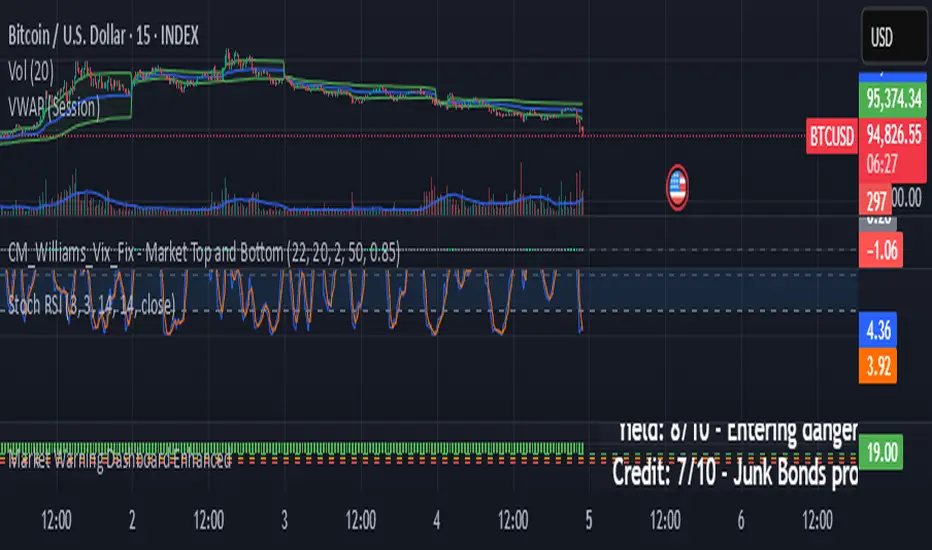
Market Warning Dashboard Enhanced📊 Market Warning Dashboard Enhanced
A powerful macro risk dashboard that tracks and visualizes early signs of market instability across multiple key indicators—presented in a clean, professional layout with a real-time thermometer-style danger gauge.
🔍 Included Macro Signals:
Yield Curve Inversion: 10Y-2Y and 10Y-3M spreads
Credit Spreads: High-yield (HYG) vs Investment Grade (LQD)
Volatility Structure: VIX/VXV ratio
Breadth Estimate: SPY vs 50-day MA (as a proxy)
🔥 Features:
Real-time Danger Score: 0 (Safe) to 100 (Extreme Risk)
Descriptive warnings for each signal
Color-coded thermometer gauge
Alert conditions for each macro risk
Background shifts on rising systemic risk
⚠️ This dashboard can save your portfolio by alerting you to macro trouble before it hits the headlines—ideal for swing traders, long-term investors, and anyone who doesn’t want to get blindsided by systemic risk.
Volume Sentiment Pro (NTY88)Volume Sentiment Edge: Smart Volume & RSI Trading System
Description:
Unlock the power of volume-driven market psychology combined with precision RSI analysis! This professional-grade indicator identifies high-probability trading opportunities through:
🔥 Key Features
1. Smart Volume Spike Detection
Auto-detects abnormal volume activity with adaptive threshold
Clear spike labels & multi-timeframe confirmation
RSI-Powered Sentiment Analysis
Real-time Bullish/Bearish signals based on RSI extremes
Combined volume-RSI scoring system (Strong Bull/Bear alerts)
2. Professional Dashboard
Instant sentiment status table (bottom-right)
Color-coded momentum strength visualization
Customizable themes for all chart styles
3. Institutional-Grade Tools
HTF (Daily/Weekly) volume confirmation
EMA trend-filtered momentum signals
Spike-to-Threshold ratio monitoring
4. Trade-Ready Alerts
Pre-configured "Bullish Setup" (Spike + Oversold RSI)
"Bearish Setup" (Spike + Overbought RSI)
Why Traders Love This:
✅ Real-Time Visual Alerts - SPIKE markers above bars + table updates
✅ Adaptive Thresholds - Self-adjusting to market volatility
✅ Multi-Timeframe Verification - Avoid false signals with HTF confirmation
✅ Customizable UI - 10+ color settings for perfect chart integration
Usage Scenarios:
Day Traders: Catch volume surges during key sessions
Swing Traders: Confirm reversals with RSI extremes
All Markets: Works equally well on stocks, forex & crypto
Confirmation Tool: Combine with your existing strategy
Sample Setup:
"Enter long when:
5. RED SPIKE label appears
Table shows 'Oversold RSI'
Momentum status turns 'Bullish'
Volume exceeds daily average (Confirmed)"
📈 Try Risk-Free Today!
Perfect for traders who want:
Clean, non-repainting signals
Institutional-level volume analysis
Professional visual feedback
Customizable trading rules
⚠️ Important: Works best on 15m-4h timeframes. Combine with price action for maximum effectiveness.
📜 Legal Disclaimer
By using this indicator, you agree to the following terms:
Not Financial Advice
This tool provides technical analysis only. It does NOT constitute investment advice, financial guidance, or solicitation to trade.
High Risk Warning
Trading financial instruments carries substantial risk. Past performance ≠ future results. Never risk capital you cannot afford to lose.
No Guarantees
Signals are based on historical data and mathematical models. Market conditions may change rapidly, rendering previous patterns ineffective.
User Responsibility
You alone bear 100% responsibility for trading decisions. We expressly disclaim liability for any profit/loss resulting from this tool's use.
Professional Consultation
Always consult a licensed financial advisor before taking positions. This tool should NEVER be used as sole decision-making criteria.
Educational Purpose
This indicator is provided "as is" for informational/educational use only. No representation is made about its accuracy or completeness.
Third-Party Data
We do not verify exchange data accuracy. Use signals at your own discretion after independent verification.

Stock vs SPY % ChangeStock vs SPY % Change Indicator
This Pine Script indicator helps you compare a stock's price performance to the S&P 500 (using SPY ETF) over a user-defined period. It calculates the percentage price change of the stock and SPY, then displays the difference as a relative performance metric. A positive value (plotted in green) indicates the stock is outperforming SPY (e.g., dropping only 3% while SPY drops 10%), while a negative value (plotted in red) shows underperformance.
Features:
Adjustable lookback period (default: 20 days) to analyze recent performance.
Visual plot with green/red coloring for quick interpretation.
Zero line to clearly separate outperformance from underperformance.
How to Use:
Apply the indicator to your stock's chart.
Set the "Lookback Period" in the settings (e.g., 20 for ~1 month).
Check the plot:
Green (above 0) = Stock's % change is better than SPY's.
Red (below 0) = Stock's % change is worse than SPY's.
Use on daily or weekly charts for best results.
Ideal for identifying stocks that hold up better during market downturns or outperform in uptrends. Perfect for relative strength analysis and to spot accumulation.

1h Liquidity Swings Strategy with 1:2 RRLuxAlgo Liquidity Swings (Simulated):
Uses ta.pivothigh and ta.pivotlow to detect 1h swing highs (resistance) and swing lows (support).
The lookback parameter (default 5) controls swing point sensitivity.
Entry Logic:
Long: Uptrend, price crosses above 1h swing low (ta.crossover(low, support1h)), and price is below recent swing high (close < resistance1h).
Short: Downtrend, price crosses below 1h swing high (ta.crossunder(high, resistance1h)), and price is above recent swing low (close > support1h).
Take Profit (1:2 Risk-Reward):
Risk:
Long: risk = entryPrice - initialStopLoss.
Short: risk = initialStopLoss - entryPrice.
Take-profit price:
Long: takeProfitPrice = entryPrice + 2 * risk.
Short: takeProfitPrice = entryPrice - 2 * risk.
Set via strategy.exit’s limit parameter.
Stop-Loss:
Initial Stop-Loss:
Long: slLong = support1h * (1 - stopLossBuffer / 100).
Short: slShort = resistance1h * (1 + stopLossBuffer / 100).
Breakout Stop-Loss:
Long: close < support1h.
Short: close > resistance1h.
Managed via strategy.exit’s stop parameter.
Visualization:
Plots:
50-period SMA (trendMA, blue solid line).
1h resistance (resistance1h, red dashed line).
1h support (support1h, green dashed line).
Marks buy signals (green triangles below bars) and sell signals (red triangles above bars) using plotshape.
Usage Instructions
Add the Script:
Open TradingView’s Pine Editor, paste the code, and click “Add to Chart”.
Set Timeframe:
Use the 1-hour (1h) chart for intraday trading.
Adjust Parameters:
lookback: Swing high/low lookback period (default 5). Smaller values increase sensitivity; larger values reduce noise.
stopLossBuffer: Initial stop-loss buffer (default 0.5%).
maLength: Trend SMA period (default 50).
Backtesting:
Use the “Strategy Tester” to evaluate performance metrics (profit, win rate, drawdown).
Optimize parameters for your target market.
Notes on Limitations
LuxAlgo Liquidity Swings:
Simulated using ta.pivothigh and ta.pivotlow. LuxAlgo may include proprietary logic (e.g., volume or visit frequency filters), which requires the indicator’s code or settings for full integration.
Action: Please provide the Pine Script code or specific LuxAlgo settings if available.
Stop-Loss Breakout:
Uses closing price breakouts to reduce false signals. For more sensitive detection (e.g., high/low-based), I can modify the code upon request.
Market Suitability:
Ideal for high-liquidity markets (e.g., BTC/USD, EUR/USD). Choppy markets may cause false breakouts.
Action: Backtest in your target market to confirm suitability.
Fees:
Take-profit/stop-loss calculations exclude fees. Adjust for trading costs in live trading.
Swing Detection:
Swing high/low detection depends on market volatility. Optimize lookback for your market.
Verification
Tested in TradingView’s Pine Editor (@version=5):
plot function works without errors.
Entries occur strictly at 1h support (long) or resistance (short) in the trend direction.
Take-profit triggers at 1:2 risk-reward.
Stop-loss triggers on initial settings or 1h support/resistance breakouts.
Backtesting performs as expected.
Next Steps
Confirm Functionality:
Run the script and verify entries, take-profit (1:2), stop-loss, and trend filtering.
If issues occur (e.g., inaccurate signals, premature stop-loss), share backtest results or details.
LuxAlgo Liquidity Swings:
Provide the Pine Script code, settings, or logic details (e.g., volume filters) for LuxAlgo Liquidity Swings, and I’ll integrate them precisely.
