Bull Momentum GaugeBull Momentum Gauge
The Bull Momentum Gauge is a powerful momentum oscillator designed to identify the underlying strength and sustainability of major market trends. Instead of trying to predict tops and bottoms, this indicator helps traders and investors ride long-term bull markets by signaling when momentum is building and when it is starting to fade.
What it Does
At its core, this tool measures how statistically "stretched" or "compressed" an asset's price is relative to its long-term (1-year) trend. It does this by:
Calculating the price's deviation from its 365-day moving average.
Normalizing this deviation into a Z-score to measure its statistical significance.
Comparing the inverted Z-score to its own 200-day moving average to gauge the momentum of the trend itself.
The result is a single, smooth line that oscillates around a zero value.
How to Use It
The signals are simple and based on the indicator's relationship to the zero line:
Green Line (Gauge below 0): This indicates that the price has been compressed relative to its long-term trend and is now showing signs of building upward momentum. A cross into the green zone can be interpreted as a potential entry signal for a new bull run.
Red Line (Gauge above 0): This suggests that the price has become over-extended or "stretched" and the upward momentum is beginning to weaken. A cross into the red zone can be used as a potential exit signal, indicating it may be time to take profits and wait for the next cycle.
This indicator is designed to work across multiple timeframes (Daily, Weekly, Monthly) and provides a clear, data-driven framework for navigating major market cycles.
Btctrade

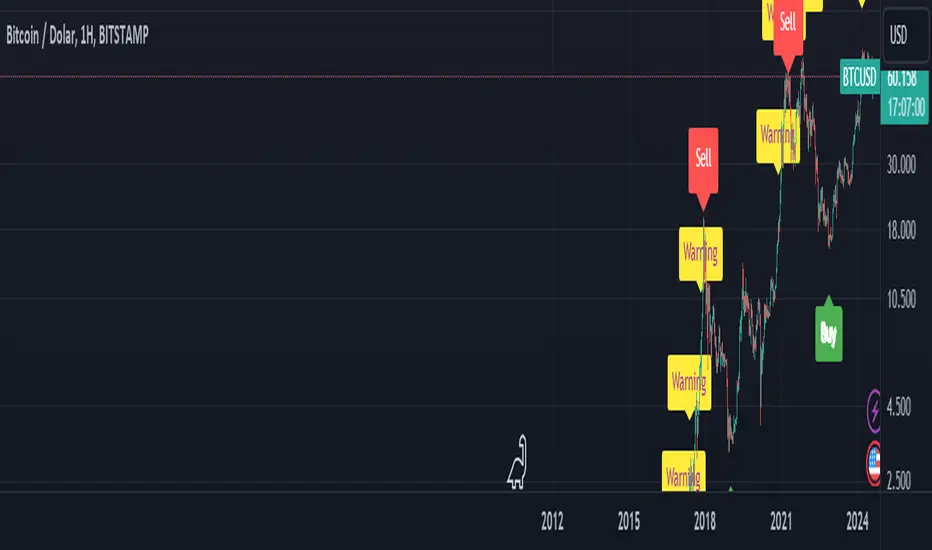
BTC Arcturus IndicatorBTC Arcturus Indicator: This indicator is designed to create buy and sell signals based on the market value of Bitcoin. It also predicts potential market tops with the Pi Cycle Top indicator.
How Does It Work?
1. MVRVZ (Market Value to Realized Value-Z Score) Calculation:
MC: Bitcoin's market cap (Market Cap) is pulled daily from Glassnode data.
MCR: Realized Market Cap of Bitcoin is taken daily from Coinmetrics data.
MVRVZ: It is calculated by dividing the difference between Bitcoin's market value and realized market value by one standard deviation. This value indicates whether the market is overvalued or undervalued.
2. Reception and Warning Signals:
Buy Signal: When MVRVZ falls below the -0.255 threshold value, the indicator gives a "Buy" signal. This indicates that Bitcoin is undervalued and may be a buying opportunity.
Warning Signal: A warning signal turns on when MVRVZ exceeds the threshold value of 2.765. This indicates that the market is approaching saturation and caution is warranted.
3. Tracking the Highest MVRVZ Value:
The indicator records the highest MVRVZ value in the last 10 candlesticks. This value is used to determine whether the market has reached its highest risk levels.
4. Warning Display:
If the MVRVZ value matches the highest value in the last 10 bars and this warning has not been displayed before, a "Warning" signal is displayed.
Once the warning signal is shown, no further warnings are shown for 10 candles.
5. Pi Cycle Top Indicator:
Pi Cycle Top: This indicator predicts Bitcoin tops by comparing two moving averages (350-day and 111-day). If the short-term moving average falls below the long-term moving average, this is considered a sell signal.
The indicator displays this signal with the label "Sell", indicating a potential market top.
User Guide:
Green Buy Signal: It means Bitcoin is cheap and offers a buying opportunity.
Yellow Warning Signal: Indicates that Bitcoin has reached possible profit taking points and caution should be exercised.
Red Sell Signal: Indicates that Bitcoin has reached market saturation and it may be appropriate to sell.
Simple EMA trend indicatorSimple EMA trend indicator , pretty straightforward green equates to bullish and usually a retest/wick is often seen , same for the flipside viceversa
