Scalper Pro Pattern Recognition & Price Action👑Scalper Pro®👑Pattern Recognition & Price Action
i.postimg.cc
Introducing the ultimate trading robot designed for serious investors! Our advanced bot analyzes market cycles, tracks targets, sets stop losses, and expertly manages your capital. With powerful algorithms and real-time insights, it identifies opportunities and delivers accurate signals, ensuring you never miss a market move. Take control of your trading strategy and maximize your profits with our cutting-edge technology. Join the future of trading today—your expert assistant is ready to help you succeed!
💡 This is not just another indicator — it's a complete trading assistant that identifies structure, signals strength, and simplifies decision-making.
🚀 Plug it into your TradingView chart today and start seeing the market in a whole new way.
💬 Need help with access, backtesting, or have any questions about our indicators?
Our support team is available 24/7 on Telegram.
Just reach out through the link below: 👉 t.me
Candlestick analysis

GOD Scalper TURBO Pattern Recognition & Price Action🚀 Introducing: 👑Scalper TURBO👑 – Your Ultimate TradingView Companion for High-Speed Scalping & Auto-Trading!
Trade Smarter. Trade Faster. Trade Automated.
The world's fastest scalper robot with the ability to analyze and trade in second-by-second time frames with an incredible 900% monthly profitability.
🔥 What is 👑Scalper TURBO👑?
Scalper TURBO is a high-performance Pine Script 5 strategy designed for aggressive and intelligent scalping on TradingView. It combines breakout detection, multi-indicator confirmation, time-based filtering, and full PineConnector integration for automated live trading with MetaTrader 5 (MT5). Whether you want to backtest, trade manually, or connect with MT5 via PineConnector – this tool is your edge.
⚙️ Key Features
✅ Fast Execution Logic — Uses real-time tick data with calc_on_every_tick=true
✅ EMA, SMA, RSI & ATR Filters — Combines trend, momentum, and volatility in one strategy
✅ Breakout Strategy — Trades breakouts above resistance or below support
✅ Multi-Time Filter Zones — 4 customizable intraday trading windows to avoid choppy hours
✅ PineConnector-Ready — Seamless alerts for auto-trading with MT5, customizable lot sizes
✅ Dynamic Stop Loss / Take Profit — Based on ATR multipliers for adaptable risk
✅ Trail Stop Support — Optional trailing stop-loss system
✅ Built-in Risk Labels — Live performance and signal info right on the chart
✅ Minimal Resource Usage — Pre-computed constants and cached indicators for speed
✅ Recommended Use Cases:
XAUUSD / Gold scalping (default)
1m to 5m charts (for high-frequency setups)
Live auto-trading via PineConnector
Backtesting and optimization with historical data
🧠 Pro Tips
For best results, run it during high-volume market hours (enable time filters like London/NY session).
Use trailing stop in volatile assets for maximizing gains.
Integrate with PineConnector Pro for seamless MT5 execution.
Combine with your own overlays or confirmation tools.
📣 Join the Movement
💬 Created by @DrFXAi – follow on TradingView for updates, improvements, and more elite scripts.
🚀 Ready to Automate Your Edge?
📌 Add 👑Scalper TURBO👑 to your chart today and take control of your scalping game with automation, speed, and intelligence!
💬 Need help with access, backtesting, or have any questions about our indicators?
Our support team is available 24/7 on Telegram.
Just reach out through the link below: 👉 t.me

Neural Network Buy and Sell SignalsTrend Architect Suite Lite - Neural Network Buy and Sell Signals
Advanced AI-Powered Signal Scoring
This indicator provides neural network market analysis on buy and sell signals designed for scalpers and day traders who use 30s to 5m charts. Signals are generated based on an ATR system and then filtered and scored using an advanced AI-driven system.
Features
Neural Network Signal Engine
5-Layer Deep Learning analysis combining market structure, momentum, and market state detection
AI-based Letter Grade Scoring (A+ through F) for instant signal quality assessment
Normalized Input Processing with Z-score standardization and outlier clipping
Real-time Signal Evaluation using 5 market dimensions
Advanced Candle Types
Standard Candlesticks - Raw price action
Heikin Ashi - Trend smoothing and noise reduction
Linear Regression - Mathematical trend visualization
Independent Signal vs Display - Calculate signals on one type, display another
Key Settings
Signal Configuration
- Signal Trigger Sensitivity (Default: 1.7) - Controls signal frequency vs quality
- Stop Loss ATR Multiplier (Default: 1.5) - Risk management sizing
- Signal Candle Type (Default: Candlesticks) - Data source for signal calculations
- Display Candle Type (Default: Linear Regression) - Visual candle display
Display Options
- Signal Distance (Default: 1.35 ATR) - Label positioning from price
- Label Size (Default: Medium) - Optimal readability
Trading Applications
Scalping
- Fast pace signal detection with quality filtering
- ATR-based stop management prevents signal overlap
- Neural network attempts to reduces false signals in choppy markets
Day Trading
- Multi-timeframe compatible with adaptation settings
- Clear trend visualization with Linear Regression candles
- Support/resistance integration for better entries/exits
Signal Filtering
- Use A+/A grades for highest probability setups
- B grades for confirmation in trending markets
- C-F grades help identify market uncertainty
Why Choose Trend Architect Lite?
No Lag - Real-time neural network processing
No Repainting - Signals appear and stay fixed
Clean Charts - Focus on price action, not indicators
Smart Filtering - AI reduces noise and false signals
Flexible and customizable - Works across all timeframes and instruments
Compatibility
- All Timeframes - 1m to Monthly charts
- All Instruments - Forex, Crypto, Stocks, Futures, Indices
Risk Disclaimer
This indicator is a tool for technical analysis and should not be used as the sole basis for trading decisions. Past performance does not guarantee future results. Always use proper risk management and never risk more than you can afford to lose.

High Volume Small Body Finder What This Script Does:
Highlights candles where:
Body is small compared to the full candle range
Volume is much higher than the recent average
Use this on any chart (crypto, stocks, forex) to spot absorption, indecision, or potential reversal points.

Scalping Strategy2//version=6
strategy("DOGE/USDT 5X Scalping Strategy", overlay=true, margin_long=20, margin_short=0)
// === Core Parameters ===
fastEMA = input.int(5, "Fast EMA Length", minval=1, maxval=20)
slowEMA = input.int(12, "Slow EMA Length", minval=2, maxval=50)
trendEMA = input.int(55, "Trend EMA Length", minval=10, maxval=200)
atrPeriod = input.int(14, "ATR Period", minval=1, maxval=50)
tradeInterval = input.int(72, "Minutes Between Trades", minval=1, maxval=1440)
// Risk Management
slMultiplier = input.float(1.5, "Stop-Loss (ATR Multiple)", minval=0.5, maxval=5.0, step=0.1)
tpMultiplier = input.float(1.2, "Take-Profit (ATR Multiple)", minval=0.5, maxval=10.0, step=0.1)
riskPct = input.float(1.0, "Risk Per Trade (%)", minval=0.1, maxval=10.0, step=0.1)
leverage = 5.0 // Fixed 5x leverage
// === Calculate Indicators ===
fastLine = ta.ema(close, fastEMA)
slowLine = ta.ema(close, slowEMA)
trendLine = ta.ema(close, trendEMA)
atrValue = ta.atr(atrPeriod)
rsiValue = ta.rsi(close, 14)
// === Visualize Indicators ===
plot(fastLine, "Fast EMA", color=#2196F3, linewidth=2)
plot(slowLine, "Slow EMA", color=#FF9800, linewidth=2)
plot(trendLine, "Trend EMA", color=#757575, linewidth=1)
// Cross detection for visualization
crossUp = ta.crossover(fastLine, slowLine)
crossDown = ta.crossunder(fastLine, slowLine)
plotshape(crossUp, "EMA Cross Up", style=shape.triangleup, location=location.belowbar, color=color.green, size=size.small)
plotshape(crossDown, "EMA Cross Down", style=shape.triangledown, location=location.abovebar, color=color.red, size=size.small)
// === Trade Logic ===
var int lastTradeBarIndex = 0
timeElapsed = (bar_index - lastTradeBarIndex) >= tradeInterval
noActivePosition = strategy.position_size == 0
// Enhanced Entry Conditions - 80%+ win rate optimizations
emaCross = ta.crossover(fastLine, slowLine)
trendFilter = close > trendLine
priceStrength = close > open and close > close // Strong bullish momentum
rsiFilter = rsiValue > 40 and rsiValue < 68 // Avoid overbought conditions
validEntry = emaCross and trendFilter and timeElapsed and noActivePosition and priceStrength and rsiFilter
// Position sizing calculation
equity = strategy.equity
riskAmount = equity * (riskPct / 100)
stopDistance = atrValue * slMultiplier
positionSize = math.round((riskAmount / stopDistance) * leverage)
// === Strategy Execution ===
if (validEntry)
strategy.entry("Long", strategy.long, qty=positionSize)
stopPrice = close - (atrValue * slMultiplier)
targetPrice = close + (atrValue * tpMultiplier)
strategy.exit("Exit", "Long", stop=stopPrice, limit=targetPrice)
lastTradeBarIndex := bar_index
line.new(bar_index, stopPrice, bar_index+20, stopPrice, color=color.red, width=1)
line.new(bar_index, targetPrice, bar_index+20, targetPrice, color=color.green, width=1)
// Early Exit Logic
inTrade = strategy.position_size > 0
if (inTrade and rsiValue > 75) // Take profit early if RSI gets too high
strategy.close("Long", comment="RSI Exit")

Gracias mi Dios Sammy IndicadorNASDAQ:QQQ //@version=5
indicator("Gracias mi Dios Sammy Indicador", overlay=true, max_labels_count=500)
// Cálculo de condiciones de velas
isBullish = close > open
isBearish = close < open
prevBullish = close > open
prevBearish = close < open
// Patrón Alcista (A): vela verde envuelve completamente a la roja previa
bullishEngulfing = isBullish and prevBearish and close > open and open < close
// Patrón Bajista (B): vela roja envuelve completamente a la verde previa
bearishEngulfing = isBearish and prevBullish and close < open and open > close
// Marcar con “A” (alcista) y “B” (bajista)
plotshape(bullishEngulfing, title="Alcista", style=shape.labelup, color=color.green, text="A", size=size.tiny, location=location.belowbar, textcolor=color.white)
plotshape(bearishEngulfing, title="Bajista", style=shape.labeldown, color=color.red, text="B", size=size.tiny, location=location.abovebar, textcolor=color.white)
// Alertas
alertcondition(bullishEngulfing, title="Alerta Alcista", message="Patrón Alcista (A) detectado")
alertcondition(bearishEngulfing, title="Alerta Bajista", message="Patrón Bajista (B) detectado")

BTC 1m Chop Top/Bottom Reversal (Stable Entries)Strategy Description: BTC 5m Chop Top/Bottom Reversal (Stable Entries)
This strategy is engineered to capture precise reversal points during Bitcoin’s choppy or sideways price action on the 5-minute timeframe. It identifies short-term tops and bottoms using a confluence of volatility bands, momentum indicators, and price structure, optimized for high-probability scalping and intraday reversals.
Core Logic:
Volatility Filter: Uses an EMA with ATR bands to define overextended price zones.
Momentum Divergence: Confirms reversals using RSI and MACD histogram shifts.
Price Action Filter: Requires candle confirmation in the direction of the trade.
Locked Signal Logic: Prevents repaints and disappearing trades by confirming signals only once per bar.
Trade Parameters:
Short Entry: Above upper band + overbought RSI + weakening MACD + bearish candle
Long Entry: Below lower band + oversold RSI + strengthening MACD + bullish candle
Take Profit: ±0.75%
Stop Loss: ±0.4%
This setup is tuned for traders using tight risk control and leverage, where execution precision and minimal drawdown tolerance are critical.

Kairi Trend Oscillator [T3][T69]📌 Overview
The Kairi Trend Oscillator is a Japanese-inspired hybrid oscillator combining Heikin-Ashi trend clarity with the Kairi (乖離率) indicator — a measure of price deviation from a moving average. This dual-layer system gives you both trend direction and trend strength/health, designed to highlight trend maturity and avoid overextended entries.
✨ Features
Heikin-Ashi or normal candlestick input modes
Multiple moving average options: SMA, EMA, DEMA, VWMA, and Kijun
Visual color-coded trend zones: overbought, oversold, healthy, weak, and reversal conditions
Full Kairi column plot with dynamic coloring
Adaptive logic for trend detection (linear regression or Heikin-Ashi structure)
Built-in reversal detection based on divergence between Kairi and trend direction
⚙️ How to Use
Choose Candle Type: Select Heiken Ashi or Normal Candlesticks via the Candle Mode dropdown.
Select Source: Choose open, high, low, or close as the input for Kairi computation.
Set MA Type & Length: Configure the moving average mode and its length under Moving Average Settings.
Interpret the Plot:
Green/Red bars: Show Kairi oscillator values above/below 0
Background color: Shows current trend (green = uptrend, red = downtrend)
Candle color overlays:
🟩 Teal = Overextended Bulls
🟥 Maroon = Overextended Bears
✅ Green = Healthy Uptrend
🔻 Red = Healthy Downtrend
🟨 Light tones = Weak trends
🔄 Blue/Fuchsia = Possible reversal detected
🔧 Configuration
Inputs:
Candle Mode: Heiken Ashi or Normal Candle Sticks
Source: Open, High, Low, Close
MA Mode: SMA, EMA, DEMA, VWMA, or Kijun
MA Length: Default is 29
🧪 Advanced Tips
Use Heikin-Ashi mode for better trend smoothing.
Kairi divergence (e.g., bullish Kairi in a downtrend) may signal upcoming reversal — watch for blue or fuchsia bars.
Combine with momentum indicators (e.g. RSI or MACD) for confluence-based setups.
For mean reversion strategies, fade extreme Kairi readings (> ±5%).
⚠️ Limitations
Not suited for ranging markets without trend.
Kairi extremes may remain elevated in strong trends — avoid early counter-trend entries.
Reversal logic is not a confirmation signal; use with caution.
📌 Disclaimer
This script is educational and illustrative. Always backtest thoroughly before using in live markets.

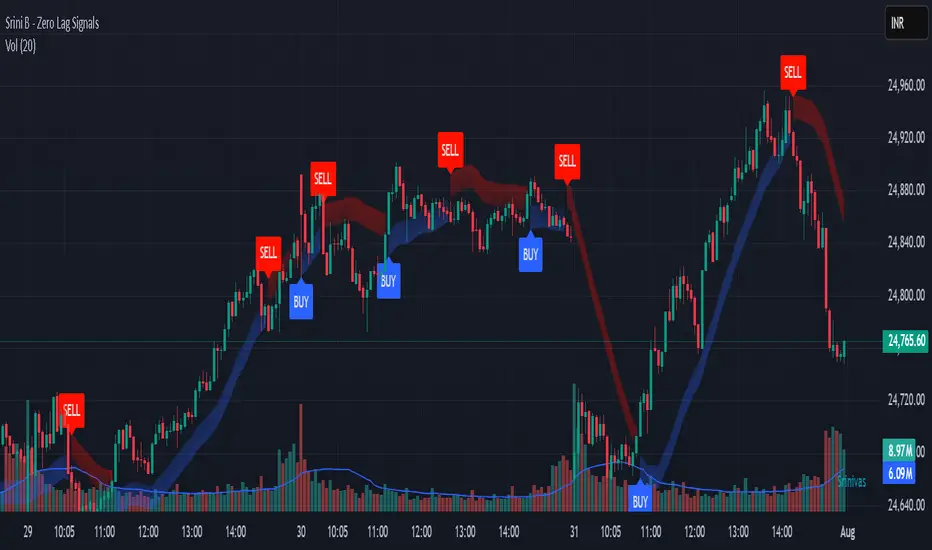
Srini B - Zero Lag Trend SignalsFinal version with minor changes. This indicator displays buy & sell alerts as per settings defined and comes out really well. Just my own personal indicator for own use.
Wx2 Treasure Box – Enter like Institutional Wx2 Treasure Box – Enter like Institutional
✅ Green Treasure Box- Institutional Entry Logic
The core entry signal is based on institutional price action—detecting strong bullish or bearish momentum using custom volume and candle structure logic, revealing when smart money steps into the market.
✅ Orange Treasure Box – Missed Move Entry
Missed the main entry (Green Treasure Box- Institutional Entry Logic)?
Don't worry—this strategy intelligently marks late entry opportunities using the Orange Treasure Box, allowing you to catch high-probability trades even after the initial impulse.
• Designed for retracement-based entries
• Still offers favorable RRR (Risk-Reward Ratio)
• Ideal for traders who miss the first trigger
Note: If you miss the main move, you can enter via the Orange Treasure Box after the market confirms continuation.
🔍 Core Logic
• Identifies Institutional Entry with Institutional Bars (IBs) based on wide-body candles with high momentum
• Detects ideal entry zones where Triggers a Green / Orange Treasure Box for high-probability entries
🎯 Entry Rules
• Buy / Long entry
Plan : Above the Treasure Box (green / orange Box) and bullish candle appears
• Sell /Short entry
Plan : Below the Treasure Box (green / orange Box) and bearish candle appears
• Enter1: (2Lot Size)
Entry with 2 lots: Above Treasure Box (Green / Orange)
• Risk-to-Reward Ratio (RRR):
Target RRR of 1:2 is recommended
Stop Entries are placed using stop orders slightly above / below the Treasure Box
🎯 Add-On Entry on First Pullback
(Optional for Beginners / Compulsory for experienced)
After the first entry, the strategy allows one intelligent add-on position on the first valid pullback, defined by a color change candle followed by a continuation of the trend.
• Detects pullbacks dynamically
• Add-on only triggers once per original entry
• Improves position sizing with trend continuation
💰 Exit Strategy
o TP1 : 1:2
Exit 50% of position (1.5Lot)
Trail SL to entry
o TP2 : 1:3
50% of Remaining Quantity (0.75Lot)
Remaining 25% is trailed
Trailing Stop Loss (SL) using:
8 SMA trailing OR
Bar-by-Bar logic
(whichever is tighter, ensuring maximum profit protection without sacrificing momentum.)
✅ Use Cases
⚙ Best For:
• Scalpers and intraday traders
• Traders who follow Smart Money Concepts (SMC)
• Anyone looking to automate structured trade management
• Works well on crypto, stocks, indices, Forex.
• Works well on any time frame


4-Bar Fractal ReversalTitle: 4-Bar Fractal Reversal
Description:
The "4-Bar Fractal Reversal" is a clean and effective tool for identifying potential market reversals based on pure price action logic.
📈 How It Works:
This indicator scans for a 4-bar fractal pattern where the current candle (bar 0) acts as the confirmation bar. A reversal signal is generated when:
Bullish Reversal (Buy): The current close is higher than both the high of 1 bar back and the high of 3 bars back.
Bearish Reversal (Sell): The current close is lower than both the low of 1 bar back and the low of 3 bars back.
⚙️ Features:
Works on any timeframe.
Customizable display: choose to show or hide symbols and/or labels.
Includes alerts for both bullish and bearish setups.
This tool allows traders to react only after confirmation, reducing false signals and providing a more disciplined approach to reversal trading.
Indicator born following the viewing of the following video.
www.youtube.com

H1/L1 Trap MarkerH1 L1 Trap Marker based on Al Brooks PA
You can use it to detect trap traders and help determine your trade.

Invencible MACD Strategy Scalping 5MInvencible MACD Strategy Scalping 5M
The Invencible MACD Strategy is a precision scalping system designed for short-term traders who want to capture fast and effective entries on trending moves.
This strategy uses a multi-timeframe MACD combined with a histogram impulse filter, ATR-based volatility filter, and optional EMA200 trend confirmation to identify high-probability trade setups.
Entry Conditions:
Long Entry: When MACD crosses above Signal Line, histogram rises with sufficient impulse, ATR confirms volatility, and price is above EMA200 (optional).
Short Entry : When MACD crosses below Signal Line, histogram falls with sufficient impulse, ATR confirms volatility, and price is below EMA200 (optional).
Exit Conditions:
Take Profit and Stop Loss are calculated as fixed percentages.
A position is also closed immediately if MACD reverses and crosses in the opposite direction.
The strategy does not use trailing stops, allowing trades to fully reach their target when conditions are favorable.
Recommended use:
This strategy is optimized for 5-minute charts and works particularly well with:
XAUUSD (Gold)
BTCUSD (Bitcoin)
If you find this strategy helpful, please share it, leave a comment, and drop a like. Scalpers, give it a try and let us know how it works for you.
Los 7 Capitales

Midnight OpenMidnight Opening Price because there wasn't a single indicator that was specifically marking this.

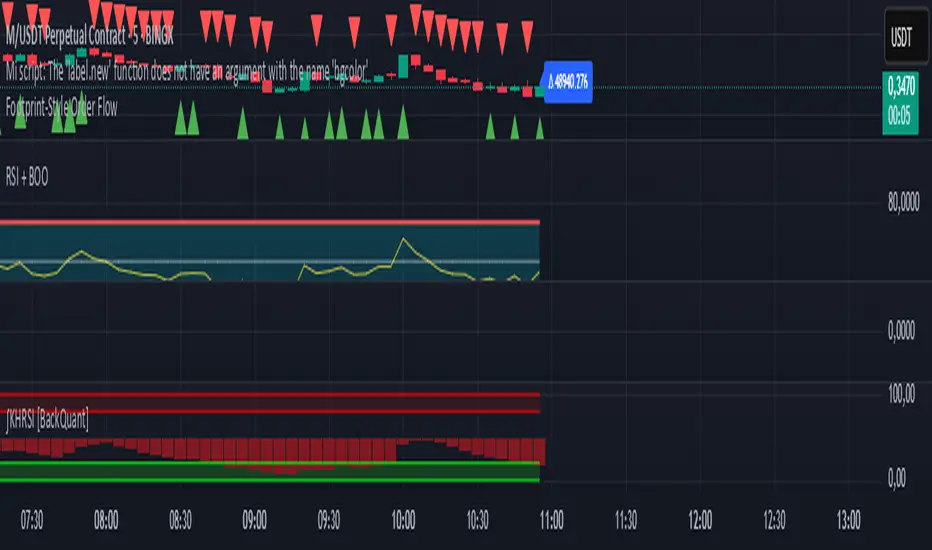
Footprint-Style Order Flow by Kalibea📊 Indicator: "Footprint-Style Order Flow by Kalibea"
Simplified Order Flow Analysis for TradingView
This indicator was created by Kalibea to bring you the power of Order Flow analysis in a clear, practical way—without technical complexity and fully compatible with TradingView.
While TradingView doesn’t support traditional footprint charts, this tool simulates institutional market reading using a smart calculation of estimated volume delta, helping you make more informed trading decisions.
🔍 What does this indicator do?
Estimated Delta: Calculates the difference between buying and selling pressure per candle, based on price movement and volume.
Smart Visual Signals:
🔼 Green Triangle: Potential buy entry (buyer dominance).
🔽 Red Triangle: Potential sell entry (seller dominance).
Delta Histogram: Displays whether each candle was driven more by buyers or sellers.
Live Labels: Shows real-time delta values above each candle for quick interpretation.
🧠 How does it help your trading?
Detects real-time market imbalances (who's in control: buyers or sellers).
Improves entry and exit timing, especially on lower timeframes.
Helps you confirm other strategies such as supply/demand zones, support/resistance, or candlestick patterns.
Provides an institutional-style reading simplified for use within TradingView.
⚙️ Fully Customizable to Your Style
Adjust the delta sensitivity to suit any market: Forex, Crypto, Indices, and more.
Turn on/off visual signals and histogram as needed.
🔑 Recommended by Kalibea for:
✅ Intraday traders and scalpers
✅ Traders looking to take the next step into institutional-style analysis
✅ Those seeking precise entries without overcomplicating their charts
💬 “Order Flow is the market’s internal voice. This indicator helps you hear it—no expensive footprint software required.”
— Kalibea
✅ BACKTEST: UT Bot + RSIRSI levels widened (60/40) — more signals.
Removed ATR volatility filter (to let trades fire).
Added inputs for TP and SL using ATR — fully dynamic.
Cleaned up conditions to ensure alignment with market structure.

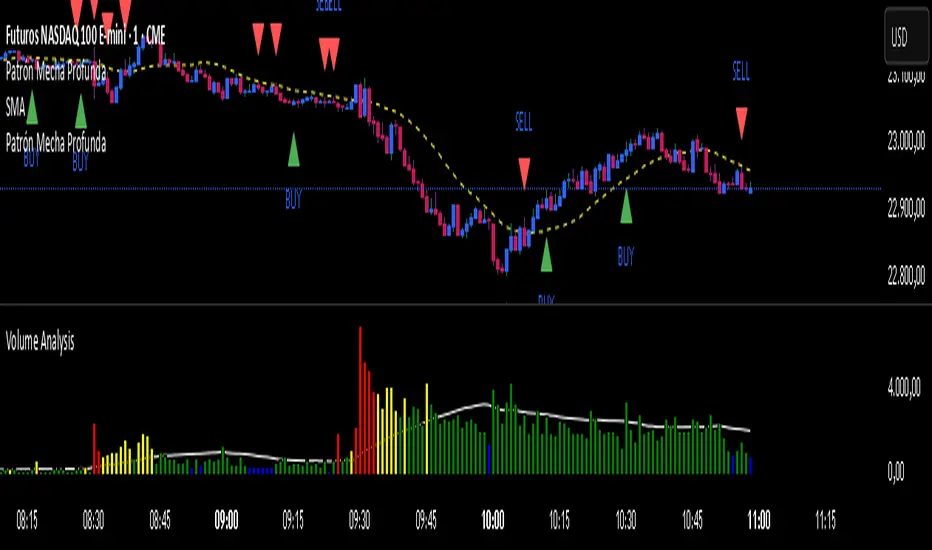
Patrón Mecha ProfundaThis pattern must be combined with a 20-period moving average. It is used to know the direction of the price. When the pattern appears and the price is above the 20-period moving average, it is a bullish signal and vice versa.
MOC Delta MOO Entry
This model is a momentum-based futures strategy that uses the buy/sell delta during the MOC window (3:50–3:59 EST) to determine market sentiment. If the MOC delta exceeds a customizable percentage of total daily volume, a trade is triggered at the next day’s 9:30 open, but only if the price opens above or below the 15 and 30 SMAs (for long or short entries, respectively). All trades are exited at 3:50 PM EST on the same day.

XAUUSD & BTCUSD Buy/Sell Signals (80% Accuracy)this script gives approx 80% real and correct indicators depending on market

Lucas Scalia Maximums and minimums of the day, week, and month. Basically, it automatically marks and labels the highs and lows of the previous daily , weekly, and monthly candles. The labels can be added or removed at your discretion, leaving only the dotted lines.

Trend_Finder(Telegram-RR_Algo_Indicators_Intraday)EMA Inputs
It uses 6 EMAs with customizable lengths (defaults: 30, 35, 40, 45, 50, 60).
Trend Conditions
Bullish Trend: All EMAs are strictly ordered from smallest to largest, meaning short-term prices are leading long-term prices upward.
Bearish Trend: All EMAs are ordered from largest to smallest, meaning short-term prices are falling below long-term ones.
Neutral: EMAs are mixed and do not meet the above criteria.
Trend Tracking
The script remembers the current trend and only flips when a full trend reversal condition is confirmed.

Patrón Mecha Profunda
This pattern must be combined with a 20-period moving average. It is used to know the direction of the price. When the pattern appears and the price is above the 20-period moving average, it is a bullish signal and vice versa.
