MA8 Entry + Opposite Candle ExitCondition Action
Cross above MA → full candle above → Buy entry ✅
Cross below MA → full candle below → Sell entry ✅
In a Buy trade, and:
• A red engulfing candle appears, or
• Price closes below MA ❌ Exit Buy
In a Sell trade, and:
• A green engulfing candle appears, or
• Price closes above MA ❌ Exit Sell
Candlestick analysis

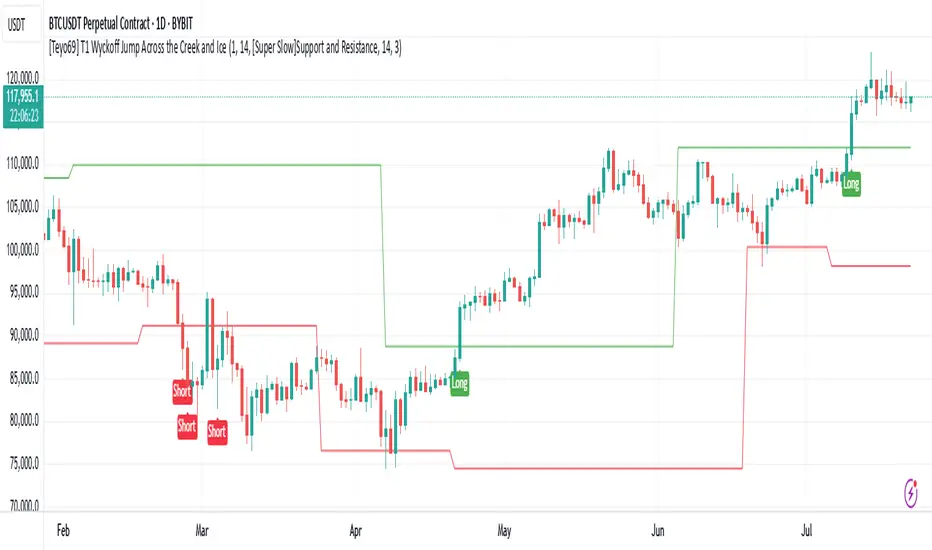
[Teyo69] T1 Wyckoff Jump Across the Creek and Ice📌 Overview
This indicator captures Wyckoff-style breakouts :
JAC (Jump Across the Creek) for bullish structure breakouts
JAI (Jump Across the Ice) for bearish breakdowns
It blends support/resistance logic, volume behavior, and slope/momentum from selected trend-following methods.
🧩 Features
Detects JAC (bullish breakout) and JAI (bearish breakdown) based on trend breakouts confirmed by volume.
Supports multiple trend logic modes:
📈 Super Trend
📉 EMA
🪨 Support & Resistance
📊 Linear Regression
Dynamically plots Creek (resistance) and Ice (support)
Incorporates volume spike and rising volume conditions for high-confidence signals
⚙️ How to Use
Select your preferred trend method from the dropdown.
Wait for:
A breakout in direction (up or down)
Rising volume and volume spike confirmation
Follow "Long" (JAC) or "Short" (JAI) labels for potential entries.
🎛️ Configuration
Indicator Leniency - Signal tolerance range after breakout
S&R Length - Pivot detection length for S/R method
Trend Method - Choose how trend is calculated
Volume SMA - Baseline for volume spike detection
Volume Length - Lookback for volume rising check
🧪 Signal Conditions
JAC Direction flips bullish + volume rising + spike
JAI Direction flips bearish + volume rising + spike
⚠️ Limitations
False signals possible during sideways/choppy markets.
Volume behavior depends on exchange feed accuracy.
S/R mode is slower but more stable; EMA & Linear Regression react faster but can whipsaw.
🔧 Advanced Tips
Use this with Wyckoff Accumulation/Distribution zones for better context.
Combine with RSI/OBV or higher timeframe trend filters.
Adjust leniency_lookback if signals feel too early/late.
If you're using Support and Resistance - Price action moves inside S & R it means that price is ranging.
📝 Notes
Volume conditions must confirm breakout, not just direction shift.
Built using native Pine Script switch and plotshape() for clarity.
"Creek" and "Ice" lines are color-coded trend / Support and Resistance zones.
DR OF ORB ( MEROOOO )this indicator marks the first 15 min candle of each session
if the market closed above the box go long with stop loss blow the box
and vice versa

Current and Prior Inside Bar ColoringDescription
This script colors bars that are inside the prior bar's high and low range. Inside is defined as ≤ the high, and ≥ the low of the prior bar. You can choose to color only the current inside bar or all inside bars on the chart.
Utility
This gives a quick visual indication of inside bars across your chart. Inside bars, by definition, indicate consolidation and non-trending price action. By highlighting both current and historical inside bars, you can quickly identify periods of market indecision and potential breakout zones. Seeing the frequency and clustering of inside bars helps assess overall market conditions.
Function
Colors distinguish if the close is above or below the opening price of each inside bar. You can set different colors for current vs prior inside bars to visually separate real-time signals from historical patterns. If you prefer no distinction, simply use the same colors for both. The "Color prior inside bars?" toggle allows you to show only the current inside bar or all inside bars on your chart.

SMA Strategy with Re-Entry Signal (v6 Style)*SMA Trend Strategy with Re-Entry Signal (v6 Edition)*
This indicator is based on a classic moving average trend-following system, enhanced with re-entry signals designed for medium to short-term traders.
---
### 📈 Key Features:
1. *Trend Detection Logic:*
- The 30-period SMA (SMA30) is used as the trend filter.
- When the closing price is above the SMA30, the market is considered to be in an uptrend.
2. *Re-Entry Signal:*
- While in an uptrend, if the closing price crosses above the SMA20, a re-entry (add position) signal is triggered.
- These signals are shown with green upward arrows below the bars.
3. *Background Highlighting:*
- Green background: indicates an uptrend.
- Red background: indicates a break below SMA30, suggesting weakening momentum.
4. *Multi-SMA Visualization:*
- Five SMAs are displayed: SMA10, SMA20, SMA30, SMA60, and SMA250.
- This helps visualize both short-term and long-term trend structures.
---
### 🔍 Usage Tips:
- Use this script directly on your main chart to monitor trend direction and wait for re-entry signals during pullbacks.
- Combine with other tools like volume, price action, or candlestick patterns to confirm entries.
---
### ⚠️ Disclaimer:
- This indicator is for educational and informational purposes only. It does not constitute financial advice or a buy/sell signal.
- Avoid relying solely on this script for trading decisions. Always manage your own risk.
---
👨💻 *Developer’s Note:*
This script is 100% manually developed, not copied or auto-generated. It is an original implementation based on my personal trading logic. Suggestions and feedback are welcome!

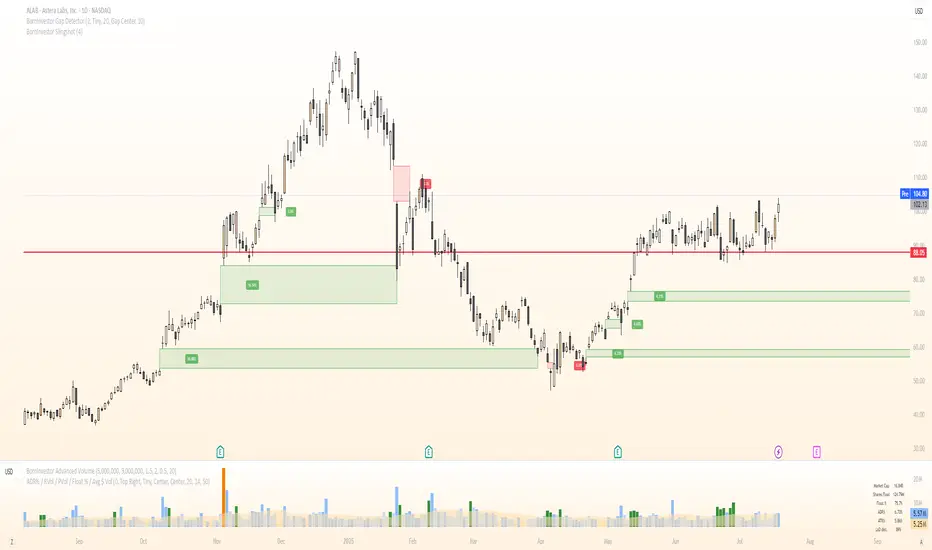
BornInvestor Gap Detector📈 BornInvestor Gap Detector
The BornInvestor Gap Detector is a powerful visual tool for identifying and analyzing price gaps on any chart. It automatically detects up and down gaps, highlights them with customizable boxes, and offers detailed labeling and alerting functionality.
🔍 Key Features:
Automatic Detection of bullish and bearish gaps based on customizable deviation settings.
Visual Highlighting of gaps using colored boxes with optional trail length limitation.
Gap Size Labels showing the percentage size of the gap, with the ability to display them only on the most recent N gaps.
Alerts for:
New gap appearance
Gap fully or partially closed
Price entering a gap zone (ideal for breakout/backfill strategies)
Customizable Colors for up/down gap borders and backgrounds.
Optional Message when no gaps are found on the current chart.
💡 Usefulness:
Gaps are an edge. They frequently act as support or resistance—especially on the first retest—when aligned with high-volume areas or other key price zones. Many strong stock moves begin with gaps, a concept central to strategies like Episodic Pivots.
This indicator helps you:
Identify gaps as potential entry zones on secondary setups
Quantify gaps via percentage size
Filter gaps based on size to suit your specific trading approach
Set alerts when price enters a gap or meets your custom criteria
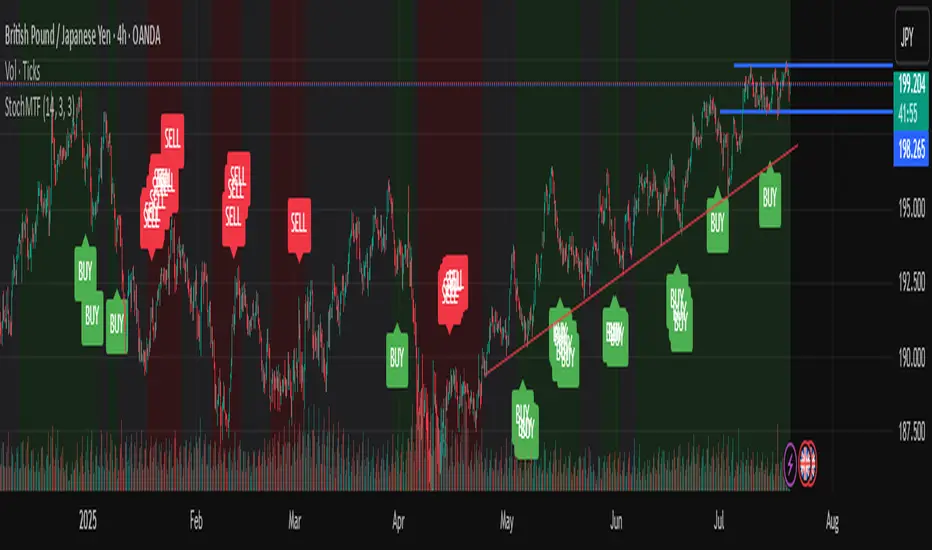
Stochastic Trend Signal with MTF FilterMulti-Timeframe Stochastic Trend Filter – Real Signals with Confirmation Candles
This script is a multi-timeframe Stochastic trend filter designed to help traders identify reliable BUY/SELL signals based on both momentum and higher-timeframe trend context.
It combines three key components:
Entry Signal Logic:
Entry is based on the Stochastic Oscillator (%K, 14,3), where overbought/oversold conditions are detected in the current chart's timeframe.
A green (bullish) candle following a red candle with %K below 20 can trigger a BUY signal.
A red (bearish) candle following a green candle with %K above 80 can trigger a SELL signal.
Trend Confirmation – Daily Filter:
The script uses Stochastic on the 1D (Daily) timeframe to determine whether short-term momentum aligns with a broader daily trend.
BUY signals are only allowed if the Daily %K is above 50.
SELL signals are only allowed if the Daily %K is below 50.
Long-Term Trend Filter – Weekly Stochastic:
A second filter uses Weekly %K:
BUY signals are suppressed if the Weekly trend is bearish (Weekly %K < 50) while Daily %K is bullish (> 50).
SELL signals are suppressed if the Weekly trend is bullish (Weekly %K > 50) while Daily %K is bearish (< 50).
🖼️ The chart background changes color to visually assist users:
Green background: bullish alignment on Daily and Weekly Stochastic.
Red background: bearish alignment.
Gray background: trend conflict (Daily and Weekly disagree).
✅ This script is ideal for swing traders or position traders who want to enter with confirmation while avoiding false signals during trend conflict zones.
🔔 Alerts are provided for BUY and SELL signals once all conditions are met.
How to use:
Apply on timeframe (4H recommended).
Add alerts for "BUY Alert" and "SELL Alert".
Use background color and plotted labels as entry filters.
Disclaimer: This is not financial advice. Always use proper risk management and test on demo accounts first.
[Teyo69] T1 Wyckoff Aggressive A/D Setup📘 Overview
The T1 Wyckoff Aggressive A/D Setup is a dual-mode indicator that detects bullish accumulations and bearish distributions using core principles from the Wyckoff Method. It identifies price/volume behavior during Selling/Buying Climaxes, ARs, SOS/SOW, and triggers based on trend structure.
🔍 Features
✅ Automatic detection of:
Automatic Rally (AR)
Automatic Reaction (AR)
Sign of Strength (SOS) or Sign of Weakness (SOW)
🧠 Trend-sensitive logic with linear regression slope filters
⚙️ Configurable options for Reversal vs Trend Following mode
🎯 Smart structure timing filters using barssince() logic
🔊 Volume spike and wide-range candle detection
📊 Visual cues for bullish (green) and bearish (red) backgrounds
🛠 How to Use
Reversal Mode
Triggers early signals after a Climax + AR
Ideal for catching turning points during consolidations
Trend Following Mode
Requires Climax, AR, and confirmation (SOS or SOW)
Waits for structure confirmation before signaling
Use this when you want higher probability trades
⚙️ Configuration
Volume MA Length - Determines baseline volume to detect spikes
Wick % of Candle - Filters candles with long tails for SC/BC
Close Near Threshold - Ensures candles close near high/low
Breakout Lookback - Sets structure breakout level
Structure Threshold - Controls timing window for setups
Signal Option - Switch between Reversal or Trend Following mode
⚠️ Limitations
Doesn't confirm macro structure like full Wyckoff phase labeling (A–E)
May repaint on lower timeframes during volatile candles
Works best when combined with visual range recognition and market context
🧠 Advanced Tips
Use in confluence with:
Volume Profile ranges
Trendlines and supply/demand areas
Ideal timeframes: 8H to 1D for crypto and forex markets
Combine this with LPS/UTAD patterns for refined entries
📝 Notes
SC/AR/SOS = Bullish
BC/AR/SOW = Bearish
Trend coloring adapts background (green = rising slope, red = falling slope)
🛡️ Disclaimer
This tool is a market structure guide, not financial advice. Past behavior does not guarantee future performance. Always use proper risk management.

Real-Time FTFC Dashboard (Styled)Full Time Frame Continuity. Real time change with the data presented. Can be used on all stocks to analyze if the stocks timeframe finished green or red.

Micro Trend Start Signal (Up & Down)Micro Trend Start Signal is a lightweight trend-following indicator , complimenting the binary mac d . Trend trading made simple

Micro Lion Trend Start Signal Micro Trend Start Signal is a lightweight trend-following indicator using EMA crossovers and RSI filters to catch early trend shifts. It shows clear Buy and Sell labels when momentum aligns with direction. Ideal for scalping or intraday trading. Clean, responsive, and designed for fast market entries.

Clean ATR LevelsSimple 14D ATR +1 & -1 display from PM to Close.
The Clean ATR Levels indicator is a powerful Pine Script tool designed to provide traders with dynamic support and resistance levels based on the Average True Range (ATR) calculation. This indicator automatically draws horizontal lines that represent key price levels where significant market reactions are likely to occur, helping traders identify potential entry and exit points throughout the trading session.
The core functionality centers around calculating ATR levels using the most recent daily close as the reference point. The script draws two primary levels: an upper level at +100% ATR above the current close and a lower level at -100% ATR below the current close. These levels represent statistically significant price zones where the market has historically shown increased volatility and potential reversal patterns. Additionally, the indicator includes an optional previous close line that serves as a psychological reference point for intraday price action.
What sets this indicator apart is its intelligent session management and clean visual presentation. The lines are automatically redrawn at the start of each new trading day and are programmed to extend precisely until 4 PM EST market close, eliminating visual clutter on the chart. This session-aware approach ensures that traders are always working with the most relevant levels for the current trading day without having outdated lines extending unnecessarily into future sessions.
The indicator also features a comprehensive information table that displays real-time values for the ATR calculation, current close price, and both upper and lower ATR levels. This provides traders with exact numerical references without having to manually calculate these critical values. The script is highly customizable, allowing users to adjust the ATR period, line colors, widths, and choose whether to display the previous close reference line, making it adaptable to various trading styles and visual preferences.

Multi-Indicator AI TableV10Multiple signal generator with table. Exclusive formularies make up the signals generated and shown in the table. Some are long term signals, and some are short term signals. "Ai Says" is a collaboration of all signals within the script. In the settings menu, you can eliminate the charting of any of the signals, but the table will always show the signals. The freshest signal is always the top signal in the indicator group. You know the newest signal by the number in the bar column. This can be used on Cryptocurrencies, Currencies, Stocks and Efts (and other investments). It is a tool and not trading advice. It is a guide to assist your trading decisions.

Daily Vertical LinesThe Vertical line to divide the day breaks with a dotted line.
This helps to identify the day end and start.
I find it most helpful while back testing.

Khalid SPX Indicator - Auto WeeklyKey Features:
Levels for publishing: We define three levels: low, mid, and high.
Alerts: The script checks for price crosses over the mid-level. Alerts are set up using alertcondition() so you can be notified when the price crosses these levels.
Background Color: The background changes color when the price crosses the mid-level to visually indicate the event.
How to use this script:
Apply the Script: Apply this indicator on TradingView.
Set Alerts: After applying the indicator, you can set up alerts in TradingView using the alertcondition that we defined in the script.
Click the Alert button on TradingView.
Choose the conditions for your alert (e.g., "Price Cross Up" or "Price Cross Down").
You can set up webhook notifications in the alert settings to "publish" the data elsewhere (e.g., send it to a server or API).
Publisher via Alerts:
Once the alert triggers, you can configure webhooks to send the alert data to an external server, allowing you to "publish" the data elsewhere.
In the alert creation window, enable the Webhook URL and provide the URL to which the data should be sent.

Sweep & Reclaim Indicator with Time, EMA & ATR FilterCandlestick structure scalping
With this model, you are looking for a sweep of a bearish candle, then that bullish candle closes back inside the range of the bearish candle and you buystop the reclaimed candles high. Vice versa for bearish. I like to use the candle low as stop targeting 1R or higher.
You also only want to take trades between 9:30-11:30AM EST, you want an ATR above 10, and a LTF EMA, I like the 10. Those are all attached as filters with this indicator.

Breakout of fractals with alternating signals📌 Indicator Name: Break of Fractal Body (with Alternating Signals and Extended Lines)
🔍 Purpose:
This indicator detects swing highs and lows (fractals) based on candle body closes, not wicks. It then:
Confirms a breakout when the price closes beyond the body of the fractal.
Alternates signals: a "long" signal only appears after a "short", and vice versa.
Draws a horizontal line from the original fractal bar (where it formed) to the current bar where the breakout happens.
⚙️ Key Features:
✅ Fractals Based on Candle Bodies Only:
A top fractal is where the candle body is higher than len candles on both sides.
A bottom fractal is where the candle body is lower than len candles on both sides.
✅ Breakout Confirmation:
A bullish breakout is when price closes above the last top body fractal.
A bearish breakout is when price closes below the last bottom body fractal.
Breakouts are only recognized if they alternate: you won’t get multiple long/shorts in a row.
✅ Visual Elements:
🔺 Red triangle: Top body fractal.
🔻 Green triangle: Bottom body fractal.
📈 Label BUY: when price breaks a top body fractal.
📉 Label SELL: when price breaks a bottom body fractal.
➖ Horizontal line: drawn from the fractal bar to the breakout bar, showing the exact level of breakout.
✅ Alerts:
Alert when a bullish breakout occurs.
Alert when a bearish breakout occurs.

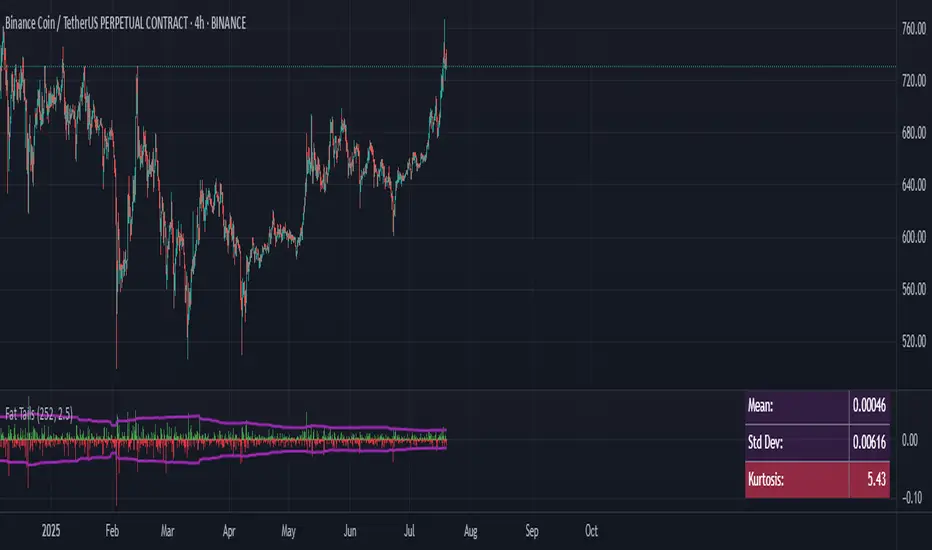
Fat Tails Analyzer🧠 Fat Tails Analyzer — Analysis of Anomalous ("Fat-Tailed") Movements
📌 Description
Fat Tails Analyzer is a tool for analyzing "fat tails" in the distribution of returns. Unlike normal distribution, financial markets often exhibit frequent extreme movements. This indicator identifies and visualizes such events by analyzing logarithmic returns, deviations from normal distribution, and excess kurtosis.
🔬 Methodology
Logarithmic returns (ln(Close / Close )) are calculated for accurate aggregation and symmetry.
Moving average and standard deviation of returns are computed over a specified period.
"Fat-tailed" events are identified when returns exceed μ ± k·σ, where k is user-defined.
Normal distribution bands (±2σ) and kurtosis (a measure of tail "heaviness") are displayed for clarity.
📊 What It Displays
📈 Histogram of Returns: Green for positive, red for negative.
🟣 Fat Tail Threshold Lines: Marking extreme events.
⚪ Silver Normal Distribution Bands: ±2σ boundaries.
🔵 Kurtosis Line: If enabled.
📋 Table with Key Metrics: Mean, σ, kurtosis.
⚙️ Parameters
Lookback Period (Bars): Analysis period (default: 252).
Fat Tail Threshold (Std Devs): Deviation for extreme events (k, default: 2.5).
Show Normal Distribution Bands: Toggle ±2σ boundaries.
Show Kurtosis: Enable kurtosis analysis mode.
📌 Interpretation
Excess Kurtosis > 0: More extreme events than predicted by normal distribution.
Returns beyond fat-tail thresholds: Potential signals of panic, shock, or exceptional news.
Consistently high kurtosis: Unstable or speculative asset.
🧪 Applications
📉 Identify extreme risks in assets (especially cryptocurrencies and derivatives).
🧠 Study market behavior and dispersion.
🛡 Support risk analysis, stop-loss settings, and systemic risk assessment.
🔎 Compare assets by the "normality" of their behavior.
🧭 Live Metrics Table
Displayed in the bottom-right corner:
Mean return
Standard deviation
Excess kurtosis (color-coded by value)
🧠 Good to Know
Normal distribution has kurtosis = 0.
> 0: "Fat tails" (more extreme values).
< 0: "Thin tails" (values close to the mean).
Volume Peak LineA fully configurable “Volume Peak Line” indicator that draws a horizontal threshold at the highest volume over the last X candles (default 5).
Custom lookback (X volume candles)
Optional alert when current volume exceeds that peak
Separate up/down volume bars (green/red) or hide them to use your own volume overlays
Use it to spot surges in trading activity on any timeframe—ideal for intraday or swing setups where a barn-burner volume bar can signal a reversal or the start of a new trend.
💧 USD Liquidity Index (Fed + M2 + Base)This custom indicator tracks USD liquidity by combining the Federal Reserve’s total assets (WALCL), M2 money supply (M2SL), and the monetary base (BASE) — all sourced from FRED (Federal Reserve Economic Data).
It's designed to provide a macro-level view of liquidity conditions in the U.S. financial system. This index can be used to help gauge the risk-on vs risk-off environment for assets like Bitcoin, equities, and commodities.
Higher values typically indicate liquidity expansion (bullish for risk assets).
Declining values indicate liquidity contraction or quantitative tightening (bearish for risk assets).
📊 Data Sources:
FRED:WALCL – Fed Balance Sheet
FRED:M2SL – M2 Money Supply
FRED:BASE – Monetary Base
⚠️ Weekly timeframe only. Designed for macro swing traders, crypto investors, and liquidity-driven strategists.

Candle Ghosts: MTF 3 Candle Viewer by Chaitu50cCandle Ghosts: MTF 3 Candle Viewer helps you see candles from other timeframes directly on your chart. It shows the last 3 candles from a selected timeframe as semi-transparent boxes, so you can compare different timeframes without switching charts.
You can choose to view candles from 30-minute, 1-hour, 4-hour, daily, or weekly timeframes. The candles are drawn with their full open, high, low, and close values, including the wicks, so you get a clear view of their actual shape and size.
The indicator lets you adjust the position of the candles using horizontal and vertical offset settings. You can also control the spacing between the candles for better visibility.
An optional EMA (Exponential Moving Average) from the selected timeframe is also included to help you understand the overall trend direction.
This tool is useful for:
Intraday traders who want to see higher timeframe candles for better decisions
Swing traders checking lower timeframe setups
Anyone doing top-down analysis using multiple timeframes on a single chart
This is a simple and visual way to study how candles from different timeframes behave together in one place.

Previous Candle High/Low (Clean)✅ Creates one horizontal line for the previous candle’s high (green).
✅ Creates one horizontal line for the previous candle’s low (red).
✅ The lines update on each new candle, always following the most recent previous high/low.
✅ The lines are extended to the right — they don’t stack or clutter the chart.
✅ Works on all timeframes.

Volume-Based Candle ShadingThe Volume Shading indicator dynamically adjusts the color brightness of each price bar based on relative volume levels. It helps traders quickly identify whether a candle formed on low, average, or high volume without needing to reference a separate volume pane.
Candles are shaded dynamically as they form, so you can watch volume flow into them in real time. This indicator is designed to be as minimally intrusive as possible, allowing you to visualize volume levels without extra clutter on your charts.
The additional volume indicator in the preview above is there just for a point of reference to allow you to see how the shading on the bars correlates to the volume.
⸻
SETTINGS:
Bullish and bearish base colors — These serve as the midpoint (average volume) for shading.
Brightness mapping direction — Optionally invert the shading so that either high volume appears darker or lighter.
Volume smoothing length — Defines how many bars are averaged to determine what constitutes “normal” volume.
Candles with volume above average will appear darker or lighter depending on user preference, while those with average volume will be painted the chosen colors, giving an intuitive gradient that enhances volume awareness directly on the chart.
⸻
USES:
Confirming price action: Highlight when breakout candles or reversal bars occur with high relative volume, strengthening signal conviction.
Spotting low-volume moves: Identify candles that lack volume support, potentially signaling weak continuation or false breakouts.
Enhancing visual analysis: Overlay volume dynamics directly onto price bars, reducing screen clutter and aiding faster decision-making.
Custom visual workflows: Adapt the visual behavior of candles to your trading style by choosing color direction and base tones.
