Perfect MA Touch – Full Setup 1,3,5,7,8,9This indicator helps you track a precise candle countdown from a moving average touch, labeling key bars (1, 3, 5, 7, 8, 9) for timing entries and momentum setups — with optional coloring, alerts, and full customization.
What It Detects
1. MA Touch Trigger
The sequence starts when any selected moving average (up to 6 MAs, customizable) is touched by the candle's high/low range.
This "perfect touch" initiates the count and labels that candle as "1".
2. Candle Number Labels
After a perfect MA touch:
Candle 1 = the bar that touches the MA
Candle 3 = two bars after Candle 1
Candle 5 = the fifth bar after the touch
Candle 7 = third bar after Candle 5
Candle 8 = fourth bar after Candle 5
Candle 9 = fifth bar after Candle 5
It creates a time-based sequence you can use to anticipate reactions or momentum shifts.
3. Customization
You can:
Choose between EMA or SMA for each MA (6 total)
Set custom lengths for each MA (9, 20, 50, 100, 150, 200)
Choose which candle numbers (1, 3, 5, 7, 8, 9) to highlight
Pick font size and label color
4. Highlighting and Alerts
Highlight candles (with color) when certain bars (like 3, 5, 7) print
Alerts are available for all tracked bars (1, 3, 5, 7, 8, 9)
Use Case Example
Let’s say you want to enter trades on the 3rd candle after a perfect MA touch:
You set the script to highlight candle 3.
When a candle hits your chosen MA (say EMA 9), it’s labeled “1”.
Two bars later, bar 3 appears — giving you a timed signal to enter if price behavior aligns.
This method is especially useful when paired with:
Volume confirmation
Breakout or reversal patterns
Support/resistance or order block zones
Candlestick analysis

타지마할 밴드⚠️ Disclaimer: For Informational Purposes Only – Use at Your Own Risk
The indicators and tools provided in this script are intended solely for educational and informational purposes. They are not financial advice, investment recommendations, or guarantees of any kind. While technical indicators can be helpful in identifying trends or potential entry/exit points, they are inherently limited, subject to interpretation, and should never be relied upon as the sole basis for making trading decisions.
Market conditions are dynamic and influenced by numerous unpredictable factors. Past performance, patterns, or signals generated by indicators do not guarantee future results. No indicator can account for fundamental news events, market manipulation, or sudden price volatility.
You are solely responsible for any decisions you make based on the use of this script. Trading involves substantial risk and may not be suitable for every investor. Always conduct your own research, consult with a qualified financial advisor, and understand your personal risk tolerance before entering any trade.
Use this tool at your own discretion and always trade responsibly.

Dynamic Fibonacci Retracement with ConfirmationDynamic Fibonacci Retracement with Confirmation plus MFI CCI RSI MA MACD Candle stick pattern

cd_secret_candlestick_patterns_CxHi traders,
With this indicator, we aim to uncover secret candlestick formations that even advanced traders may miss—especially those that can't be detected by classic pattern indicators, unless you're a true master of candlestick patterns or candle math.
________________________________________
General Idea:
We'll try to identify candlestick patterns by regrouping candles into custom-sized segments that you define.
You might ask: “Why do I need this? I can just look at different timeframes and spot the structure anyway.” But it’s not the same.
For example, if you're using a 1-minute chart and add a higher-timeframe candle overlay (like 5-minute), the candles you see start at fixed timestamps like 0, 5, 10, etc.
However, in this indicator, we redraw new candles by grouping them from the current candle backward in batches of five.
These candles won't match the standard view—only when aligned with exact time multiples (e.g., 0 and 5 minutes) will they look the same.
In classic charts:
• You see 5-minute candles that begin every 0 and 5 minutes.
In this tool:
• You see a continuously updating set of 5 merged 1-minute candles redrawn every minute.
What about the structures forming in between those fixed timeframes?
That’s exactly what we’ll be able to detect—while also making the lower timeframe chart more readable.
________________________________________
Candle Merging:
Let’s continue with an example.
Assume we choose to merge 5 candles. Then the new candle will be formed using:
open = open
close = close
high = math.max(high , high , high , high , high)
low = math.min(low , low , low , low , low)
This logic continues backward on the chart, creating merged candles in groups of 5.
Since the selected patterns are made up of 3, 4, or 5 candles, we redraw 5 such merged candles to analyze.
________________________________________
Which Patterns Are Included?
A total of 18 bullish and bearish patterns are included.
You’ll find both widely known formations and a few personal ones I use, marked as (MeReT).
You can find the pattern list and visual reference here:
________________________________________
Entry and Filtering Suggestions:
Let me say this clearly:
Entering a trade every time a pattern forms will not make you profitable in the long run.
You need a clear trade plan and should only act when you can answer questions like:
• Where did the pattern appear?
• When and under what conditions?
It’s more effective to trade in the direction of the trend and look for setups around support/resistance, supply/demand zones, key levels, or areas confirmed by other indicators.
Whether you enter immediately after the pattern or wait for a retest is a personal choice—but risk management is non-negotiable.
One of the optional filters I’ve included is a Higher Timeframe (HTF) condition, which is my personal preference:
When enabled, the highest or lowest price among the pattern candles must match the high or low of the current HTF candle.
You can see in the image below the decrease in the number of detected patterns on the 1-minute chart when using no filter (blue labels) compared to when the 1-hour timeframe filter is applied (red labels).
Additionally, I’ve added a “protected” condition for engulfing patterns to help filter out weak classic engulf patterns.
________________________________________
Settings:
From the menu, you can configure:
• Number of candles for regrouping
• Distance between the last candle and newly drawn candles
• Show/hide options
• HTF filter toggle and timeframe selection
• Color, label placement, and text customization
• Pattern list (select which to display or trigger alerts for)
My preferred setup:
While trading on the 1-minute chart, I typically set the higher timeframe to 15m or 1H, and switch the candle count between 2 and 3 depending on the situation.
⚠️ Important note:
The “Show” and “Alert” options are controlled by a single command.
Alerts are automatically created for any pattern you choose to display.
________________________________________
What’s Next?
In future updates, I plan to add:
• Pattern success rate statistics
• Multi-broker confirmation for pattern validation
Lastly, keep in mind:
The more candles a pattern is based on, the more reliable it may be.
I'd love to hear your feedback and suggestions.
Cheerful trading! 🕊️📈

Rahul The Bosshi i made this indicator for education purpose and in this indicator you can compare between
us market and nifty index
thank you keep learning

SW Zapier Volume Indicator testTracks volume are creates alerts. Sends info to zapier through webhooks.

TFT - Volume Pressure CandlesThis indicator colors candles on your chart to show when there's strong buying or selling pressure backed by volume.
It calculates an underlying "Volume Pressure" value by comparing buy/sell volume.
By default, when the pressure value rises above +25, it turns candles blue (suggesting strong buying). When it drops below -25, candles turn yellow (suggesting strong selling).
This indicator will help spot potential momentum shifts quickly and help you know if its a good trending market with directional volume pressuring the trend to continue.
You can change this value to any + or - you wish to adjust the volume pressure sensitivity.
This indicator should be used with additional indicators and not used as a stand alone indicator to determine buying or selling opportunities.

ETF / Index Optimized Buy/Sell🎯 Optimized for Large Cap Stocks:
Large caps are:
Trend-driven but stable
Influenced by institutional volume
Require momentum + confirmation filters to avoid chop
✅ Features Included:
Non-repainting EMA crossover
RSI + MACD filter
Optional volume confirmation
200 EMA trend direction
Stop Loss / Take Profit plotting
Buy/Sell labels
Real-time alert triggers

Large Cap Optimized Buy/Sell✅ Features Included:
Non-repainting EMA crossover
RSI + MACD filter
Optional volume confirmation
200 EMA trend direction
Stop Loss / Take Profit plotting
Buy/Sell labels
Real-time alert triggers
📊 How to Use:
Use on AAPL, NVDA, MSFT, TSLA, AMZN, GOOG
Best Timeframe 5m – 30m intraday / 1h swing
Best Sessions Regular market hours (9:30–4 ET)
Optional Add-ons VWAP, anchored support lines

Intraday Buy/Sell for Low Caps📈 Performance Tips:
Best for 1min – 15min timeframes on volatile low-cap tickers.
Use alongside VWAP or Support/Resistance zones for filtering chop.
Consider adding trend filters (e.g., 200 EMA) if too many false signals.

Mid-Cap Intraday Buy/Sell Signals🧠 Strategy Insights for Mid-Cap Intraday:
Setting Recommendation
⏱ Timeframes 5min, 10min, or 15min
🧲 Use Cases Mid-cap tech, industrials, healthcare
⚠ Avoid Very low volume days or premarket
📊 Combine With Anchored VWAP, Trendlines, Heatmap


Opening Range BoxOpening Range plots the price range of the first candle from a selected timeframe within a defined trading session. It highlights key intraday levels and visually extends that range across the session, helping traders spot breakout or reversal setups.

Reversão Sobrevenda/Sobrecompra com ExaustãoPrice Touches/Exceeds Lower Bollinger Band: Indicates oversold conditions.
Oversold RSI and/or Divergence: RSI below 30 (strong) or bullish divergence (price makes lower low, RSI makes higher low).
Decreasing Volume: Selling volume decreases as price hits the lower band and RSI becomes oversold, suggesting selling pressure is ending.
Bullish Reversal Candlestick: Formation of a bullish reversal candlestick pattern near the lower band (e.g., Hammer, Bullish Engulfing, Piercing Pattern).
Sell Signal (Bearish Reversal):
Price Touches/Exceeds Upper Bollinger Band: Indicates overbought conditions.
Overbought RSI and/or Divergence: RSI above 70 (strong) or bearish divergence (price makes higher high, RSI makes lower high).
Decreasing Volume: Buying volume decreases as the price reaches the upper band and the RSI becomes overbought, suggesting that buying pressure is ending.
Bearish Reversal Candlestick: Formation of a bearish reversal candlestick pattern near the upper band (Ex: Shooting Star, Bearish Engulfing, Dark Cloud).

Magic Candle by (PDH - PDL) ÷ Date with Dashboardmagic candle by dev sir take pdh or low and take next date

Last Candle RangeCalculates the size of the last candle on whatever timeframe you are watching (high - low)

Enhanced Market Structure (Advanced)We are beta testing a ICT script that 100% does all of the price action analysis for you. We are excited to show case this as it has taking us over a YEAR to fully code and do what we want. THIS IS THE MARKET STRUCTURE VARIATION!

TradeX Labs Price Action (FREE Variation)We are beta testing a ICT script that 100% does all of the price action analysis for you. We are excited to show case this as it has taking us over a YEAR to fully code and do what we want. THIS IS THE FREE VERSION.

TradeX Labs Price Action (FULL VARIATION)We are beta testing a ICT script that 100% does all of the price action analysis for you. We are excited to show case this as it has taking us over a YEAR to fully code and do what we want.

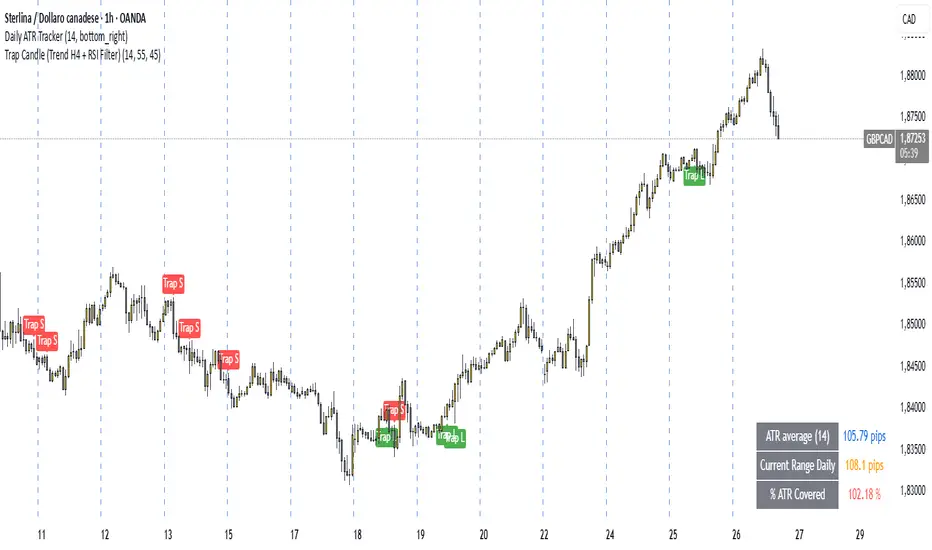
Trap Candle (Trend H4 + RSI Filter)🔍 Trap Candle (Trend H4 + RSI Filter)
Description:
The Trap Candle indicator is designed to identify a specific and powerful two-candle price action pattern that often signals a false breakout followed by a strong reversal. It combines pure price action with two objective filters to increase signal quality and trend alignment.
📊 Pattern Logic:
Bullish Trap: The current candle breaks the previous candle’s low, but closes above its high (and is bullish).
Bearish Trap: The current candle breaks the previous candle’s high, but closes below its low (and is bearish).
This pattern often reveals institutional traps or stop hunts before directional movement.
🧠 Trend Filter (H4):
Ensures long signals occur only when the H4 close is higher than the previous H4 close (uptrend).
Ensures short signals occur only in a H4 downtrend.
Designed to align intraday entries (M15, H1) with higher timeframe momentum.
💪 RSI Confirmation:
Includes a configurable RSI filter on the current timeframe.
Only long signals are shown when RSI is above a user-defined threshold (e.g. 55).
Only short signals are shown when RSI is below a user-defined threshold (e.g. 45).
⚙️ Key Features:
Full customization of RSI period and thresholds.
Clean, visual signal plotting on the chart (with “Trap L” or “Trap S” labels).
Built-in alerts for both long and short trap candle setups.
Perfect for traders who want to trade smart reversals with trend and momentum confirmation.
✅ Recommended Timeframes:
M15 and H1 (entry)
Uses H4 for trend bias
If you’re looking to filter out noise and spot only the highest quality reversal setups, the Trap Candle (Trend H4 + RSI Filter) is a solid tool for any price action-based strategy.
TuxAlgo - Liquidity Reversal ZonesTuxAlgo - Liquidity Reversal Zones is a highly refined tool that helps you identify high-probability reversal zones and liquidity sweeps in real-time.
Whether you're trading Gold, Forex, Crypto, or Indices, this indicator pinpoints the true intention of price around key liquidity areas, helping you react before the crowd.
How It Works:
Bearish Reversal Signal (Red Dot)
Appears when price sweeps liquidity and shows signs of exhaustion from the upside.
Bullish Reversal Signal (Green Dot)
Appears when price taps into buy-side liquidity and begins a reversal.
Sell-side Liquidity Zones (Red Lines)
Price is likely to reject from these zones. Ideal for short entries or TP zones.
Buy-side Liquidity Zones (Green Lines)
Price is likely to bounce from these zones. Ideal for long entries or TP zones.

First Candle🕯️ First Candle Indicator (First 5-Minute Candle High/Low)
The First Candle indicator automatically marks the high and low of the first 5-minute candle of the U.S. trading session . These levels can act as key intraday support and resistance zones, often used in breakout, scalping, or opening-range trading strategies.
📌 Key Features:
Automatic detection of the first candle of the U.S. session based on the selected timeframe (default is 5 minutes).
Horizontal lines are plotted at the high and low of that candle, with fully customizable colors and thickness.
Labels show the exact level and timeframe used for the high and low.
Resets daily, removing previous session data at the start of a new session.
Displays a visual marker (blue triangle) when the first candle is detected.
Allows users to select different timeframes for defining the "first candle" (e.g., 1, 5, 15 minutes).
⚙️ Customizable Inputs:
Show First Candle Lines: toggle the display of high/low lines.
Timeframe for Marking: choose the timeframe to detect the first candle (e.g., 5 minutes).
High Line Color / Low Line Color: set the color of each level line.
Line Thickness: adjust the width of the lines (1 to 5 pixels).
🧠 Strategic Applications:
Identify breakout zones right after the market opens.
Define opening range for pullback or continuation setups.
Set clear reference levels for intraday trading decisions.

