combo EMAS Session [Indexprofx]🧠 Description:
This indicator highlights the New York and London trading sessions directly on the chart, offering a clear visual reference for intraday trading.
It is a complementary tool designed to work seamlessly with our main system: Intraday Signal.
✔️ Displays the most active market hours.
✔️ Enhances precision in entry and exit decisions.
✔️ Perfect for XAUUSD (Gold) traders and other high-volatility instruments.
🧠 Description:
This indicator plots three key Exponential Moving Averages (EMAs) to help traders identify market trends and potential entry/exit points with precision:
EMA 8 (Green) – Fast trend, useful for scalping or short-term signals
EMA 50 (Blue) – Mid-term trend filter
EMA 150 (Red) – Long-term bias and trend direction
It is part of the IndexProFX toolkit and integrates smoothly with other tools like Intraday Signal and Session Zones for enhanced confluence trading.
✔️ Clean structure
✔️ Easy-to-read color-coded EMAs
✔️ Supports scalping, day trading, and swing trading strategies
Candlestick analysis

X Opens+Overview:
The X Opens+ indicator is a precision tool designed for traders seeking to analyze market structure and behavior around key timeframe opens. It highlights the open prices of custom-selected higher timeframes—such as daily, weekly, or monthly sessions—and visualizes them directly on lower timeframes. These open levels often coincide with high-volume zones, market imbalance, and institutional interest, making them powerful reference points for intraday and swing trading strategies.
Key Features:
Custom Timeframe Anchoring: Users can select any timeframe (e.g., daily, 4H, 1W) to display its current and previous session opens directly on their active chart. This allows for flexible multi-timeframe analysis within a single view.
Price Reaction Zones: Timeframe opens are frequently areas of heightened liquidity and directional bias. By identifying these opens and their relationship to current price action, traders can anticipate areas of support/resistance, trend continuation, or reversal.
Derived Midpoints and Ranges: The indicator also computes and displays the previous session’s range midpoint (EQ), as well as extension bands (e.g., ±1.0x or ±1.5x the prior range). These levels are useful for contextualizing volatility expansion and identifying breakout or fade setups around key open zones.
Historical Session Mapping: In addition to live opens, the tool optionally displays opens and range-based levels from previous sessions. This historical layering gives traders a broader context of how price has respected or rejected these levels over time.
Labeling and Customization: Each level can be labeled and color-coded to match user preferences. The visibility, size, and style of each element (e.g., lines, labels, bands) are fully configurable for visual clarity and user alignment.
Use Cases:
Confirming bias around daily or weekly opens, especially during market opens or key economic releases.
Identifying equilibrium levels for mean reversion or continuation setups.
Using ±1.0 and ±1.5 range projections as dynamic targets or invalidation zones.
Anchoring to key sessions for volume profile or order flow-based strategies.
Summary:
X Opens+ is a data-driven utility that transforms static session opens into dynamic market tools. By spotlighting where institutional interest likely concentrates—at the opens of significant timeframes—this indicator provides traders with a structural edge in identifying key zones that influence price behavior throughout the trading day or week

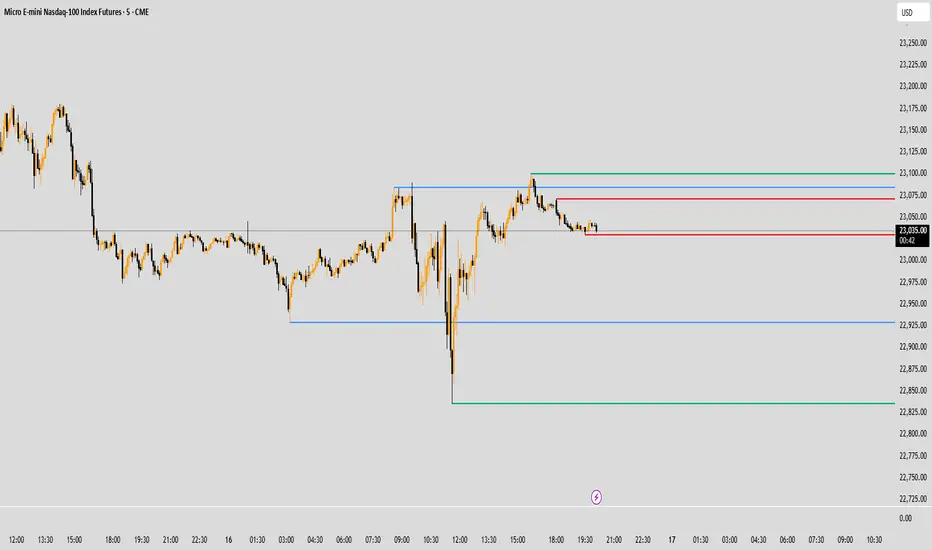
Previous Levels Clustered (PDH/PDL/PWH/PWL/PMH/PML)This indicator helps traders visualize key previous price levels by automatically plotting:
PDH – Previous Day High
PDL – Previous Day Low
PWH – Previous Week High
PWL – Previous Week Low
PMH – Previous Month High
PML – Previous Month Low
Each level is:
Marked from the exact candle where it occurred
Drawn with a short horizontal line extending to the right
Labeled clearly for quick recognition (PDH, PWL, etc.)
Updated only once per new session/week/month to reduce chart clutter
⚙️ Features:
Toggle visibility of each level type (PD / PW / PM)
Customize rightward offset for label placement
No repetition — only current valid levels are shown
50/100 EMA Crossover with Candle Confirmation📘 **50/100 EMA Crossover with Candle Confirmation – Strategy Description**
The **50/100 EMA Crossover with Candle Confirmation** is a trend-following strategy designed to filter high-probability entries by combining exponential moving average (EMA) crossovers with strong price action confirmation. This strategy aims to reduce false signals commonly associated with EMA-only systems by requiring a **candle close confirmation in the direction of the trend**, making it more reliable for intraday or swing trading across Forex, crypto, and stock markets.
---
### 🔍 **Core Logic**
* The strategy is based on the interaction of the **50 EMA** (fast-moving average) and the **100 EMA** (slow-moving average).
* **Trend direction** is determined by the crossover:
* **Bullish Trend**: When the 50 EMA crosses **above** the 100 EMA.
* **Bearish Trend**: When the 50 EMA crosses **below** the 100 EMA.
* To **filter out false breakouts**, a **candle confirmation** is used:
* For a **Buy signal**: After a bullish crossover, wait for a strong bullish candle (e.g., full-body green candle) to **close above both EMAs**.
* For a **Sell signal**: After a bearish crossover, wait for a strong bearish candle to **close below both EMAs**.
---
### ✅ **Entry Conditions**
**Buy Entry:**
* 50 EMA crosses above 100 EMA.
* Latest candle closes **above both EMAs**.
* Candle must be bullish (green/full body preferred).
**Sell Entry:**
* 50 EMA crosses below 100 EMA.
* Latest candle closes **below both EMAs**.
* Candle must be bearish (red/full body preferred).
---
### 🛑 **Exit or Take-Profit Options**
* **Fixed TP/SL**: 1:2 or 1:3 risk-reward.
* **Trailing Stop**: Based on recent swing highs/lows or ATR.
* **EMA Exit**: Exit trade when the candle closes on the opposite side of 50 EMA.
---
### ⚙️ **Best Settings**
* **Timeframes**: 5M, 15M, 1H, 4H (works well on most).
* **Markets**: Forex, Crypto (e.g., BTC/ETH), Indices (e.g., NASDAQ, NIFTY50).
* **Recommended filters**:
* Use with RSI divergence or volume confirmation.
* Avoid using during high-impact news (especially on lower timeframes).
---
### 🧠 **Why This Works**
The 50/100 EMA crossover provides a **medium-term trend signal**, reducing noise seen in fast EMAs (like 9 or 21). The candle confirmation adds a **momentum filter**, ensuring price supports the directional bias. This makes it suitable for traders who want a balance of trend and entry precision without overcomplicating with too many indicators.
---
### 📈 **Advantages**
* Simple yet effective for identifying trends.
* Filters out fakeouts using candle confirmation.
* Easy to automate in Pine Script or other trading bots.
* Can be combined with support/resistance or SMC zones for better confluence.
---
### ⚠️ **Limitations**
* May lag slightly in ranging markets.
* Late entries possible due to confirmation candle.
* Works best with additional volume or volatility filter.

Intraday buy sell stratergy for goldThe optimized Pine Script strategy titled "Intraday Buy Sell Strategy for Gold" is designed for intraday trading based on a combination of opening range breakout, Fibonacci pivot levels, EMA filtering, and time-specific signal candles. Here's a breakdown of its key components and improvements:

Dominant Volume DeltaThis indicator displays the volume delta (difference between buying and selling volume) for the dominant side only. If buyers dominate, a teal bar shows the strength of buying. If sellers dominate, a red bar shows the strength of selling. All values are positive and scaled to highlight aggressive pressure. Useful for spotting real-time market imbalances.


NMT Buy/Sell Alarm GPTBUY:
1. When the green arrow appears, it is time for you to consider other additional situations to place a buy order
2. And you set an alert so you don't miss the opportunity
SELL:
You observe the green label showing the % ratio between the order and the current price
You want to sell with how much profit % (relatively) then you sell.

IB Breakout Strategy with Fib, CVD, and DivergenceEntry rules and signals- I wait for the 5min IB(initial balance) to form every session for eg-(first 5min candle of london session or ny session, marking top wick to bottom wick of first 5 min candle with a midpoint in that zone.Then look for CVD(cumulative volume delta) if it's alining with my analysis.I also mark previous session fib levels for scalp entries on .618 or .78 level.Also i do mark previous day VAH(value area high),VAL(value area low) and POC(point of control) for better understanding of direction.
Initial stop loss and take profit values-Initial stop loss varies from 200$ to 500$ and take profit varies from 250$ to 500$.
Number of contracts you plan to trade based on system stats and risk management-I plan to trade 1-2 contracts until i reach the safety net.Once safety net is achieved based on my entry level i decide the contract size which varies from 1-4 contracts.
Trade management and any trailing stop methods-I trail the stop once i feel like there's enough room for the trade.I manage the trade on the basis of strength of a candle, if its taking much time without strength i exit the trade.

Keith's Volume with MAs and Breakout SignalsThis indicator highlights significant volume breakouts based on customizable moving averages.
A breakout signal appears only when:
Volume is higher than all three selected volume MAs (default 20, 50, 200).
The short-term MA is above the long-term MA.
Volume exceeds a customizable ratio threshold (default: 2× of MA50).
Designed for traders who want clean and reliable breakout alerts without unnecessary noise.
Works well for trend continuation and momentum confirmation.

Multi-Indicator Buy/Sell Signals (EMA, RSI, MACD)// This source code is subject to the terms of the Mozilla Public License 2.0
// mozilla.org
// © buy and sell signals gio1
//@version=5
indicator("Multi-Indicator Buy/Sell Signals (EMA, RSI, MACD)", overlay=true)
// --- Inputs for Moving Averages ---
fastMALen = input.int(10, title="Fast EMA Length", minval=1)
slowMALen = input.int(20, title="Slow EMA Length", minval=1)
// --- Inputs for RSI ---
rsiLength = input.int(14, title="RSI Length", minval=1)
rsiOB = input.int(70, title="RSI Overbought Level", minval=50, maxval=90)
rsiOS = input.int(30, title="RSI Oversold Level", minval=10, maxval=50)
// --- Inputs for MACD ---
macdFastLen = input.int(12, title="MACD Fast Length", minval=1)
macdSlowLen = input.int(26, title="MACD Slow Length", minval=1)
macdSigLen = input.int(9, title="MACD Signal Length", minval=1)
// --- Calculate Indicators ---
// EMA
fastMA = ta.ema(close, fastMALen)
slowMA = ta.ema(close, slowMALen)
// RSI
rsi = ta.rsi(close, rsiLength)
// MACD
= ta.macd(close, macdFastLen, macdSlowLen, macdSigLen)
// --- Define Buy and Sell Conditions ---
// EMA Crossover Condition
emaBuy = ta.crossover(fastMA, slowMA)
emaSell = ta.crossunder(fastMA, slowMA)
// RSI Condition
rsiBuy = rsi < rsiOS and rsi > rsiOS // Crossing up from oversold
rsiSell = rsi > rsiOB and rsi < rsiOB // Crossing down from overbought
// MACD Condition
macdBuy = ta.crossover(macdLine, signalLine)
macdSell = ta.crossunder(macdLine, signalLine)
// --- Combine Conditions for Final Signals ---
buySignal = emaBuy and rsiBuy and macdBuy
sellSignal = emaSell and rsiSell and macdSell
// --- Plot Signals on Chart ---
plotshape(buySignal, title="Buy Signal", location=location.belowbar, color=color.green, style=shape.triangleup, size=size.small)
plotshape(sellSignal, title="Sell Signal", location=location.abovebar, color=color.red, style=shape.triangledown, size=size.small)
// --- Add Alert Conditions ---
alertcondition(buySignal, title="Buy Alert", message="🔔 BUY signal triggered!")
alertcondition(sellSignal, title="Sell Alert", message="🔔 SELL signal triggered!")

PM + BOS + FVG Indicator & AlertsHey team it's Tanner, I have created Nitros strategy into a custom indicator, it's only the PM BOS FVG model, I will add a HOD/LOD BOS FVG custom indicator eventually, this indicator is setup to give you alerts as well. or if you just want a clean FVG indicator and or PM level indicator this works too. mess with the settings to your liking and DM me on circle or discord if you have feedback or questions, thanks team.

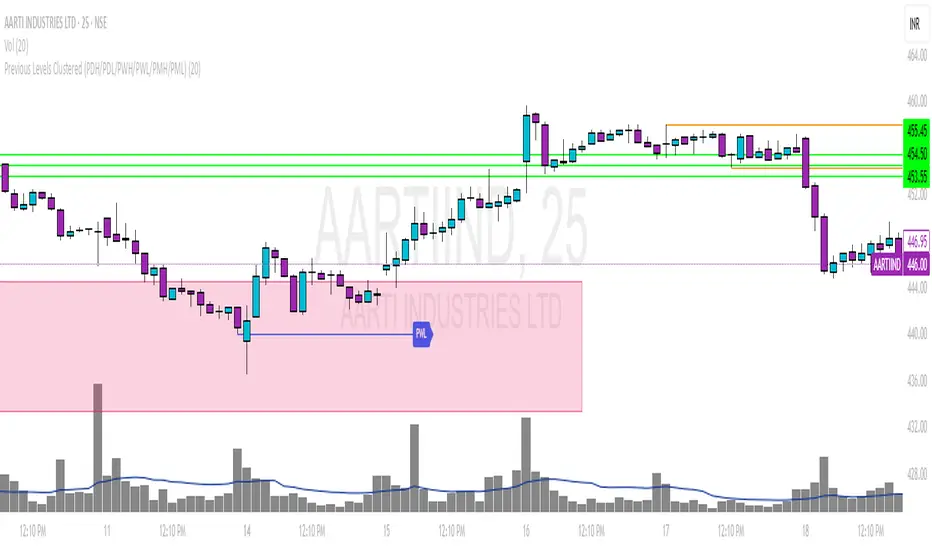
Vertical Lines at Specific NY Timesthese time zones indicates london session and new york session accumulation manipulation and distribution at than spesific time zones

HTF/LTF Boxes v2.2HTF/LTF boxes with GANN levels
added second LTF
Script is identifying hourly boxes and breakouts in respective quarters.
Two lower time frames are available, also gann levels of previous hour's range is available.

Heikin Ashi Trend Strategy (Beginner)FOR BEGINNERS
Perfect! Below is a custom Pine Script for TradingView that:
Uses Heikin Ashi candles
Shows buy/sell signals based on trend conditions:
3+ green/red Heikin Ashi candles
Price above/below 20 EMA
RSI filter for momentum

Oz SIGNAL PRO v6 is a powerful 15-minute trend-following indicator tailored for precision trading. It detects Break of Structure (BOS) and CHoCH signals with built-in volume confirmation and overlays premium/discount zones directly on the chart. The indicator includes:
🔹 Visual buy/sell labels at breakout points
🔸 Dynamic EMA and VWAP for trend filtering
🟩 Automatic support/resistance zones
🔔 Alert-ready for signal automation
Ideal for intraday traders seeking clean, high-confidence signals.
Upgrade-ready: Easily extend with FVGs, order blocks, liquidity sweeps & backtesting.

D15 Precision IndicatorD15 Precision Indicator
The D15 Precision Indicator is a high-accuracy intraday trading tool optimized for 15-minute charts. It identifies precise BUY and SELL signals only when all key conditions align:
✅ Price above/below EMA 21 & EMA 50
✅ Price above/below VWAP
✅ Price within predefined support/resistance zones
✅ Break of Structure (BOS) confirmed by pivot levels
✅ High-volume breakout candle
✅ Optional confirmation from previous candles for added precision
The script includes:
Clear visual arrows (BUY/SELL)
Dynamic background highlights for signals
Support/Resistance zone boxes
All key indicators plotted (EMA, VWAP, zones)
Ideal for disciplined traders aiming for 80%+ win rate through strict signal filtering and visual clarity.

3 Consecutive Same Color CandlesThis TradingView Pine Script detects when three consecutive candlesticks are either all bullish (green) or all bearish (red). It plots a triangle marker above or below the candle to visually signal the pattern and optionally triggers alerts.
How It Works:
A green signal (triangle up) appears below the third candle if the last 3 candles closed higher than they opened (bullish).
A red signal (triangle down) appears above the third candle if the last 3 candles closed lower than they opened (bearish).
Alerts can be set up to notify you immediately when the pattern forms.
Use Case on the 10-Minute Chart:
On the 10-minute chart, this script helps you spot short-term momentum buildups in either direction.
Bullish Signal (3 Green Candles):
Suggests buyers are gaining control.
Can be used to:
Enter breakout trades
Confirm trend continuation
Prepare for scalp entries or momentum trades
Bearish Signal (3 Red Candles):
Indicates sellers are applying pressure.
Can help:
Spot pullbacks or trend reversals
Set up for short positions
Warn of potential breakdowns
Example Trading Ideas:
Pair with EMA or support/resistance for confirmation.
Use as a momentum filter in scalping systems.
Combine with volume or RSI divergence to gauge strength or exhaustion.

Price PivotsThis indicator tracks price pivots and displays the high / low value.
You can select the number of candles to look back.
You can select how many candles range before the next pivot is printed.
Text size and colours are user defined.

LANZ Strategy 5.0 [Backtest]🔷 LANZ Strategy 5.0 — Rule-Based BUY Logic with Time Filter, Session Limits and Auto SL/TP Execution
This is the backtest version of LANZ Strategy 5.0, built as a strategy script to evaluate real performance under fixed intraday conditions. It automatically places BUY and SELL trades based on structured candle confirmation, EMA trend alignment, and session-based filters. The system simulates real-time execution with precise Stop Loss and Take Profit levels.
📌 Built for traders seeking to simulate clean intraday logic with fully automated entries and performance metrics.
🧠 Core Logic & Strategy Conditions
✅ BUY Signal Conditions:
Price is above the EMA200
The last 3 candles are bullish (close > open)
The signal occurs within the defined session window (NY time)
Daily trade limit has not been exceeded
If all are true, a BUY order is executed at market, with SL and TP set immediately.
🔻 SELL Signal Conditions (Optional):
Exactly inverse to BUY (below EMA + 3 bearish candles). Disabled by default.
🕐 Operational Time Filter (New York Time)
You can fully customize your intraday window:
Start Time: e.g., 01:15 NY
End Time: e.g., 16:00 NY
The system evaluates signals only within this range, even across midnight if configured.
🔁 Trade Management System
One trade at a time per signal
Trades include a Stop Loss (SL) and Take Profit (TP) based on pip distance
Trade result is calculated automatically
Each signal is shown with a triangle marker (BUY only, by default)
🧪 Backtest Accuracy
This version uses:
strategy.order() for entries
strategy.exit() for SL and TP
strategy.close_all() at the configured manual closing time
This ensures realistic behavior in the TradingView strategy tester.
⚙️ Flow Summary (Step-by-Step)
On every bar, check:
Is the time within the operational session?
Is the price above the EMA?
Are the last 3 candles bullish?
If conditions met → A BUY trade is opened:
SL = entry – X pips
TP = entry + Y pips
Trade closes:
If SL or TP is hit
Or at the configured manual close time (e.g., 16:00 NY)
📊 Settings Overview
Timeframe: 1-hour (ideal)
SL/TP: Configurable in pips
Max trades/day: User-defined (default = 99 = unlimited)
Manual close: Adjustable by time
Entry type: Market (not limit)
Visuals: Plotshape triangle for BUY entry
👨💻 Credits:
💡 Developed by: LANZ
🧠 Strategy logic & execution: LANZ
✅ Designed for: Clean backtesting, clarity in execution, and intraday logic simulation

Apex Edge - VantageApex Edge – Vantage
Quarter-Wick Reversal System | Price Action Based | Non-Repainting | Visual Confirmation Tool
Overview:
Apex Edge – Vantage is a precision price action indicator built to assist traders in identifying high-probability reversal entries — not based on indicators, but on how candles behave at their extremes.
This tool implements a clean, repeatable framework that reflects how I personally trade:
Spot a candle that closes with strong directional intent,
Then wait for a controlled pullback into the outer quarter,
And strike — only if price respects that line.
There’s no magic here — just raw, tactical logic visualized clearly on your chart. It's not designed to predict the market — it's built to respond when price offers you Vantage.
Core Logic:
Dot Detection – Final Quarter Close Candles
A green dot prints below a bullish candle if it closes within the top 25% of its wick-to-wick range.
A red dot prints above a bearish candle if it closes within the bottom 25% of its range.
These dots signify candles that made a strong, deliberate move in one direction — where price was pushed to an extreme and held that extreme into the close. These candles often signal institutional intent or momentum imbalance.
Entry Confirmation – Controlled Wick Rebalance
On the very next candle only, price must wick into the prior dot candle's outer quarter — but must not pass beyond it.
For buy entries, the wick must enter the bottom 25% of the previous green dot candle, but not dip below it.
For sell entries, the wick must reach into the top 25% of the red dot candle, but not exceed it.
This wick into the quarter is seen as a controlled rebalancing — a tactical reaction back into the origin zone before potential continuation.
Arrow Printing – Visual Entry Signal
Once the entry criteria are confirmed, an arrow is printed after the candle closes.
This arrow continues to print on each new candle as long as price does not violate the original entry zone — giving visual confirmation that the trade thesis is still valid.
If price breaks above/below the quarter range, the arrow disappears.
This ongoing confirmation is useful for staying in trades, managing risk, or spotting failed setups early.
Automatic Stop Loss Level
A horizontal Stop Loss line is drawn from the extreme wick of the original dot candle.
For buy entries, SL is placed below the green dot candle's low.
For sell entries, SL is placed above the red dot candle's high.
This provides immediate risk context — perfect for traders using limit orders or looking to scale in.
Coding Logic:
This script uses plotshape() and plot() functions for all visual elements.
Dot candles are identified using quarter-range logic via:
pinescript
Copy
Edit
close >= high - (high - low) * 0.25 // for bullish
close <= low + (high - low) * 0.25 // for bearish
Entry validation logic triggers only on the next candle, using:
pinescript
Copy
Edit
low >= quarterLine and low <= high // for buy entries
high <= quarterLine and high >= low // for sell entries
Arrows and SL lines are plotted only on closed candles, ensuring non-repainting behavior.
alertcondition() is used for real-time alerts on valid buy/sell triggers.
How I Personally Use It:
I wait for a dot to print — this shows directional conviction.
On the next candle, I watch for a tap into the outer quarter.
If the wick meets the criteria and the candle closes, I’ll execute manually at the close of that candle.
As long as the arrow remains on the chart, I know the setup hasn’t been invalidated.
I combine this with market structure, session timing, and liquidity context to build confluence around each trade.
Alerts Included:
Buy Entry Alert: When a green arrow prints (entry confirmed)
Sell Entry Alert: When a red arrow prints (entry confirmed)
These fire once per confirmed signal, allowing you to react in real-time or automate if desired.
Who This Is For:
Manual traders who want clean price-based entries
Anyone who uses market structure, SMC, or liquidity concepts
Traders looking to replace indicators with pure candle logic
Discretionary or semi-systematic traders who want visual tools to guide their decisions
Final Word
Apex Edge – Vantage doesn’t predict price — it shows you where price is offering you control.
This is a surgical tool designed to help you act only when the market gives you a measurable edge — and to stay in the trade as long as that edge holds.
If you're ready to stop chasing trades and start striking from a position of Vantage, then this tool belongs on your chart.

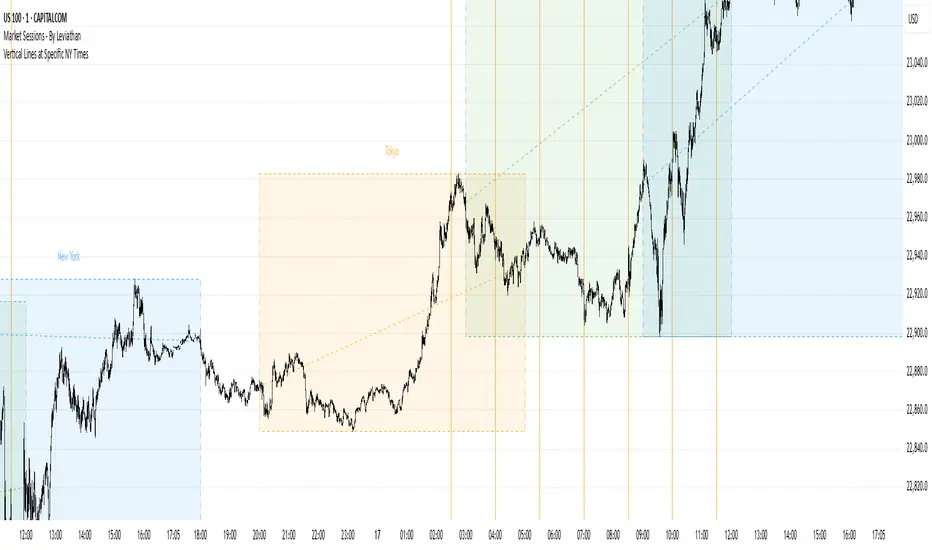
Trading session High/Low (Lumiere)Trading session High/Low
What it does:
Plots the High and Low for each session (Asia, London, New York) as horizontal zones that “snap” to the first true extreme of the session and then extend right.
Key points:
Snap‑to‑extreme only: Lines don’t draw at the open; they appear only once price makes a new session high or low, and anchor exactly at that bar.
Persistent until next session: Once drawn, each session’s lines stay on the chart after the session ends, and are cleared only when that same session next opens (or when you hide it).
Three configurable sessions:
Asia: 18:00–03:00 (UTC‑4)
London: 03:00–09:30 (UTC‑4)
New York: 09:30–16:00 (UTC‑4)
Customizable appearance:
You can toggle each session on/off, choose its color, and set line width.
The time that is already set on the different sessions is based on the standard session open/close. If you want to change it, it will refer to the NY time, UTC -4.