Impulsive Candle Detector TRW [3-in-1]Impulsive Candle Detector
Description: professor Michael impulsive candle but 3 -1 code by me
The Impulsive Candle Detector is a powerful tool designed to identify and highlight three different types of impulsive candles on your TradingView chart—all in a single, customizable indicator. Each impulsive candle type uses its own configurable settings, allowing traders to easily visualize various market dynamics without crowding their charts with multiple indicators.
How it works:
The indicator detects “impulsive” candles based on custom thresholds for candle range, volume, and body-to-wick ratio.
Each of the three types is independently configurable with its own parameters (length for averages, size multiplier, volume multiplier, body ratio, and color).
When an impulsive candle is detected, the corresponding bar is colored and can optionally display a label above the candle indicating its type.
Separate alerts can be set for each impulsive candle type, enabling you to react to different market conditions instantly.
Features:
Three independent impulsive candle detection types, all in one indicator
Adjustable settings for each type (range, volume, body ratio, and color)
Clean, uncluttered chart view
Custom bar coloring and optional labels for instant visual recognition
Supports individual alert notifications for each impulsive candle type
Perfect for:
Traders looking to spot strong market moves or volatility spikes
Those who want to monitor multiple impulsive candle patterns without overlapping indicators
Anyone who values clean and customizable charting solutions
Candlestick analysis

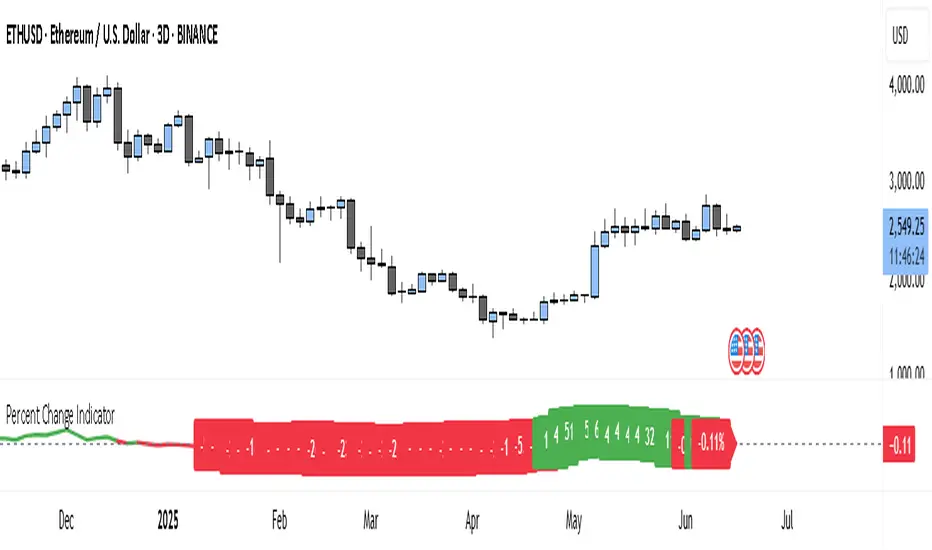
Percent Change IndicatorThe Percent Change Indicator helps you see how much the price of an asset has changed over a specific number of bars (or candles) on the chart. You get to decide how many bars to look back — for example, the last 10 candles. The indicator takes the current closing price and compares it to the closing price from 10 bars ago, then calculates the percentage difference between the two.
If the price has increased, the indicator shows a positive value and displays it in green. If the price has dropped, the value is negative and shown in red. A horizontal zero line helps you quickly see whether the market is gaining or losing value over the selected period.
On your chart, this indicator appears as a line that moves up or down with the price trend. It updates in real time and works on all timeframes — so whether you're trading on the 1-minute chart or analyzing the daily chart, it always tells you how much the price has changed over the number of bars you chose.
This tool is especially useful for spotting trends, measuring price momentum, or identifying when the market is starting to reverse direction.
SHYY-TFC-Horizontal V2SHYY-TFC-Horizontal V2 – Multi-Timeframe Clarity for The Strat Traders
SHYY-TFC-Horizontal V2 is a powerful, clean, and efficient overlay designed for serious traders who use Rob Smith’s The Strat.
This real-time table gives you instant visual insight across all key timeframes – from 5 minutes to monthly – with:
Candle direction (bullish, bearish, neutral)
Strat bar type (1, 2U, 2D, 3)
Live countdown to bar close
Compact horizontal layout that saves space and enhances clarity
Fully customizable table position to fit any chart setup
Built with no lookahead bias, this version meets TradingView’s script publishing standards and is optimized for actionable, real-time decisions.
Ideal for:
Scalpers who need fast confirmation
Swing traders aligning entries with time frame continuity
Price action traders following The Strat methodology
Trade with confidence. See the full picture. React faster.
SHYY-TFC-Horizontal V2 – built to make you faster, sharper, and more in control.

Metatron Lines (Highs & Lows Geometry)Metatron Lines
Hey TradingView community! 👋
I wanted to share something I've been working on that might help you see market structure from a different angle. This indicator connects pivot highs and lows using geometric patterns, creating what I call "Metatron Lines."
What it does (simply put):
- Finds significant highs and lows on your chart
- Draws lines connecting these points to reveal hidden geometric relationships
- Shows you the underlying structure that price tends to respect
Why I built this:
I noticed that markets often move in patterns that aren't immediately obvious. Sometimes the most important levels aren't the obvious support and resistance lines, but the intersections and angles created by connecting multiple pivot points. This tool helps visualize those relationships.
How it might help you:
- Pattern Recognition : Spot geometric formations that traditional analysis might miss
- Support/Resistance : See where multiple geometric lines converge to create strong levels
- Market Structure : Better understand how price flows and where it might find obstacles
- Confluence Areas : Identify zones where multiple geometric elements align
A few honest thoughts:
This isn't a magic bullet or a guaranteed profit maker (nothing is!). It's simply another lens through which to view price action. Some traders find geometric analysis helpful, others prefer different approaches - and that's perfectly fine.
I've tried to make it customizable so you can adjust it to fit your trading style and timeframe. The default settings work well for most instruments, but feel free to experiment.
Settings you can adjust:
- Pivot detection sensitivity
- Number of connection points
- Line colors and styles
- Which connections to show (highs, lows, or both)
I hope some of you find this useful! I'm always learning from this community, so if you have suggestions for improvements or different ways to use it, I'd love to hear them.
Trade safe and trust your process! 📈
---
This indicator is provided as-is for educational and analysis purposes. Please practice proper risk management and never risk more than you can afford to lose.

Inside Bar Detector - 15min
🔍 What is an Inside Bar?
An **Inside Bar** is a candle that forms **entirely within the high and low of the previous candle**. It represents **consolidation**, **indecision**, or **potential reversal**, and is a key signal in The Strat trading method.
🔧 What the Script Does:
1. **Timeframe Restriction**:
* The script activates **only on the 15-minute timeframe**, avoiding clutter on other timeframes.
2. **Inside Bar Logic**:
* It checks whether the **current bar’s high is lower than the previous bar’s high**, **AND** the **current bar’s low is higher than the previous bar’s low**.
* If both conditions are true, it confirms an Inside Bar.
3. **Visual Display**:
* When an Inside Bar is detected, the script **plots a yellow label ("1") above the bar**.
* The label represents the Strat 1-bar and helps you easily spot potential setups.
🎯 Use Case:
* Ideal for **Strat traders**, **price action analysts**, or **any trader** looking for breakout or reversal opportunities.
* Common setups include **1-2**, **1-3**, or **double inside bar** breakouts.

Mark specific candle (e.g. bar 20)This Pine Script indicator, "Mark specific candle (e.g. bar 20)" (short title "Mark candle"), is a simple yet powerful tool to visually highlight a particular candle on your chart.
What it does:
It marks a specific candle (e.g., the 20th, 10th, or any number you choose) counting backwards from the most recent candle on your chart. The marked candle will be colored in a subtle light grey and also feature a tiny, matching grey arrow pointing down from above it.
Why it's useful:
This indicator helps you quickly identify and track a consistent reference point in recent price action. It's great for strategies that depend on fixed look-back periods or for simply keeping an eye on a specific historical candle's position as new data comes in.
Key Features:
Adjustable Candle Number: Easily change which candle is marked (e.g., 20th, 10th, 5th) directly from the indicator settings using the "Candle Number to Mark (from end)" input.
Clear Visuals: Both the candle color and a small arrow provide a subtle, yet effective, visual cue.
How to use:
Simply add this script to your TradingView chart. Then, open the indicator's settings to set your desired candle number.

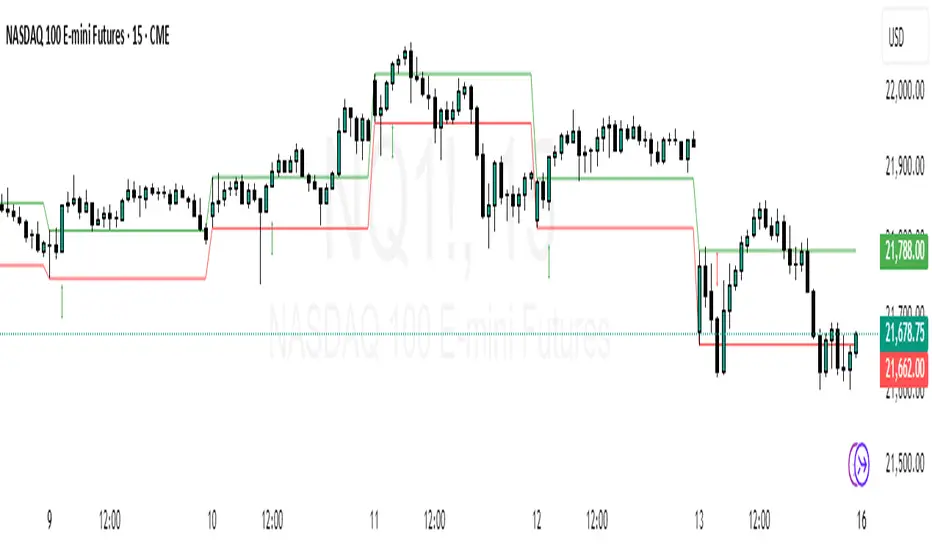
Bias Bar Coloring + Multi-Timeframe Bias Table + AlertsMulti-Timeframe Bias Bar Coloring with Alerts & Table
This indicator provides a powerful, visual way to assess price action bias across multiple timeframes—Monthly, Weekly, and Daily—while also coloring each bar based on the current chart’s bias.
Features:
Persistent Bar Coloring: Bars are colored green for bullish bias (close above previous high), red for bearish bias (close below previous low), and persist the last color if neither condition is met. This makes trend shifts and momentum easy to spot at a glance.
Bias Change Alerts: Get notified instantly when the bias flips from bullish to bearish or vice versa, helping you stay on top of potential trade setups or risk management decisions.
Multi-Timeframe Bias Table: A table anchored in the top right corner displays the current bias for the Monthly, Weekly, and Daily charts, color-coded for quick reference. This gives you a clear view of higher timeframe context while trading any chart.
Consistent Logic: The same objective bias logic is used for all timeframes, ensuring clarity and reliability in your analysis.
How to Use:
Use the bar colors for instant visual feedback on trend and momentum shifts.
Watch the top-right table to align your trades with higher timeframe bias, improving your edge and filtering out lower-probability setups.
Set alerts to be notified of bias changes, so you never miss a potential opportunity.
This tool is ideal for traders who value multi-timeframe analysis, want clear visual cues for trend direction, and appreciate having actionable alerts and context at their fingertips.

Data Monitoring TableThis is a visual data dashboard specifically designed for users engaged in quantitative trading and technical analysis. It is equipped with two data tables that can dynamically display key market technical indicators and cryptocurrency price fluctuation data, supporting customizable column configurations and trading mode filtering.
✅ Core Features:
Intuitive display of critical technical indicators, including the Relative Strength Index (RSI), K-line entity gain, upper/lower shadow ratio, trading volume level, and change rate.
Multi-timeframe tracking of price fluctuations for BTC/ETH/SOL/XRP/DOGE (1-day, 6-hour, 3-hour).
Selectable trading modes: "long-only", "short-only", or "both".
Customizable number of columns to adapt to analysis needs across different timeframes.
All data is visualized in tables with color-coded prompts for market conditions (overbought, oversold, high volatility, low volatility, etc.).
📈 Target Audience:
Investors seeking systematic access to technical data.
Quantitative strategy developers aiming to capture market structural changes.
Intermediate and beginner traders looking to enhance market intuition and decision-making.
New Feature:
We have added a trading volume monitoring grade setting feature. Users can set the monitoring grade by themselves. When the market trading volume reaches this grade, the system will trigger an alarm. The default setting is level 5. This setting is designed to filter out trades with small fluctuations, helping users to capture key trading signals more accurately and improve the efficiency of trading decisions.
中文介绍
这是一款专为量化交易和技术分析用户设计的可视化数据仪表盘。它配备两个数据表格,可动态展示关键市场技术指标与加密货币价格波动数据,支持自定义列配置和交易模式筛选。
✅ 核心功能:
直观展示相对强弱指标(RSI)、K 线实体涨幅、上下影线比例、成交量水平及变化率等关键技术指标。
多时间框架追踪 BTC/ETH/SOL/XRP/DOGE 价格波动(1 日、6 小时、3 小时)。
可选交易模式:“仅做多”“仅做空” 或 “多空双向”。
可自定义列数,适配不同时间框架的分析需求。
所有数据以表格可视化呈现,通过颜色标注提示市场状况(超买、超卖、高波动、低波动等)。
📈 目标用户:
寻求系统获取技术数据的投资者。
旨在捕捉市场结构变化的量化策略开发者。
希望提升市场洞察力和决策能力的初、中级交易者。
新增功能:
我们新增了成交量监控等级设置功能。用户可自行设定监控等级,当市场成交量达到该等级时,系统将触发警报。默认设置为 5 级,此设置旨在过滤掉小幅波动的交易,帮助用户更精准地捕捉关键交易信号,提升交易决策效率。

Supply/Demand Zones (Synthetic SMA Candles)Supply/Demand Zones (Synthetic SMA Candles)
Created by The_Forex_Steward
This indicator highlights institutional-style supply and demand zones using synthetic SMA-based candles rather than raw price data. It provides a smoother, more refined view of price action to help identify key imbalance areas where price is likely to react.
Features:
- Uses SMA-smoothed synthetic candles to detect bullish and bearish engulfing structures
- Draws demand zones after bullish breakouts and supply zones after bearish breakouts
- Zones are persistent for a customizable number of bars
- Mitigated zones can optionally be removed from the chart
- Includes alerts for breakout and mitigation events
- Optional plotting of synthetic candles over price for visual clarity
How It Works:
When a synthetic candle closes above the high of a previous bearish candle, a bullish engulfing is detected, and a demand zone is created from that bearish candle’s high and low. Conversely, when price closes below the low of a previous bullish candle, a supply zone is formed. These zones stay on the chart for the user-defined duration or until they are mitigated by price, at which point they can be removed automatically.
How to Use:
- Adjust the SMA Length to control how smooth the synthetic candles appear
- Enable or disable Show Supply Zones and Show Demand Zones as needed
- Set the Zone Duration to control how long each zone persists
- Use Delete Mitigated Zones to automatically remove zones when price returns to them
- Optionally enable Show Synthetic SMA Candles to see the candle logic used in detection
- Use the built-in alerts to stay notified of new zone creation or mitigation
Note: This tool is most effective when combined with structure or trend-based strategies for confirmation.

Unified Sentiment Candles Overlay (SMA)Unified Sentiment Candles (SMA) Indicator
The Unified Sentiment Candles (SMA) is a custom overlay indicator designed to provide a smoothed visualization of market sentiment by plotting synthetic candles based on the Simple Moving Average (SMA) of open, high, low, and close prices. It helps traders identify trend direction and potential reversals more clearly.
How to Use:
- Observe Candle Colors: Green candles indicate bullish sentiment (close ≥ open), while red candles suggest bearish sentiment (close < open).
- Trend Identification: Consistent green candles point to an uptrend, whereas consistent red candles may signal a downtrend.
- Support & Resistance Zones: The SMA-based candles smooth out short-term volatility, assisting in spotting key support and resistance levels.
- Entry & Exit Signals: Look for color changes or candle pattern formations within the synthetic candles to time entries and exits more effectively.
Settings:
SMA Length : Adjust this parameter to control the smoothing period. A shorter length makes the indicator more responsive, while a longer length smooths out more noise.
This indicator is best used in conjunction with other technical analysis tools to confirm signals and improve trading accuracy.
This script is open-source and licensed under the Mozilla Public License 2.0. Use and modify it at your own discretion.

Stephis Supply & Demand Zones v3
📉 Support
Definition: Support is a price level where a downtrend can be expected to pause or reverse due to a concentration of buying interest.
Why it matters: When the price of an asset falls to a support level, traders expect buyers to step in, preventing the price from falling further.
Visual clue: On a chart, support often appears as a horizontal line where the price has bounced up multiple times.
📈 Demand
Definition: Demand refers to the willingness and ability of buyers to purchase an asset at a given price.
In trading context: High demand typically pushes prices up, while low demand can lead to price drops.
Relation to support: A support level exists because of demand—buyers are willing to buy at that price, creating a floor.
🧠 How They Work Together
When price approaches a support level, traders watch to see if demand increases—if it does, the price may bounce.
If the support level is broken, it may signal that demand has weakened, and the price could fall further.
🔁 Opposite Concept: Resistance & Supply
Resistance is the opposite of support—it's a level where selling pressure (supply) may stop a price from rising.
Just like demand creates support, supply creates resistance.

SMT DivergenceSMT Divergence Indicator
This powerful indicator identifies high-probability reversal points by detecting SMT (Smart Money Technique) divergences between two correlated assets. It spots subtle shifts in market momentum, revealing when one asset fails to confirm the price action of another—often signaling an impending trend change.
Key Features:
Inter-Market Divergence Detection: Automatically compares the price action of the main symbol with a second user-defined asset.
Identifies Key Reversals: Pinpoints both bullish and bearish SMT divergences, highlighting hidden strength in downtrends and underlying weakness in uptrends.
Customizable Pivot Detection: Allows fine-tuning of the pivot length to adjust sensitivity for different market conditions and timeframes.
Flexible Display Modes: Choose between clean 'Lines' connecting the diverging pivots or precise 'Labels' marking the exact high/low points.
Full Visual Customization: Complete control over the colors and line thickness for seamless integration with your existing chart layout.
Built-in Alerts: Stay notified of every potential opportunity with alerts for both bullish and bearish signals.
Settings:
Core Parameters:
Comparison Symbol: Select the second asset to compare against for divergence analysis (e.g., NQ1! if you are charting ES1!).
Pivot Length: Defines the number of bars to the left and right required to confirm a pivot high or low.
Visual Settings:
Display Style: Choose to visualize divergences as 'Lines' or 'Labels'.
Bearish/Bullish Color: Set custom colors for bearish and bullish divergence indicators.
Line Width: Adjust the thickness of the divergence lines for optimal visibility.
Perfect for traders who utilize inter-market analysis to confirm trade ideas. The SMT Divergence indicator provides a crucial edge by exposing non-confirmations between related assets, allowing for earlier and more confident entries into potential market reversals.

Big Move Follow-Through Tracker🚀 What This Indicator Does
Ever wondered if that sudden 5% pump in your favorite crypto will continue or just fade away? This powerful indicator automatically tracks every significant price move and tells you exactly what happened next - momentum continuation or mean reversion.
🎯 Key Features
📊 Smart Move Detection
Automatically identifies "big moves" based on your custom threshold (default 3%)
Uses ATR filtering to ensure moves are truly significant, not just normal volatility
Works on ANY timeframe and ANY crypto pair
🔍 Follow-Through Analysis
Tracks each big move for your specified number of bars (default 5)
Classifies outcomes as either Follow-Through (momentum continues) or Mean Reversion (price reverses)
Uses intelligent 2% thresholds to avoid noise and focus on meaningful moves
📈 Real-Time Statistics Dashboard
Live statistics table showing historical performance
Separate analysis for UP moves vs DOWN moves (crypto often behaves differently!)
Percentage breakdowns of follow-through vs reversion rates
Track total moves detected vs analyzed over time
🎨 Visual Clarity
Clear arrow signals when big moves are detected
Background highlighting during significant moves
Customizable display options - show/hide signals and stats as needed
🛠️ How to Use
Add to any crypto chart (works on BTC, ETH, altcoins, etc.)
Adjust the move threshold (3% for major coins, higher for smaller caps)
Set analysis timeframe (how many bars to track each move)
Watch the statistics build over time to understand your asset's behavior
💡 Trading Applications
For Momentum Traders:
High follow-through rates? → Consider riding the momentum
Trade in direction of big moves when statistics support it
For Mean Reversion Traders:
High reversion rates? → Look for fade opportunities
Counter-trade big moves when they historically reverse
For Risk Management:
Understand typical behavior after significant moves
Size positions based on historical follow-through probabilities
📋 Customizable Settings
Big Move Threshold: Adjust sensitivity (0.5% - 10%)
Analysis Period: How long to track each move (3-20 bars)
Display Options: Toggle signals and statistics table
Alert System: Get notified when big moves occur
🎲 What Makes This Different
Unlike simple momentum indicators, this tool:
✅ Quantifies actual outcomes with real statistics
✅ Adapts to each asset's unique volatility profile
✅ Separates up and down move behavior
✅ Provides actionable probability data
📊 Perfect For
Crypto day traders looking for edge identification
Swing traders wanting to understand momentum vs reversion tendencies
Risk managers needing probability-based position sizing
Strategy developers building data-driven trading systems
⚡ Quick Setup Tips
For Major Cryptos (BTC, ETH): Use 2-4% threshold
For Altcoins: Use 4-8% threshold
For Scalping: Use lower timeframes with 1-2% threshold
For Swing Trading: Use higher timeframes with 5%+ threshold

Double Inside Body Candles with Box & Alert + 5-Bar LinesThis indicator identifies Double Inside Body Candle patterns, where:
Candle 1 is completely inside Candle 2,
Candle 2 is completely inside Candle 3 (the parent candle),
Candle 3 has a real body (not a doji or negligible body size).
Once the pattern is detected:
A label appears below the current candle.
A highlight box is drawn around Candle 3 (the parent candle) body range.
Horizontal lines are drawn from the top and bottom of Candle 3’s body and extend forward for exactly 5 bars to visualize potential breakout levels.
The script also detects and highlights breakouts:
🔼 Bullish breakout: if price closes above Candle 3's body high.
🔽 Bearish breakout: if price closes below Candle 3's body low.
Alerts are available for:
Double Inside Body pattern detection
Bullish breakout
Bearish breakout
Traders can use this script to identify consolidation periods (double inside bars), then monitor for breakout opportunities in either direction, using the 5-bar lines as short-term breakout levels.

Candle Range Detector by TradeTech AnalysisCandle Range Detector by TradeTech Analysis
This advanced indicator identifies and visualizes price compression zones based on inside bar formations, then tracks how price behaves around those zones — offering valuable insights into liquidity sweeps, range expansions, and trap/mitigation behavior.
The script builds upon the foundational concept of range-based price action, commonly used by institutional traders, and adds automation, mitigation tracking, and sweep detection to map how price reacts around these critical ranges.
🔍 How It Works:
• Range Formation: A new range is detected when the current candle forms entirely within the high and low of the previous candle (i.e., an inside bar). This behavior often indicates price compression and potential breakout zones.
• Range Extension: Once a range is confirmed, the script projects upper and lower boundaries (using either a percentage-based multiplier or Fibonacci log extension), providing context for expected breakout zones.
• Mitigation Tracking: The script continuously monitors whether price breaks above or below the projected extensions, marking that range as mitigated — useful for confirming whether liquidity was absorbed.
• Sweep Detection: If price re-visits a mitigated zone and shows signs of a liquidity sweep (via wick + close behavior), the indicator triggers visual sweep labels and optional alerts.
🧠 Optional Visual Enhancements:
• Highlight range-forming candles with light blue background (toggle on/off)
• Midpoint dotted line for symmetry analysis
• Labels for “Range High” and “Range Low” for visual clarity
• Dynamic box drawing that adapts upon mitigation or continuation
⚙️ Customizable Features:
• Choose between Normal and Fibonacci-based detection modes
• Toggle visibility of range boxes, extension lines, and sweep markers
• Configure sweep alerts, mitigation window size, and visual transparency
⸻
🧪 Use Cases
• Identify consolidation zones before major price moves
• Confirm liquidity sweeps for entry/exit traps
• Visualize and test mitigation behavior of past zones
• Combine with Order Flow or Volume Profile tools to enhance context
⸻
⚠️ This is a fully original implementation that goes beyond classical inside-bar scanners by incorporating mitigation, extension projection, and liquidity sweeps — making it a powerful tool for intraday, swing, and even Smart Money-based trading setups.

S&P Power Hour Liquidity Sweep StrategyThis indicator is designed for intraday traders who want to take advantage of liquidity grabs, break of structure (BOS), and optimal entry points during the most volatile hours of the trading day: the NYSE Power Hours (09:30–10:30 AM and 02:30–04:00 PM EST).
Key Features:
Power Hour Detection:
Automatically identifies the two most liquid hours of the trading session.
Liquidity Sweep Detection:
Highlights when price sweeps a recent swing high or low — a common trap before reversals.
Break of Structure (BOS):
Confirms trend shift after a liquidity sweep with smart money-style BOS markers.
Fair Value Gap (FVG) Highlighting: (Optional)
Spot institutional imbalances between candles to fine-tune trade entries.
How It Works:
Wait for price to sweep a swing high or low during the power hours.
Look for a break of structure (BOS) in the opposite direction.
Enter on the next candle or FVG retest.
The indicator will plot a yellow circle for entry, a red line for stop, and a green line for the target (based on your RR setting).
Customizable Inputs:
Swing sensitivity (lookback bars)
Risk-to-reward ratio
Optional FVG visibility
Best Used With:
Higher timeframe bias (15m/1H)
Order blocks or volume analysis
Avoiding major news events
Whether you're a scalper or precision-based intraday trader, this tool helps you spot high-probability reversal setups with clean visuals and clear confirmations.

ORB Breakout Indicator - NQ1!The purpose of this indicator is to assist traders in rapidly identifying high-probability Opening Range Breakout (ORB) setups on the NQ1! 1-minute time frame (Nasdaq Futures)
Key Features:
Opening Range: Automatically plots the high and low of the 1st 15min of the (NYSE session) (09:30–09:45 EST)
Breakout Signals : Illustrates the first candle that breaks upward or downward and:
Green arrow for a bullish breakout
Red arrow for a bearish breakout
Clean Visuals: Dynamic lines show the high and low of the ORB window for easy reference.
(DON'T USE THIS ONLY FOR ENTRY SIGNALS, PAIR THIS WITH OTHER INFLUENCES TO GET HIGH PROBABILITY BREAKOUTS)
Top Right Watermark# TopRight Watermark
**Finally, a watermark that stays out of your way!**
Tired of TradingView's default watermark blocking your price action and technical analysis? This customizable watermark indicator gives you complete control over positioning and content display.
## 🎯 Key Features
**✅ Flexible Positioning** - Place anywhere: corners, sides, or edges
**✅ Multi-Slot Display** - Up to 3 customizable information slots
**✅ Individual Font Control** - Different sizes for each slot
**✅ Platform Compatibility** - TradingView OR MetaTrader timeframe formats
**✅ Clean & Professional** - Customizable colors and transparency
## 🔧 What You Can Display
- **Timeframe** - Current chart period
- **Ticker** - Symbol name (smart formatting for crypto/forex)
- **Exchange** - Broker/platform name
- **Custom Text** - Your own message
- **Empty** - Hide unused slots
## 🎨 Customization Options
- **Position**: 9 placement options (top/middle/bottom + left/center/right)
- **Colors**: Full color picker with transparency control
- **Font Sizes**: 5 sizes available per slot (tiny to huge)
- **Timeframe Style**: Choose TradingView (1m, 4H) or MetaTrader (M1, H4) format
## 🚀 Perfect For
- Traders who need clean chart visibility
- Multi-timeframe analysis
- Professional chart screenshots
- Platform migrants (MT4/MT5 to TradingView)
- Anyone wanting organized chart information
## 💡 Pro Tips
- Place in corners to avoid price action interference
- Combine Exchange + Ticker + Timeframe for complete context
- Use transparency to make it subtle but visible
**Stop letting watermarks interfere with your trading analysis. Take control of your chart display today!**
---
*Compatible with all TradingView chart types and timeframes. Easy setup with intuitive controls.*

Mariam Smart FlipPurpose
This tool identifies high-probability intraday reversals by detecting when price flips through the daily open after strong early-session commitment.
How It Works
A valid flip occurs when:
The previous daily candle is bullish or bearish
The first hour today continues in the same direction
Then, the price flips back through the daily open with a minimum break threshold (user-defined)
This setup is designed to catch liquidity grabs or fakeouts near the daily open, where early buyers or sellers get trapped after showing commitment
Signal Logic
Buy Flip
Previous day bearish → first hour bearish → price flips above open
Sell Flip
Previous day bullish → first hour bullish → price flips below open
Features
Configurable flip threshold in percentage
Signals only activate after the first hour ends
Daily open line displayed on chart
Simple triangle markers with no visual clutter
Alerts ready to use for automation or notifications
Usage Tips
Use "Once Per Bar" alert mode to get notified immediately when the flip happens
Works best in active markets like FX, indices, or crypto
Adjust threshold based on asset volatility
Suggested stop loss: use the previous daily high for sell flips or the previous daily low for buy flips
Suggested take profit: secure at least 30 pips to aim for a 1:3 risk-to-reward ratio on average

BOS mark-out (by Lumiere)Advanced BOS Detection with Strict Swing Confirmation
This indicator implements BOS detection with several unique features:
🔹 Dual-Candle Swing Validation - Unlike most BOS indicators that use single candle swings, this uses a two-candle confirmation for swing highs/lows, analyzing both the candle wicks and body transitions.
🔹 Directional Lock System - Implements a state machine that prevents duplicate signals until an opposite-direction BOS occurs, reducing noise.
🔹 Precision Wick Analysis - Compares wicks between the reversal candle and confirmation candle to identify the true swing point.
🔹 Real-Time Update & Live Market Adaptation – The indicator continuously monitors price action and instantly updates BOS signals as new candles form, ensuring you never miss a BOS.
How It Differs From Other BOS Indicators:
Most public BOS indicators use simple HH/HL or LH/LL detection.
Many don't implement the directional locking mechanism.
Few use the two-candle wick comparison approach.
Wick-Based Precision uses the extreme wicks of two candles (not just the body).
Strict Confirmation requires a close beyond the swing point (no "wick breaks" counted).
Usage Examples:
🟦 Bullish BOS:
A green candle closes, followed by a red candle. This will be the new high, and if the next candle closes above the highest wick of those two, it will be a BOS (only if we had a bearish BOS before)
🟥 Bearish BOS:
A red candle closes, followed by a green candle. This will be the new low, and if the next candle closes below the lowest wick of those two, it will be a BOS (only if we had a Bullish BOS before)

Path of Least ResistancePath of Least Resistance (PLR)
Concept Overview
The Path of Least Resistance indicator identifies key zones on your chart that act like "muddy" or "sticky" areas where price tends to get bogged down, creating choppy and unpredictable price action. Between these zones lie the "empty spaces" - clear paths where price can move freely with momentum and direction.
The Analogy: Muddy Fields vs Open Roads
Think of your chart like a landscape:
🟫 ZONES (Muddy/Sticky Areas)
Fair Value Gaps (FVGs) from higher timeframes
Pivot wick zones from higher timeframe pivots
Areas where price gets "stuck" and churns
Like walking through thick mud - slow, choppy, unpredictable movement
Price action becomes erratic and difficult to trade
🟢 EMPTY SPACES (Open Roads)
The clear areas between zones
Where price can move freely with momentum
Like driving on an open highway - smooth, directional movement
The "Path of Least Resistance" for price movement
Trading Philosophy
AVOID Trading Within Zones:
Price action is typically choppy and unpredictable
Higher probability of false signals and whipsaws
Like trying to drive through mud - you'll get stuck
TRADE Through the Empty Spaces:
Look for moves that travel between zones
Price tends to move with momentum and direction
Higher probability setups with cleaner price action
Like taking the highway instead of back roads
Zone Types Detected
Fair Value Gaps (FVGs)
Imbalances from higher timeframe candles
Areas where price "owes" a return visit
Often act as magnets, creating choppy price action
Pivot Wick Zones
Upper and lower wicks from higher timeframe pivots
Rejection areas where price previously struggled
Often create resistance/support that leads to choppy movement
Color Coding System
The zones dynamically change color based on current price position:
🔴 RED ZONES : Price is below the zone (bearish context)
🟢 GREEN ZONES : Price is above the zone (bullish context)
🔘 GRAY ZONES : Price is within the zone (neutral/choppy area)
The "Mum Trades" Strategy
The best trades - what we call "Mum trades" (trades so obvious even your mum could spot them) - happen in the empty spaces between zones:
✅ High Probability Characteristics:
Clear directional movement between zones
Less noise and false signals
Higher momentum and follow-through
Cleaner technical patterns
❌ Avoid These Areas:
Trading within the muddy zones
Expecting clean moves through sticky areas
Fighting against the natural flow of price
Key Features
Auto Timeframe Detection : Automatically selects appropriate higher timeframe
Dynamic Zone Management : Overlapping zones are automatically cleaned up
Real-time Alerts : Get notified when price enters/exits zones
Visual Clarity : Clean zone display with extending boundaries
How to Use
Identify the Zones : Let the indicator mark the muddy areas
Find the Paths : Look for clear spaces between zones
Plan Your Trades : Target moves that travel through empty space
Avoid the Mud : Stay away from trading within the zones
Follow the Flow : Trade with the path of least resistance
Remember
Price, like water, always seeks the path of least resistance. By identifying where that path is clear (empty spaces) versus where it's obstructed (zones), you can align your trading with the natural flow of the market rather than fighting against it.
The goal is simple: Trade the highways, avoid the mud.

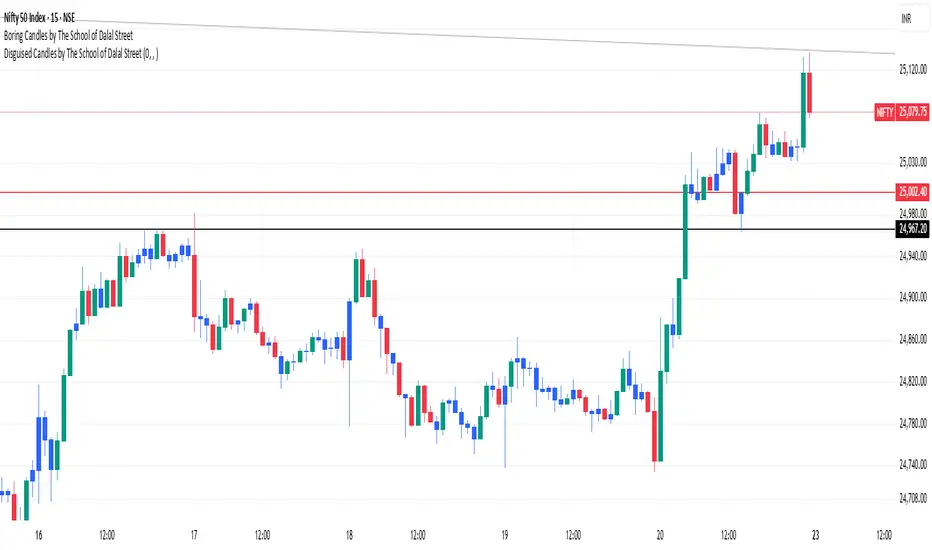
Boring Candles by The School of Dalal StreetThis indicator highlights the "boring" candles. These are candles where the body is less than 50% in length as compared to the high and low length. This allows us to quickly find the lower timeframe demand/supply without switching the chart timeframe. The use case is to quickly find our targets based on lower time frames.
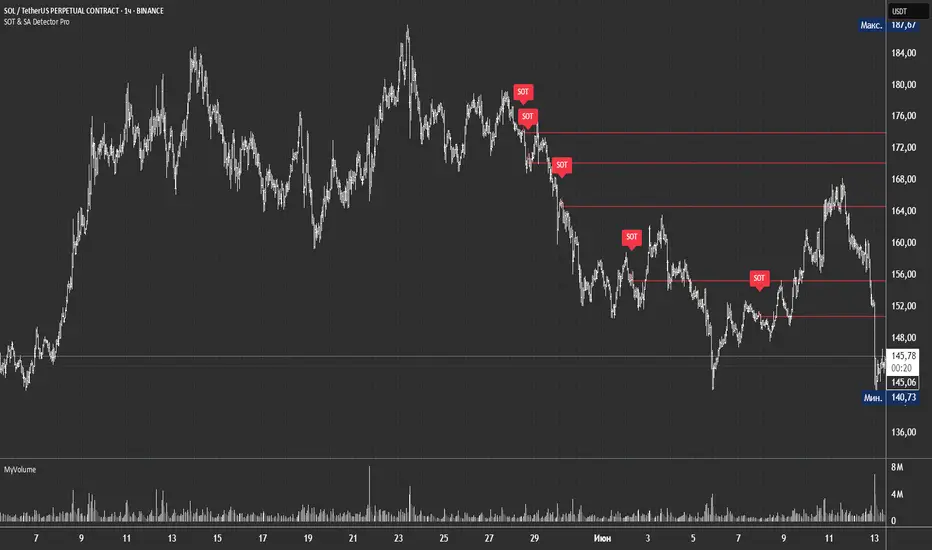
SOT & SA Detector ProSOT & SA Detector Pro- Advanced Reversal Pattern Recognition
OVERVIEW
The SOT & SA Detector is an educational indicator designed to identify potential market reversal points through systematic analysis of candlestick patterns, volume confirmation, and price wave structures. SOT (Shorting of Thrust) signals suggest potential bearish reversals after upward price movements, while SA (Selling Accumulation) signals indicate possible bullish reversals following downward trends. This tool helps traders recognize key market transition points by combining multiple technical criteria for enhanced signal reliability.
═══════════════════════════════════════════════════════════════
HOW IT WORKS
Technical Methodology
The indicator employs a multi-factor analysis approach that evaluates:
Wave Structure Analysis: Identifies minimum 2-bar directional waves (upward for SOT, downward for SA)
Price Delta Validation: Ensures closing price changes remain within specified percentage thresholds (default 0.3%) best 0.1.
Candlestick Tail Analysis: Measures rejection wicks using configurable tail multipliers
Volume Confirmation: Requires increased volume compared to previous periods
Pattern Confirmation: Validates signals through subsequent price action
Signal Generation Process
Pattern Recognition: Scans for qualifying candlestick formations with appropriate tail characteristics
Volume Verification: Confirms patterns with volume expansion using adjustable multiplier
Price Confirmation: Validates signals when price breaks and closes beyond pattern extremes
Signal Display: Places labeled markers and draws horizontal reference levels
Mathematical Foundation
Delta calculation: math.abs(close - close ) / close <= deltaPercent / 100
Tail analysis: (high - close ) >= tailMultiplier * (close - low ) for SOT
Volume filter: volume >= volume * volumeFactor
═══════════════════════════════════════════════════════════════
KEY FEATURES
Dual Pattern Recognition: Identifies both bullish (SA) and bearish (SOT) reversal candidates
Volume Integration: Incorporates volume analysis for enhanced signal validation
Customizable Parameters: Adjustable wave length, delta percentage, tail multiplier, and volume factor
Visual Clarity: Color-coded bar highlighting, labeled signals, and horizontal reference levels
Time-Based Filtering: Configurable analysis period to focus on recent market activity
Non-Repainting Signals: Confirmed signals remain stable and do not change with new price data
Alert System: Built-in notifications for both initial signals and subsequent confirmations
═══════════════════════════════════════════════════════════════
HOW TO USE
Signal Interpretation
Red SOT Labels: Appear above potential bearish reversal candles with downward-pointing markers
Green SA Labels: Display below potential bullish reversal candles with upward-pointing markers
Horizontal Lines: Extend from signal levels to provide ongoing reference points
Bar Coloring: Highlights qualifying pattern candles for visual emphasis
Trading Application
This indicator serves as an educational tool for pattern recognition and should be used in conjunction with additional analysis methods. Consider SOT signals as potential areas of selling pressure following upward moves, while SA signals may indicate buying interest after downward price action.
Best Practices
Combine with trend analysis and support/resistance levels
Consider overall market context and timeframe alignment
Use proper risk management techniques
Validate signals with additional technical indicators
═══════════════════════════════════════════════════════════════
SETTINGS
Analysis Days (Default: 20)
Controls the lookback period for signal detection. Higher values extend historical analysis while lower values focus on recent activity.
Minimum Bars in Wave (Default: 2)
Sets the minimum consecutive bars required to establish directional wave patterns. Increase for stronger trend confirmation.
Max Close Change % (Default: 0.3) best 0.1.
Defines acceptable closing price variation between consecutive bars. Lower values require tighter price consolidation.
Tail Multiplier (Default: 1.0) best 1.5 or more.
Adjusts sensitivity for candlestick tail analysis. Higher values require more pronounced rejection wicks.
Volume Factor (Default: 1.0)
Sets volume expansion threshold compared to previous period. Values above 1.0 require volume increases.
═══════════════════════════════════════════════════════════════
LIMITATIONS
Market Conditions
May produce false signals in highly volatile or low-volume conditions
Effectiveness varies across different market environments and timeframes
Requires sufficient volume data for optimal performance
Signal Timing
Signals appear after pattern completion, not in real-time during formation
Confirmation signals depend on subsequent price action
Historical signals do not guarantee future market behavior
Technical Constraints
Limited to analyzing price and volume data only
Does not incorporate fundamental analysis or external market factors
Performance may vary significantly across different trading instruments
═══════════════════════════════════════════════════════════════
IMPORTANT DISCLAIMERS
This indicator is designed for educational purposes and technical analysis learning. It does not constitute financial advice, investment recommendations, or trading signals. Past performance does not guarantee future results. Trading involves substantial risk of loss, and this tool should be used alongside proper risk management techniques and additional analysis methods.
Always conduct thorough analysis using multiple indicators and consider market context before making trading decisions. The SOT & SA patterns represent potential reversal points but do not guarantee price direction changes.
═══════════════════════════════════════════════════════════════
Credits: Original concept and Pine Script implementation by Everyday_Trader_X
Version: Pine Script v6 compatible
Category: Technical Analysis / Reversal Detection
Overlay: Yes (displays on price chart)