Trend_Finder(Telegram-RR_Algo_Indicators_Intraday)EMA Inputs
It uses 6 EMAs with customizable lengths (defaults: 30, 35, 40, 45, 50, 60).
Trend Conditions
Bullish Trend: All EMAs are strictly ordered from smallest to largest, meaning short-term prices are leading long-term prices upward.
Bearish Trend: All EMAs are ordered from largest to smallest, meaning short-term prices are falling below long-term ones.
Neutral: EMAs are mixed and do not meet the above criteria.
Trend Tracking
The script remembers the current trend and only flips when a full trend reversal condition is confirmed.
Candlestick analysis

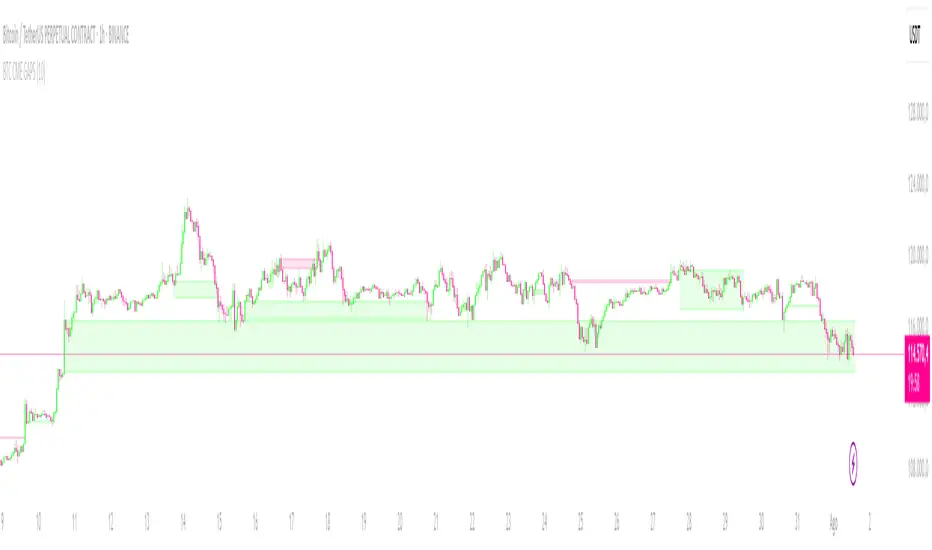
CRYPTO CME GAPS- Can be used in any crypto symbol of any exchange, (not necessarily the CME exchange)
- Displays the CME gaps with the colors green or red depending on the sentiment of the gap
- Extends the gaps displayed until they are filled.
- In the end of the code there are the boolean values 'filled_bull' and 'filled_bear' that can be used to create a strategy script.
Wx2 Treasure Box – Institutional Entry🧩 Indicator Overview: Wx2 Treasure Box – Institutional Entry
Designed to detect Institutional Bars (IBs) and visualize high-probability entry zones, this script helps traders align with potential smart-money activity.
Institutional Bars are defined as Entry of Smart Money
⚙️ How It Works
20-period and 200-period Simple Moving Averages are plotted to show short‑ and long‑term trend direction.
On identification of an IB:
A label “IB” is placed above the bar.
A rectangular box is drawn around its high–low range, extending several bars to the right to mark the trade zone
Trade Signals & Setup Guidelines
Buy Entry:
Trigger: Price breaks above the box.
Stop Loss (SL): Set just below the box bottom.
Sell Entry:
Trigger: Price piercing below the box.
SL: Placed above the box top.
Risk-to-Reward Ratio (RRR):
Target RRR of 1:2 is recommended
Best Execution Zone:
Treasure Box is the best with 20SMA+200 SMA+Price in it.
📽️ Video Link
You’ve linked a YouTube video for explanation:
Watch Here


Invencible MACD Strategy Scalping)Invencible MACD Strategy
The Invencible MACD Strategy is a refined scalping system designed to deliver consistent profitability by optimizing the classic MACD indicator with trend and volatility filters. This strategy is built for short-term traders looking for precision entries and favorable risk-to-reward conditions on any asset and lower timeframes such as 1m, 5m, or 15m.
Core Logic
This strategy uses a multi-timeframe (MTF) approach to calculate the MACD, Signal Line, and Histogram. Trades are executed when all of the following conditions are met:
Long Entry:
The MACD crosses above the Signal Line.
The Histogram is rising with a defined impulse threshold.
Price is above the 200 EMA, confirming an uptrend.
Volatility, measured by ATR, is above a configurable minimum.
Short Entry:
The MACD crosses below the Signal Line.
The Histogram is falling with a defined impulse threshold.
Price is below the 200 EMA, confirming a downtrend.
ATR confirms sufficient volatility.
Risk Management
Take Profit is set higher than Stop Loss to ensure that the average winning trade is greater than the average losing trade.
Trailing stop is optional and can be disabled to allow full profit capture on strong moves.
Trade size is fixed to 1 contract, suitable for scalping with low exposure.
Customizable Parameters
MACD Fast, Slow, and Signal EMAs
Histogram impulse threshold
Minimum ATR filter
Take Profit and Stop Loss percentage
Trailing Stop activation and size
Timeframe resolution (can be customized or synced with chart)
Visual Aids
MACD and Signal Line are plotted below price.
Histogram bars help visualize momentum strength.
200 EMA is plotted on the main chart to show trend direction.
This strategy was designed to prioritize quality over quantity, avoiding weak signals and improving both the win rate and profit factor. It is especially effective on assets like gold (XAUUSD), indices, cryptocurrencies, and high-liquidity stocks.
Feel free to test and optimize parameters based on your trading instrument and timeframe.
Los 7 Capitales

EMA 8 & 21 crossover change EMA 8 & 21 crossover change Indicator This custom TradingView indicator highlights trend shifts by changing candle colors when the 8 EMA crosses the 21 EMA. Bullish crossovers turn candles different color, while bearish crossovers turns different as well—making it easy to visually identify emerging trends and momentum shifts in real time.

Buy/Sell Labels-RR_AlgoAI (Telegram-RR_Algo_Indicators_Intraday)This indicator uses the Trend Movement to identify shifts in market trend. When the positive movement crosses above the negative, it signals a potential bullish move and marks the chart with a "BUY" label along with a green trend line from the candle's low. Conversely, when Negative movement crosses above Positive Movement, it signals bearish potential, showing a "SELL" label and a red trend line from the candle's high. It also plots the smoothed difference between to show trend strength.

3 EMA cross overThis Pine Script displays the 3 EMA trend status for a list of popular stocks in a dynamic table. It calculates and monitors 13 EMA, 48 EMA, and 200 EMA for each ticker to detect bullish or bearish alignment.
Best Use:
Use this script to quickly scan market trends across multiple stocks and identify potential trade opportunities based on EMA alignment.

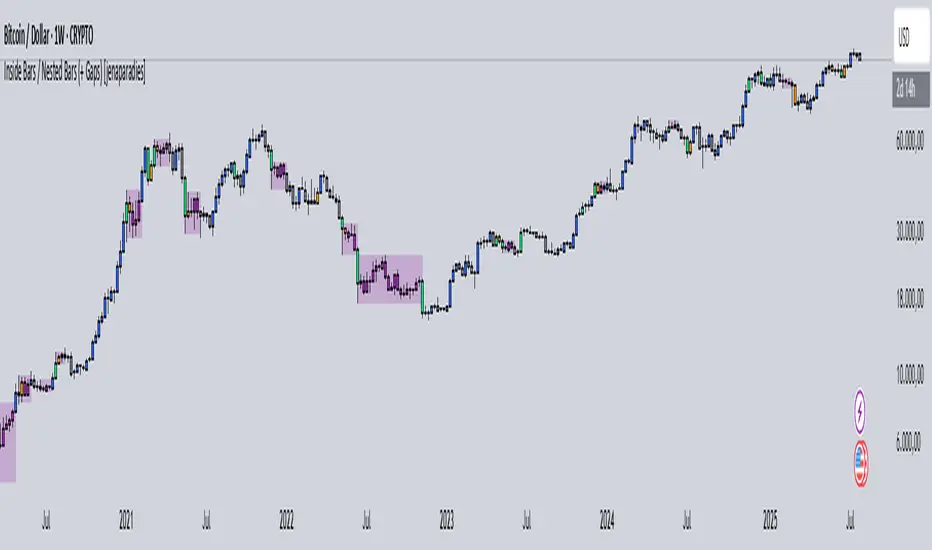
Inside Bars / Nested Bars (+ Gaps) [jenaparadies]📌 Features
Highlight inside bars
Highlight bars that remain within the range of a mother bar (called nested bars )
Highlight the mother bar (optional)
Highlight consecutive nested bars using a visual box (optional)
Enable no-gap candle logic (optional, see below)
Show no-gap candles on the chart (optional)
Fully customizable colors and appearance
📌 Method
An inside bar is any candle whose high is lower than or equal to the previous candle's high, and whose low is higher than or equal to the previous candle's low. In other words, the entire price action of the inside bar remains within the range of the previous candle without exceeding it. The preceding candle is referred to as the mother bar .
Occasionally, the candle following the inside bar may break above or below the inside bar's range, while still remaining fully within the high and low of the mother bar. These candles are referred to as nested bars and are highlighted in a different color.
Optionally, sequences of consecutive nested bars can be enclosed within a box to emphasize consolidation zones.
📌 No-Gap Candles (Optional)
This feature adjusts each candle’s opening price so that it matches the closing price of the previous candle. It is particularly useful for assets that frequently experience large gaps between candles.
By extending each candle's effective range to include the previous candle's close, the indicator maintains structural consistency over timeframes, especially when the open price deviates significantly from the prior close. Inside bars are then identified relative to the extended range of the mother bar.
Optionally, the adjusted no-gap candles can be visualized directly on the chart for better clarity.
🎁 Bonus
Activating the "Show No-Gap Candles" option transforms any line chart into a gap-free bar chart ‒ ideal for visualizing economic data such as inflation rates.
RSI Z‑Score + TableRSI Z-Score + Table
This script calculates the Z-Score of the RSI (Relative Strength Index), which standardizes RSI based on its own recent history.
What It Shows:
RSI Z-Score = (Current RSI - Mean RSI) / Standard Deviation
This tells you how extreme the current RSI is compared to its historical values.
A table displays:
Current RSI
Rolling Mean
RSI Z-Score
How to Use:
Z-Score > +2 = Statistically overbought
Z-Score < -2 = Statistically oversold
Use it to time reversals or overextension in RSI behavior.
🔒 Based on rolling lookback window — fully customizable.
Author:
Tags: #RSI #ZScore #Momentum #StatisticalEdge #MeanReversion #Crypto

Manual 1H Trend BackgroundThis TradingView Pine Script v6 indicator allows you to manually set the trend direction (based on your analysis of the 1-hour timeframe), and it will change the background color of your chart based on that input:
"Buy" → chart background turns green
"Sell" → chart background turns red
"Neutral" → no background color (transparent)

J值极值趋势跟随策略J-Zone & 检测3分钟周期信号
EMA 676均线上方只做多
EMA 676均线下方只做空
当J线达到极值100后,并且连续3根K线J OKX:ETHUSDT.P OKX:ETHUSDT.P 值连续上涨开始回落,开空单
当J线达到极值0后,并且连续3根K线J值连续下跌开始上涨,开多单
1. Only consider long positions when the price is above the EMA676.
2. Only consider short positions when the price is below the EMA676.
3. If the J value reaches the extreme of 100, and there are 3 consecutive candles where the J value increases, then the first downturn in J triggers a short entry.
4. If the J value reaches the extreme of 0, and there are 3 consecutive candles where the J value decreases, then the first upturn in J triggers a long entry.

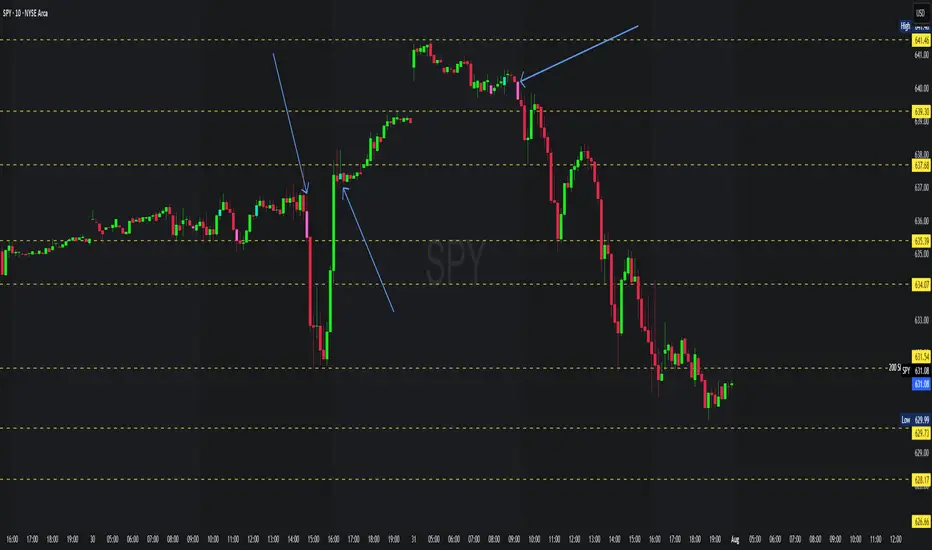
First Candle Low Break SignalTheory: If the SPY (or anything really) starts the day with a green candle, it never breaks below that candle on that day.
This indicator was quickly made to check that theory with some interesting results.
Requirement: The Symbol must be set to "extended trading hours", otherwise the script cannot see the changes between days.

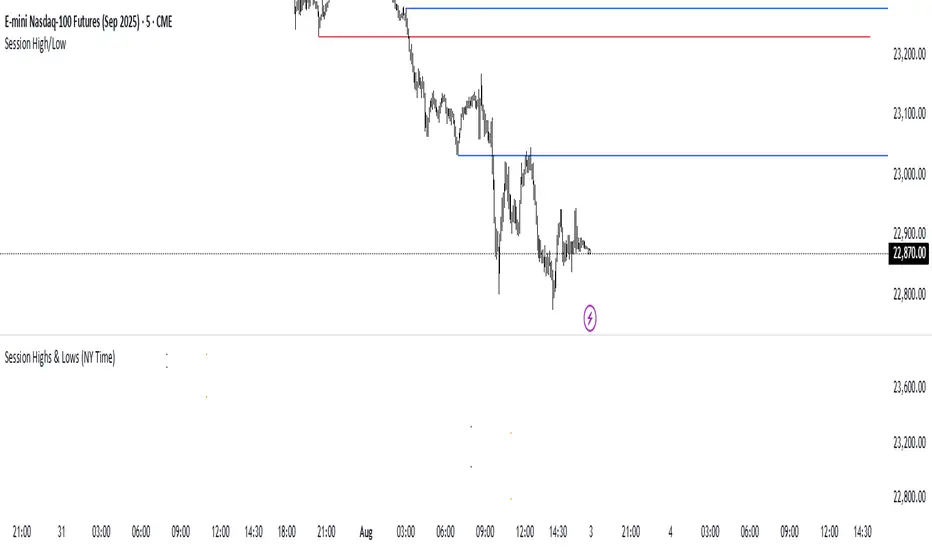
Asian & London Session High/LowMarks out asian session high and low, aswell as london session high and low, this makes it easier for you to have crucial key levels on your chart at all times

Session Highs & Lows (NY Time)Marks out Asian session high and low, and London session high and low, this makes it easier for you to easily marks out important highs and lows on the chart when trading.
EMA 10/20/60/120// This script plots four Exponential Moving Averages (10, 20, 60, 120)
// for trend-following analysis. Crossovers and the order of the EMAs can
// help identify the strength and direction of the trend.

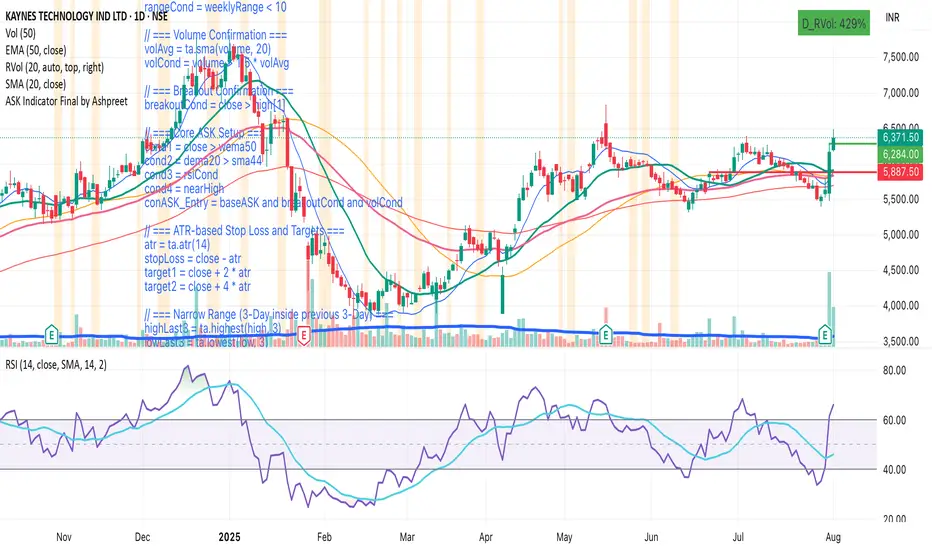
ASK Indicator by AshpreetThe ASK Indicator is a custom-built breakout and trend continuation system designed for swing traders seeking high-probability entries with strong risk-reward ratios. Built using a combination of moving averages, momentum filters, volume confirmation, and price structure, this indicator helps identify stocks poised for explosive moves.
It uses three key moving averages: the 44-period SMA (medium trend), 20-period DEMA (short-term strength, custom-coded), and 50-period WEMA (institutional trendline). Trades are only triggered when the price is above 50 WEMA, and the 20 DEMA is above the 44 SMA.
Momentum is confirmed using RSI(14) within a healthy zone of 40–60, ensuring the stock is not overbought or oversold. To focus on breakout candidates, the stock must be trading within 10% of its 52-week high, and the weekly candle range must be under 10%, signaling compression before expansion.
A valid ASK Signal occurs when these conditions are met along with a breakout above the previous day’s high and volume exceeding 1.5× the 20-day average. Once triggered, the indicator auto-plots the stop-loss (1× ATR) and two profit targets: 1:2 (TP1) and 1:4 (TP2).
Additionally, the system detects a narrow range setup, where the last 3 daily candles are inside the previous 3-day range — a powerful consolidation signal. Alerts for both ASK entries and narrow ranges are included.
This system is ideal for positional and short-term swing traders who want to combine structure, momentum, and volume in one powerful tool.
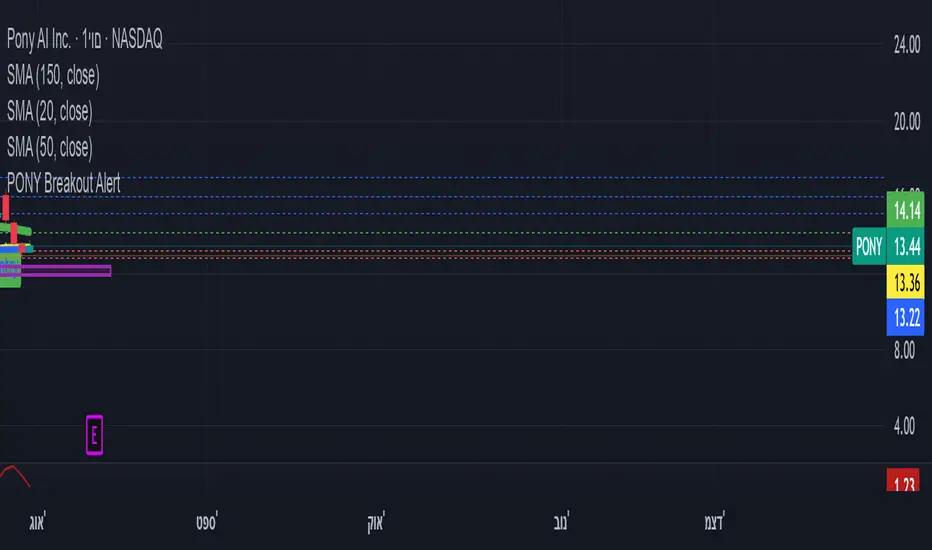
ombs- PONY Breakout Alert
🧠 תקציר הסקריפט: **PONY Breakout Alert 📈
🔍 **מטרה**:
לזהות **פריצה מעלה של רמת 14.15** תוך כדי **מחזור מסחר גבוה מהממוצע**, כדי לאתר **הזדמנות מסחר שורית**.
---
⚙️ רכיבי הסקריפט:
* 📌 **רמת כניסה**:
`entryLevel = 14.15`
* 📊 **תנאי כניסה**:
* סגירת מחיר **מעל 14.15**
* נפח מסחר **גבוה ב־20% מהממוצע ל־20 הימים האחרונים**
* 🔔 **התראה ויזואלית**:
* סמל ירוק "Entry" מופיע מתחת לנר על הגרף
* קווים קבועים לרמות יעד וסטופלוס
* 🎯 **יעדי רווח**:
* Target 1 – 15.15
* Target 2 – 16.00
* Target 3 – 17.00
* 🛑 **סטופלוס**:
* שמרני: 13.20
* אגרסיבי: 12.80
* 🔔 **התראה אוטומטית** (`alertcondition`):
תשלח הודעה:
*"PONY פרצה מעל 14.15 עם מחזור גבוה – שקול כניסה לעסקה."*
---
📝 מתאים עבור:
* סוחרי ניתוח טכני 🧮
* מי שמחפש כניסה מבוססת על פריצה + נפח 📊
* שימוש על גרף יומי בלבד 📅
---
🧠 Script Summary: PONY Breakout Alert 📈
🔍 Objective:
Detect a breakout above the 14.15 level accompanied by high trading volume, in order to identify a bullish trading opportunity.
⚙️ Script Components:
📌 Entry Level:
entryLevel = 14.15
📊 Entry Conditions:
Price closes above 14.15
Volume is 20% higher than the 20-day average
🔔 Visual Alert:
A green "Entry" label appears below the bar on the chart
Static horizontal lines mark targets and stop-loss levels
🎯 Profit Targets:
Target 1 – 15.15
Target 2 – 16.00
Target 3 – 17.00
🛑 Stop Loss:
Conservative: 13.20
Aggressive: 12.80
🔔 Automated Alert (alertcondition):
Sends a message:
"PONY has broken above 14.15 with high volume – consider a long position."
📝 Ideal For:
Technical traders 🧮
Those seeking breakouts confirmed by volume 📊
Daily chart setups only 📅
ICT OTE Market MakerICT OTE Market Maker
Implementing ICT and automatically identifies OTE zones to minimize drawdowns.
Wx2 Treasure Box – Institutional EntryBuy:-
Entry: Above the box
SL: Below the box
Sell:-
Entry :Below the box
SL: Above the box
RRR: 1:2
Best Location near 200MA
TF: Any TF
Watch My Video:
youtu.be

Wx2 Treasure Box Buy- Above the Box and Protect Below the Box
Sell- Below the Box Protect Above the Box
Go for Trigger Order
RRR: 1:2
Best Location is near 200SMA
Time Frame 2Min, 3Min, 5Min, & 15Min
Watch My Video
youtu.be
