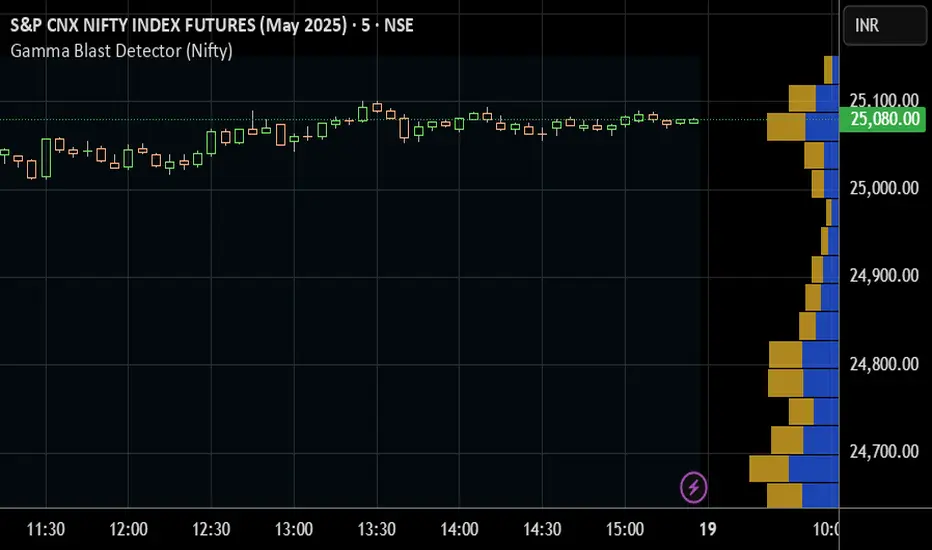
Gamma Blast Detector (Nifty)The Gamma Blast Detector (Nifty) is a custom TradingView indicator designed to help intraday traders identify sudden and explosive price movements—commonly referred to as "gamma blasts"—in the Nifty index during the final minutes of the trading session, particularly on expiry days. These movements are typically caused by rapid delta changes in ATM options, resulting in aggressive short-covering or option unwinding.
This indicator specifically monitors price action between 3:10 PM and 3:20 PM IST, which translates to 09:40 AM to 09:50 AM UTC on TradingView. It is optimized for use on 5-minute charts of the Nifty spot or futures index, where gamma-driven volatility is most likely to occur during this time window.
The core logic behind the indicator involves identifying unusually large candles within this time frame. It compares the size of the current candle to the average size of the previous five candles. If the current candle is at least twice as large and shows clear direction (bullish or bearish), the script flags it as a potential gamma blast. A bullish candle suggests a Call Option (CE) is likely to blast upward, while a bearish candle points to a Put Option (PE) gaining sharply.
When such a condition is detected, the indicator visually marks the candle on the chart: a "CE 🚀" label is shown below the candle for a bullish move, and a "PE 🔻" label appears above for a bearish move. It also includes alert conditions, allowing users to set real-time alerts for potential blasts and act quickly.
This tool is especially useful for expiry day scalpers, option traders, and anyone looking to ride momentum generated by gamma effects in the final minutes of the market. It provides a visual and alert-based edge to anticipate short-term, high-impact moves often missed in normal technical analysis.
Candlestick analysis
Plyo Tap'n'Slap (TnS) by OutOfOptionsThe Model
This Strategy/Model takes advantage of the strongest trend signature in the market, which is also the most basic move in the market. This basic move is what most traders consider to be a staircase, or trendline. ICT traders call this setup a “unicorn” which is just another word for when an Order block overlaps with an FVG. The beauty of this model is that you don't need to know what ANY of these things are.
The entry comes when a candles High or Low overlaps with a FVG that is at least 3 points away from both edges of the FVG. If the candle is too close to the edge then the setups is invalid (see rules for more). TO find a candle that overlaps with the FVG it also can not cut through any other price action, for example, A potential entry cant cut through another wick to make it overlap with the FVG. (see rules for more)
TnS gets its TP by analyzing what is called the "OG TP" The OG TP is determined by looking for the first tapped into the FVG, then looking for an immediate High or Low to the left of the candle that first tapped the FVG. IF there is no immediate High or low next to the candle that first tapped the FVG, then target the candle itself (see rules for more). IF the "OG TP" has already been hit before TnS gets its entry, then look to the left of the TnS entry candle for the immediate High or Low next to it. If there is no immediate High or Low next to the TnS Entry candle, then target the Entry candles, High or Low (see rules for more)
Model Rules
Overlapping H/L MUST be at least 3 points away from both edges of the FVG,
Overlapping H/L cannot cut through PA to make it overlap with the FVG,
Entries can only be the highest overlapping high or the lowest overlapping low,
If TnS Has already played out within the FVG then it should no longer be used,
If the FVGs OG TP has already been hit then use the TnS entry to re-align for your target,
No using NWOGs/NDOGs for setups. A NWOG is NOT the same thing as an FVG so this example
V2 Rules
If its a Bullish FVG then you need a bearish candle H/L that overlaps for your entry
If its a Bearish FVG then you need a bullish candle H/L that overlaps for your entry
Indicator Functionality
The indicator uses specific logic to identify FVGs that match the requirements of the TnS model, ensuring at least one valid entry exists per the default V1 rules of the model, or the stricter V2 rules if configured via settings. If entries (up to 2 per model rules) are identified, the FVG is highlighted, and each entry and its stop loss is marked with a line. The line styles, colors, and FVG color, which can vary depending on whether the entry is bullish or bearish, are configurable via settings.
Once the FVG is tapped into, the indicator will highlight the take profit spot and list all applicable entries, stop losses, and take profits in a table, the position and presence of which can be controlled within the indicator settings. When price action hits either stop loss or take profit, all elements are removed from the chart to avoid clutter.
Additionally, the indicator allows filtering of entries based on Risk/Reward (R:R), filtering out entries where take profit is less than the model stop loss and entries for which the stop loss resides inside the FVG itself. To help visualize setups where the FVG is outside the current visual range, the indicator has options to extend the FVG box and lines by a configurable number of bars. Once the FVG is tapped, the indicator will automatically extend lines/FVG box to the bar that tapped the FVG plus the configured number of bars.

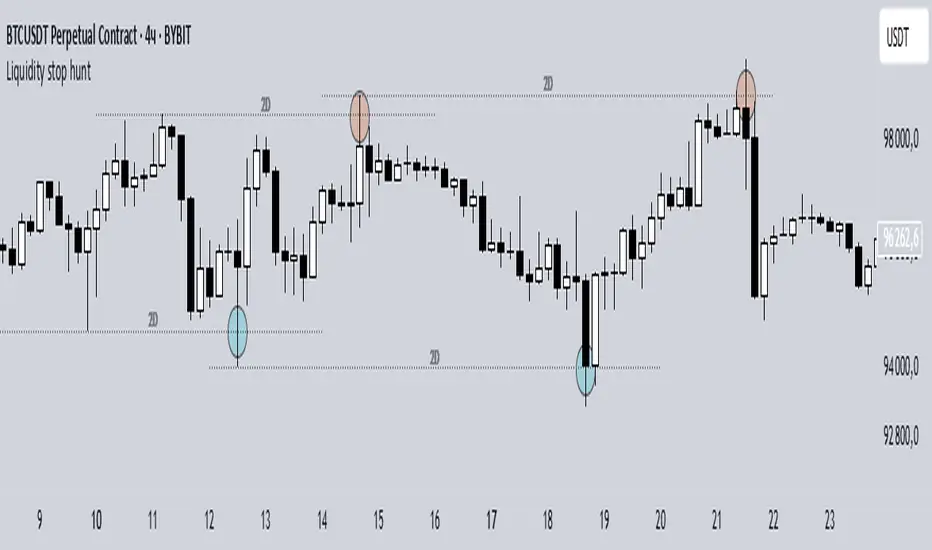
Liquidity stop huntThis tool identifies key liquidity zones where stop hunts are likely to occur.
**How it works:**
- Detects swing highs/lows on your selected timeframe.
- Marks levels where "liquidity sweeps" (fakeouts) often happen.
- Plots these zones as dotted lines for visual reference.
**How to use:**
1. Look for price rejections near marked levels.
2. Avoid placing stops too close to obvious liquidity zones.
3. Combine with price action for confirmation.
**Settings:**
- Timeframe: Choose the historical period for analysis (e.g., 1D, 1W).
- Sweep Type: "Wick Only" for precise tails, "Regular" for all breaks.
- Colors/Style: Customize appearance.
Note: Works best in trending markets. Not a standalone strategy — always confirm with additional analysis.
Another EMA/RSI trend indicatorAnother EMA/RSI trend indicator is a trend-following trade signal and back-testing tool. It leverages EMA, RSI, ATR, volume, and price breakouts to generate and track buy/sell signals, manage trades, and display performance statistics.
EMA (Exponential Moving Average): Used for identifying trend direction.
RSI (Relative Strength Index): Used to confirm momentum.
ATR (Average True Range): Used to calculate Stop Loss (SL) and Take Profit (TP) dynamically.
Volume: Only trades when current volume > average volume.
Price breakout filters: Detects bullish/bearish breakout candlesticks for signals.
Entry Logic
Entry placed slightly above/below current price using an ATR-based buffer.
Configurable SL and TP using ATR multipliers.
Optional: Stop existing trade on a new opposite signal.
Entry filters include price structure checks using highs/lows.
Visual output
Plots Buy/Sell signals on chart
Draws entry, SL, and TP lines for ongoing trades
Displays trade statistics in a table (top-right):
Trade count
Wins/Losses/Stopped
Win rate
Cumulative and average profit/loss
Start date
This is a semi-automated trading signal generator and visual back-tester aimed at helping traders:
Identify trend-based entry opportunities
Automate entry/exit evaluation using standard risk management
Evaluate performance with live stats

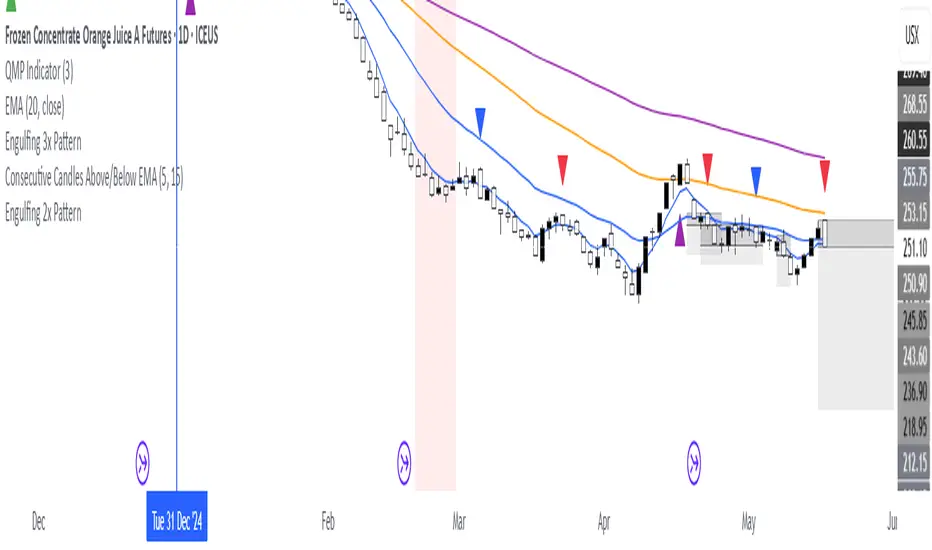
Consecutive Candles Above/Below EMADescription:
This indicator identifies and highlights periods where the price remains consistently above or below an Exponential Moving Average (EMA) for a user-defined number of consecutive candles. It visually marks these sustained trends with background colors and labels, helping traders spot strong bullish or bearish market conditions. Ideal for trend-following strategies or identifying potential trend exhaustion points, this tool provides clear visual cues for price behavior relative to the EMA.
How It Works:
EMA Calculation: The indicator calculates an EMA based on the user-specified period (default: 100). The EMA is plotted as a blue line on the chart for reference.
Consecutive Candle Tracking: It counts how many consecutive candles close above or below the EMA:
If a candle closes below the EMA, the "below" counter increments; any candle closing above resets it to zero.
If a candle closes above the EMA, the "above" counter increments; any candle closing below resets it to zero.
Highlighting Trends: When the number of consecutive candles above or below the EMA meets or exceeds the user-defined threshold (default: 200 candles):
A translucent red background highlights periods where the price has been below the EMA.
A translucent green background highlights periods where the price has been above the EMA.
Labeling: When the required number of consecutive candles is first reached:
A red downward arrow label with the text "↓ Below" appears for below-EMA streaks.
A green upward arrow label with the text "↑ Above" appears for above-EMA streaks.
Usage:
Trend Confirmation: Use the highlights and labels to confirm strong trends. For example, 200 candles above the EMA may indicate a robust uptrend.
Reversal Signals: Prolonged streaks (e.g., 200+ candles) might suggest overextension, potentially signaling reversals.
Customization: Adjust the EMA period to make it faster or slower, and modify the candle count to make the indicator more or less sensitive to trends.
Settings:
EMA Length: Set the period for the EMA calculation (default: 100).
Candles Count: Define the minimum number of consecutive candles required to trigger highlights and labels (default: 200).
Visuals:
Blue EMA line for tracking the moving average.
Red background for sustained below-EMA periods.
Green background for sustained above-EMA periods.
Labeled arrows to mark when the streak threshold is met.
This indicator is a powerful tool for traders looking to visualize and capitalize on persistent price trends relative to the EMA, with clear, customizable signals for market analysis.
Explain EMA calculation
Other trend indicators
Make description shorter
PSP Candel Analyzer V2.0PSP Candle Analyzer V2.0
Multi-Symbol Candle State & Session Open Table (Replay Mode Compatible)
Indicator Overview:
The PSP Candle Analyzer V2.0 is designed for fast, visual candle direction analysis and structural comparison across multiple markets or indices in various timeframes.
It is ideal for traders who monitor several related instruments (e.g., Nasdaq, S&P 500, Dow Jones) and need quick insight into price action and candle structure divergence.
Key Features
1. Ultra-Compact, Color-Coded Table:
Displays a table in the chart corner showing the state (up, down, neutral) of each selected symbol for multiple timeframes (5m to 6h).
Each row: a timeframe.
Each column: the first letter of each symbol, colored by candle direction (bright blue = up, bright red = down, bright yellow = neutral).
Clean, minimal design for maximum readability—even on small monitors.
2. Automatic & Flexible Symbol Selection:
The indicator always includes the active chart’s symbol as the first column, automatically.
You can add 1 to 4 extra symbols in the settings (up to 5 symbols total for comparison).
3. Structural Divergence Highlighting:
If one symbol’s candle direction differs from others in a given timeframe, that row is highlighted (bright green) for fast detection of cross-market divergences.
4. Session Opening Lines (Dynamic Lines):
Dotted lines are drawn for key session opens: 6:00, 8:30, and 9:30 (New York time).
Each line’s color, length, and visibility are fully customizable.
Labels (“6:00”, “8:30”, “9:30”) appear precisely at the end of each line, matching pro indicators like NYO/TDO.
5. 100% Replay Mode Compatible:
Unlike many table-based indicators, this version is fully compatible with TradingView’s Replay Mode:
Table, colors, and lines are always updated in real time as you step through history or use auto-play.
No lags, glitches, or delayed updates—tested and verified.
6. Fully Customizable & Minimalist:
Adjust the number of symbols, table font size, color themes, session line length, and more—all from the settings panel.
Table stays compact and legible, regardless of setup.
How to Use
Add the indicator to your chart.
The active chart symbol is automatically included in the table.
Use settings to add up to 4 more symbols for cross-market analysis (e.g., CME_MINI:ES1! for S&P500, CBOT_MINI:YM1! for Dow Jones, etc).
Instantly compare candle direction for all symbols and timeframes, with divergence rows highlighted.
Session open lines with precise time labels will be drawn on your chart (fully customizable).
Other Notes
No timezone issues: Session opens (6:00, 8:30, 9:30 NY) are always aligned with official market times.
Table remains ultra-compact and non-intrusive, even on small screens.
Replay Mode problem is fully solved—the table and dynamic lines always update in sync with price and candles in historical mode.
Keywords:
Candle Analyzer, Multi-Symbol Table, Session Open Lines, Replay Compatible, NASDAQ, S&P500, Dow Jones, CME, CBOT, Candle Structure, Market Divergence, Pine Script v6, Real-Time Table, Pro Trading Tools
Feedback, bug reports, or questions? Leave a comment or DM! Happy trading!

动态止损趋势指标Trend indicators edited by Happy in Chiang Mai,When the K-line is above the stop loss line, go long; when the K-line is below the stop loss line, go short. The stop loss line stops loss, which is applicable to the two-minute cycle.

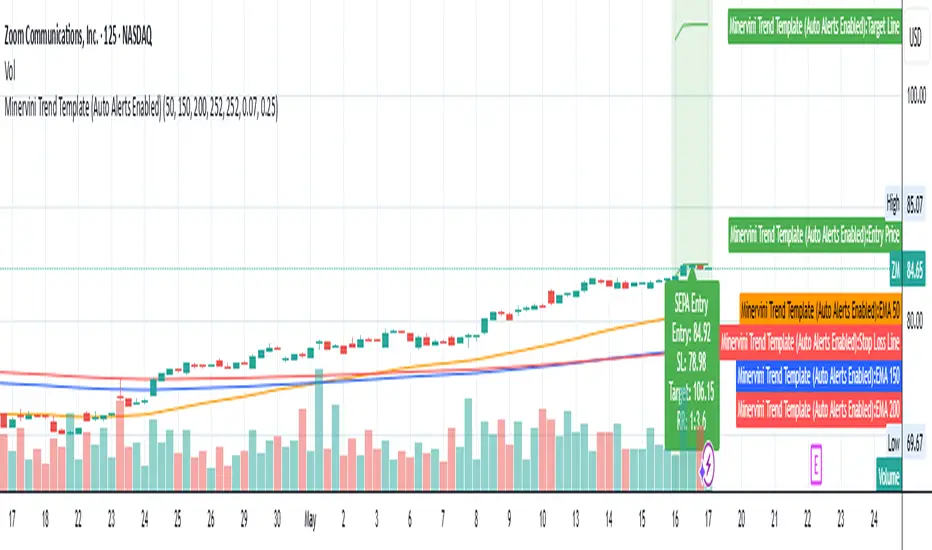
Minervini Trend Template (EMA)📄 Description:
This script is inspired by Mark Minervini’s SEPA (Specific Entry Point Analysis) strategy and adapts his famous Trend Template using Exponential Moving Averages (EMAs). It helps traders visually identify technically strong stocks that are in ideal buy conditions based on Minervini's rules.
📈 Strategy Logic:
This script scans for momentum breakouts by filtering stocks with the following characteristics:
✅ Buy Criteria (All Conditions Must Be Met):
Price above 50-day EMA
Price above 150-day EMA
Price above 200-day EMA
50-day EMA above 150-day EMA
150-day EMA above 200-day EMA
200-day EMA trending upward (greater than it was 20 days ago)
Price within 25% of its 52-week high
Price at least 30% above its 52-week low
If all 8 conditions are satisfied, the script triggers a SEPA Setup Signal. This is visually indicated by:
✅ A green background on the chart
✅ A label saying “SEPA Setup” under the bar
🛒 When to Buy:
Wait for the stock to break out above a recent base or consolidation pattern (like a cup-with-handle or flat base) on strong volume.
The ideal entry is within 5% of the breakout point.
Confirm that the SEPA conditions are met on the breakout day.
📉 When to Sell:
Place a stop-loss 5–8% below your entry price.
Exit if the breakout fails and price falls back below the pivot or the 50-day EMA.
Take partial profits after a 20–25% gain, and move your stop-loss up to breakeven or trail it using moving averages like the 21 or 50 EMA.
Exit fully if price closes below the 50-day or 150-day EMA on volume.
🧠 Why EMAs?
EMAs react faster to recent price action than SMAs, helping you catch earlier signals in fast-moving markets. This makes it especially useful for growth and momentum traders following Minervini’s high-performance approach.
📊 How to Use:
Apply the script to any stock chart (daily timeframe recommended).
Look for a green background + SEPA Setup label.
Combine with price/volume analysis, base patterns, and market context to time your entries.
🚨 Optional Alerts:
You can set an alert on the condition minerviniPass == true to notify you when a SEPA-compliant setup appears.
📚 This tool is meant for educational and research purposes. Always validate with your own due diligence and consult your risk plan before making any trades.
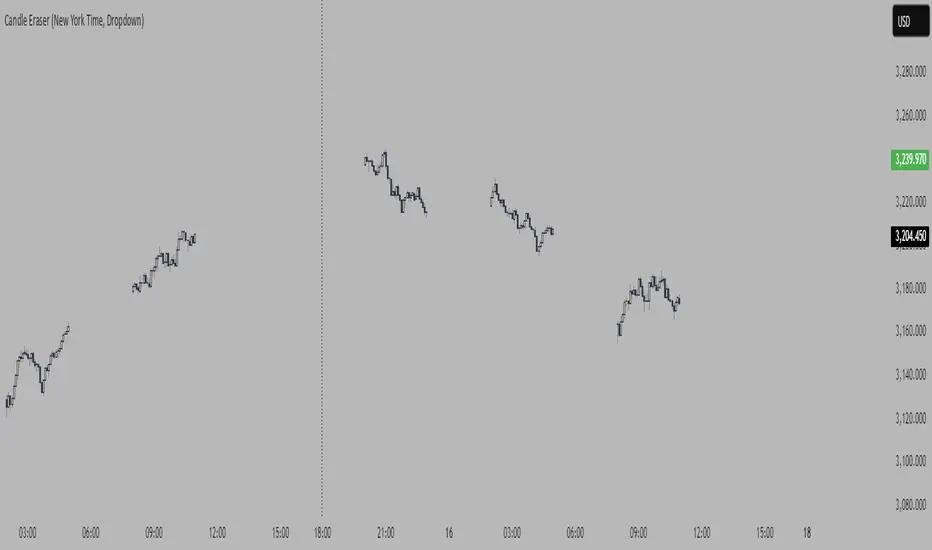
Candle Eraser (New York Time, Dropdown)If you want to focus on first 3 hours of Asia, London> and New York, inspired by Stacey Burke Trading 12 Candle Window Concept
- Set your time to UTC-4 New York
PnF ChartPoint and Figure (P&F) charts are a time-independent technical analysis tool that focuses purely on price movements, filtering out noise like minor price fluctuations and time. Unlike candlestick or bar charts, P&F charts ignore time and only record significant price changes based on predefined rules.
Key Characteristics of P&F Charts
No Time Axis
Only price movements matter; time is irrelevant.
Columns form based on reversals, not fixed time periods.
Uses X's and O's
X = Rising prices (demand in control)
O = Falling prices (supply in control)
Box Size (Price Increment)
Defines the minimum price change required to plot a new X or O.
Example: If the box size is **1∗∗,astockmustmoveatleast1∗∗,astockmustmoveatleast1 to record a new X or O.
Reversal Amount
Determines how much the price must reverse to switch from X's to O's (or vice versa).
Common reversal settings: 3-box reversal (price must reverse by 3x the box size).
How P&F Charts Work
1. Rising Prices (X-Columns)
A new X is added if the price rises by the box size.
If the price reverses down by the reversal amount, a new O-column starts.
2. Falling Prices (O-Columns)
A new O is added if the price falls by the box size.
If the price reverses up by the reversal amount, a new X-column starts.
Example of a P&F Chart
Suppose:
Box Size = $1
Reversal Amount = 3-box (i.e., $3)
Price Movement Chart Update
Stock rises from 10→10→11 X at $11
Rises to $12 X at $12
Drops to 9(9(12 → 9=9=3 drop) New O-column starts at 11,11,10, $9
Rises again to 12(12(9 → 12=12=3 rise) New X-column at 10,10,11, $12
About the Script:This Script uses columns instead of traditional X and O boxes.Column Printing (Red vs Green)
This Point and Figure chart alternates between two states:
X columns (green): Represent upward price movements
O columns (red): Represent downward price movements
When Green Columns (X) Are Printed:
A green column is printed when:
The script is in "X mode" (is_x is true)
A new column is created (new_column_created is true)
This happens after the price has reversed upward by at least the "reversal boxes" threshold from a previous O column
When Red Columns (O) Are Printed:
A red column is printed when:
The script is in "O mode" (is_x is false)
A new column is created (new_column_created is true)
This happens after the price has reversed downward by at least the "reversal boxes" threshold from a previous X column
How Trendlines Are Created
The script can draw two types of trendlines when the show_trendlines option is enabled:
Green Trendlines (Uptrend):
A green trendline is created when:
There's a transition from O to X columns (cond2 is true but wasn't true on the previous bar)
This represents the beginning of a potential uptrend
The trendline is solid and extends to the right
Red Trendlines (Downtrend):
A red trendline is created when:
There's a transition from X to O columns (cond1 is true but wasn't true on the previous bar)
This represents the beginning of a potential downtrend
The trendline is dashed and extends to the right
The script maintains two trendline objects - current_trendline and previous_trendline - and deletes the oldest one when a new trendline is created to prevent cluttering the chart.
In summary, this Point and Figure chart tracks price movements in discrete boxes and changes column types (and creates trendlines) when price reverses by a significant amount (defined by the reversal_boxes parameter). The chart also generates alerts when these trend changes occur, helping traders identify potential trend reversals.
Impulse Zones | Flux Charts💎 GENERAL OVERVIEW
Introducing our new Impulse Zones indicator, a powerful tool designed to identify significant price movements accompanied by strong volume, highlighting potential areas of support and resistance. These Impulse Zones can offer valuable insights into market momentum and potential reversal or continuation points. For more information about the process, please check the "HOW DOES IT WORK ?" section.
Impulse Zones Features :
Dynamic Zone Creation : Automatically identifies and plots potential supply and demand zones based on significant price impulses and volume spikes.
Customizable Settings : Allows you to adjust the sensitivity of zone detection based on your trading style and market conditions.
Retests and Breakouts : Clearly marks instances where price retests or breaks through established Impulse Zones, providing potential entry or exit signals.
Alerts : You can set alerts for Bullish & Bearish Impulse Zone detection and their retests.
🚩 UNIQUENESS
Our Impulse Zones indicator stands out by combining both price action (impulsive moves) and volume confirmation to define significant zones. Unlike simple support and resistance indicators, it emphasizes the strength behind price movements, potentially filtering out less significant levels. The inclusion of retest and breakout visuals directly on the chart provides immediate context for potential trading opportunities. The user can also set up alerts for freshly detected Impulse Zones & the retests of them.
📌 HOW DOES IT WORK ?
The indicator identifies bars where the price range (high - low) is significantly larger than the average true range (ATR), indicating a strong price movement. The Size Sensitivity input allows you to control how large this impulse needs to be relative to the ATR.
Simultaneously, it checks if the volume on the impulse bar is significantly higher than the average volume. The Volume Sensitivity input governs this threshold.
When both the price impulse and volume confirmation criteria are met, an Impulse Zone is created in the corresponding direction. The high and low of the impulse bar define the initial boundaries of the zone. Zones are extended forward in time to remain relevant. The indicator manages the number of active zones to maintain chart clarity and can remove zones that haven't been touched for a specified period. The indicator monitors price action within and around established zones.
A retest is identified when the price touches a zone and then moves away. A break occurs when the price closes beyond the invalidation point of a zone. Keep in mind that if "Show Historic Zones" setting is disabled, you will not see break labels as their zones will be removed from the chart.
The detection of Impulse Zones are immediate signs of significant buying or selling pressure entering the market. These zones represent areas where a strong imbalance between buyers and sellers has led to a rapid price movement accompanied by high volume. Bullish Impulse Zones act as a possible future support zone, and Bearish Impulse Zones act as a possible future resistance zone. Retests of the zones suggest a strong potential movement in the corresponding direction.
⚙️ SETTINGS
1. General Configuration
Show Historic Zones: If enabled, invalidated or expired Impulse Zones will remain visible on the chart.
2. Impulse Zones
Invalidation Method: Determines which part of the candle (Wick or Close) is used to invalidate a zone break.
Size Sensitivity: Controls the required size of the impulse bar relative to the ATR for a zone to be detected. Higher values may identify fewer, larger zones. Lower values may detect more, smaller zones.
Volume Sensitivity: Controls the required volume of the impulse bar relative to the average volume for a zone to be detected. Higher values require more significant volume.
Labels: Toggles the display of "IZ" labels on the identified zones.
Retests: Enables the visual highlighting of retests on the zones.
Breaks: Enables the visual highlighting of zone breaks.

EMA Retest Signal Indicator (Indicator)EMA Retest Signal Indicator (Strict + Loose)
Overview:
This indicator is designed for active traders who want to identify high-probability retraction (pullback) opportunities within confirmed EMA trends. It highlights two categories of signal candles—strict and loose—based on how price interacts with fast and slow EMAs, giving you clear, visually-coded signals for both trend continuation and optimal entries.
How It Works
EMA Trend Confirmation:
The script uses a fast EMA (default 13) and a slow EMA (default 48). Trend confirmation occurs only after a user-defined number of candles have closed beyond an EMA crossover, filtering out false or premature trend shifts.
Strict Retraction Signals:
These appear when a retraction candle pulls back and tests both the fast and slow EMAs before resuming in the direction of the main trend. These are typically higher-confidence signals.
Loose Retraction Signals:
Designed to catch “shallower” or more flexible pullbacks. These signal when the candle either:
Touches only the fast EMA (but stays above/below slow EMA), or
Comes within a configurable maximum number of ticks from the slow EMA (but does not need to touch either EMA).
Blue diamonds indicate fast EMA tests; yellow diamonds indicate pure distance-based signals.
Chop Filter:
The script automatically suppresses signals if it detects the trend has shifted more than once within a configurable recent bar window (default: last 10 candles). This helps you avoid signals during choppy or sideways markets.
Trading Window Highlighting:
Optionally highlights your preferred trading hours on the chart background for visual clarity.
Inputs & Settings
Fast EMA & Slow EMA lengths
Number of bars to confirm trend after EMA crossover
Toggle for displaying strict/loose retraction signals
Maximum allowed tick distance for loose signals (yellow diamonds)
“Chop filter” (bars to look back for trend shifts)
Optional: show/hide trend background highlights
Visual Signals
Green triangle up: Strict long entry candidate
Red triangle down: Strict short entry candidate
Blue diamond: Loose retraction signal, tested fast EMA
Yellow diamond: Loose retraction signal, within max distance from slow EMA
Who Is This For?
Day traders and scalpers seeking precise pullback entries in strong trends
Algo/system traders wanting robust, visually intuitive signal logic
Anyone who wants an advanced, trend-following indicator for futures, forex, crypto, or equities
Usage Tips
Use in combination with your risk management and other confirmation tools.
Tune the “max loose ticks” and trend confirmation bars for your preferred market/volatility.
Strict retractions are usually higher confidence; loose can help catch moves that don’t quite reach the EMAs.
Note: This indicator is not financial advice and should be tested in a demo or backtest environment before live use.

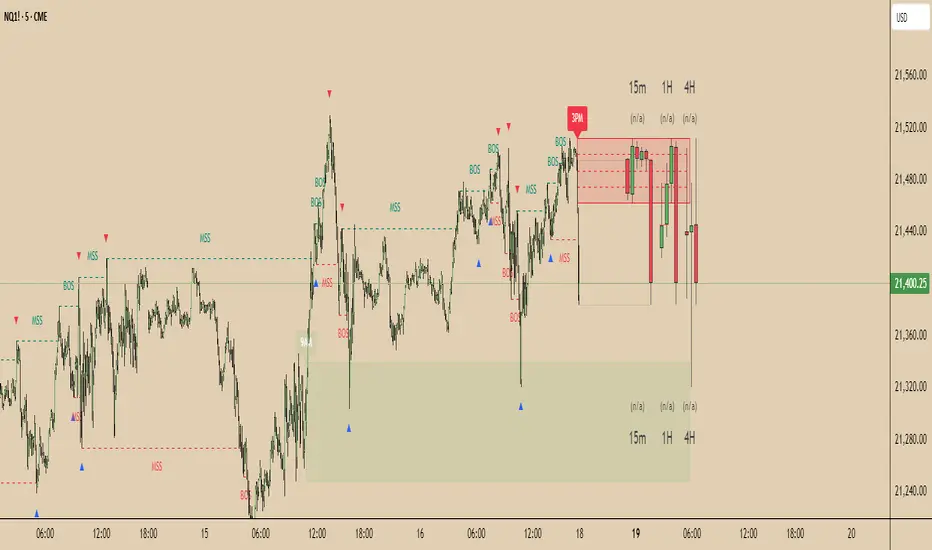
TBR(3AM, 9AM, 3PM)How It Works
• Monitors 3 key institutional hours: 3AM (London Open), 9AM (New York Open), and 3PM (US Close)
• Captures the full range (high and low) of each 1H candle at those times
• Confirms breakout only if the next 1H candle closes above or below the range
• Draws the zone (box) aligned with the original hourly candle (not delayed)
• Displays retracement lines at:
- 25% (initial reaction)
- 50% (mitigation level)
- 75% (deep retracement entry)
Key Features
• Precise zone alignment — Boxes are anchored to the actual breakout candle
• Mitigation logic — Zones are considered mitigated once price revisits the 0.5 level
• Expiry filter — Zones automatically remove after 7 days
• Time zone support — Choose from major time zones or fixed UTC offsets (e.g., Etc/GMT+4)
• Multi-timeframe compatible — Works on all timeframes (1m, 5m, 15m, etc.)
• Clean structure — No duplicated boxes on lower timeframes
• Fully customizable colors and visibility toggles
Settings
• Toggle visibility for 3AM / 9AM / 3PM zones independently
• Choose time zone (supports America/New_York, UTC, Asia/Tokyo, etc.)
• Adjust how long zones stay visible (in hours)
• Enable/disable auto-removal after mitigation
Ideal For
• ICT traders
• Smart money concepts (SMC)
• Zone-based entries and liquidity grabs
• Traders using mitigation and premium/discount retracement logic
Tip
• Use this script with liquidity/volume indicators or SMT divergence for even stronger confluence.
Metrics TJ
📘 Metrics TJ
Author: Trade Journey
Type: Market Metrics / Intraday
Timeframes:
Context: 1H
Entry Points: 15m
---
🎯 Core Idea
Metrics TJ is a powerful market metrics tool designed for intraday traders. It provides essential market data — including volume, ATR (Average True Range), and correlation with other assets — to help you make informed decisions. By combining multiple indicators into a unified view, this tool allows you to spot key trends, volatility, and relative strength within a single chart.
---
🔍 Strategy Logic
1. Context (1H)
Before making intraday decisions on smaller timeframes (such as the 15m chart), use the 1H timeframe to understand the broader market context:
Look at candle structure, levels, volume, and other signals to identify if the market is trending or consolidating.
Example: If the 1H chart shows rising volume and a series of higher highs and lows, it indicates an uptrend.
2. Core Metrics
Day Volume (DV): Total volume traded over the past 24 hours. A sharp increase may indicate increased market interest and potential for higher volatility.
Average Volume (AV): A smoothed average volume over a set period. Spikes in average volume can highlight unusual activity, signaling potential moves.
ATR (NATR): Measures the market's volatility. A high ATR means the market is moving more dynamically, often correlating with larger price moves.
Correlation (CR): Measures how strongly the asset is correlated with a reference pair, such as BTC. A strong positive or negative correlation could indicate an impending move or reversal.
3. Trade Filter
To improve the accuracy of the strategy:
Use Volume and ATR thresholds to filter out low-volatility or range-bound conditions.
Correlation with a reference asset helps identify when the market's behavior diverges from its usual pattern.
---
📈 Example of Entry Logic
1. On 1H: The market is in a confirmed uptrend, with rising volume and a series of higher highs.
2. On 15m: You observe an increase in Day Volume and Average Volume signaling potential for a breakout.
3. ATR is high, showing the market is volatile — indicating a good environment for intraday trading.
4. Correlation with BTC shows strong positive correlation, suggesting a price move in sync with the larger crypto market.
5. Trade Decision:
Enter long if the conditions are met: Volume spikes, ATR confirms volatility, and correlation supports the price direction.
Exit if volume decreases, ATR drops, or if the correlation weakens.
---
⚙️ Settings
(tradingview\.com/x/Y6PjccKy/)
---
📊 Why It Works
Day Volume and Average Volume help identify unusual activity, potentially signaling a price move.
ATR highlights periods of high volatility, which are crucial for intraday trading.
Correlation with major assets (like BTC) gives additional context on the market's broader movement, improving the probability of profitable trades.
Using a combination of volume and ATR reduces the likelihood of false signals, especially in choppy or low-volume environments.
---
🔔 Recommendations
Best used in strong trending markets where volume and volatility are in sync.
Avoid trading in range-bound conditions where price action lacks momentum.
Use this strategy as a supplement to other technical indicators or as part of a larger trading system.
---
✅ Conclusion
Metrics TJ provides a holistic view of the market, combining key metrics to help traders make smarter intraday decisions. By focusing on volume, volatility, and correlation, it can help you spot high-probability trades and avoid noise.
Try it on demo, adjust the settings to fit your trading style, and start identifying profitable opportunities!
---
📌 Important Note:
This indicator is best used in combination with higher timeframe analysis. Always consider the broader market context before making any trades.

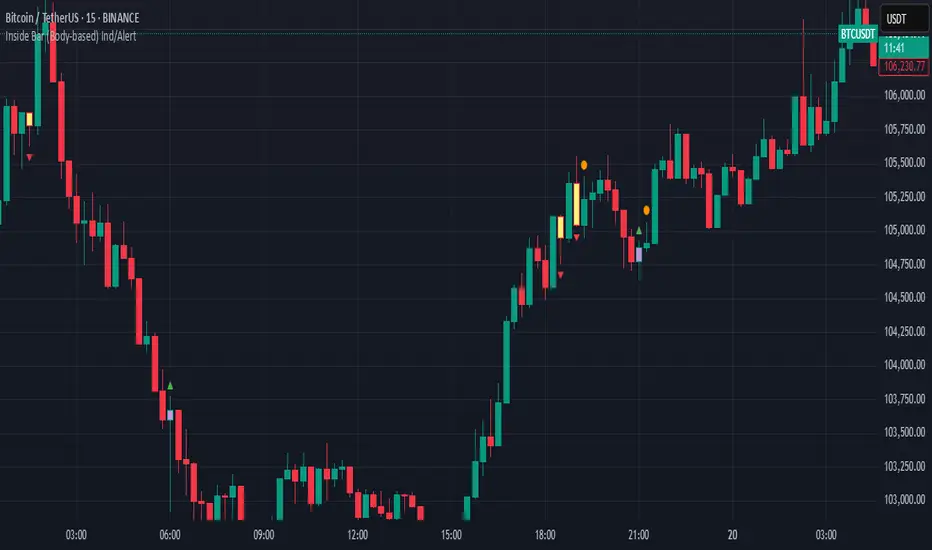
Inside Bar (Body-based) Ind/AlertDescription:
This indicator detects Inside Bar patterns based strictly on the candle body (open/close range) of the mother candle, rather than the traditional high/low wick method. An inside bar is highlighted when the current candle’s entire body is contained within the body of the previous candle.
It can be useful for traders who want a more conservative and reliable definition of inside bars, focusing on true consolidation periods and filtering out signals caused by extended wicks.
Features:
Body-based Inside Bar detection:
The indicator colors and marks candles where the current bar’s body is fully within the previous bar’s body.
Bullish/Bearish identification:
Bullish inside bars are marked in green, bearish in red.
Double Inside Bar Detection:
An optional feature marks when two consecutive candles’ bodies are inside the same mother bar body—potentially indicating stronger consolidation.
Alerts:
Set alerts for single or double inside bars for automated monitoring.
How to Use:
Add the indicator to your chart.
Look for colored bars or plotted shapes for inside bar signals based on candle bodies.
Use alerts to get notified in real time when inside bar patterns appear.
Note:
This script uses only the candle body (open and close) for inside bar calculations, which may help filter out less reliable signals found with wick-based approaches.
MMM @MaxMaserati 2.0MMM @MaxMaserati 2.0 - TradingView Indicator
The Backbone of the Max Maserati Method
The MMM @MaxMaserati 2.0 indicator is the core of the proprietary Max Maserati Method (MMM), a trading system designed to decode institutional price action. It integrates candle bias analysis, market structure identification, volume-based signals, and precise entry zones to align traders with smart money.
Core Components of the MMM System
1. Six Core Candle Classifications
Master these patterns to reveal institutional behavior:
Bullish Body Close: Closes above previous high, signaling strong buying.
Bearish Body Close: Closes below previous low, indicating intense selling.
Bullish Affinity: High tests previous low, closes within range, showing hidden bullish strength.
Bearish Affinity: Low tests previous high, closes within range, reflecting bearish pressure.
Seek & Destroy: Breaks both previous high/low, closes inside, direction depends on close.
Close Inside: High/low within previous range, bias based on close.
2. Plus/Minus Strength System
Quantifies candle conviction:
Bullish Strength: Low to close distance.
Bearish Strength: High to close distance.
Plus (+): Dominant strength signals strong follow-through.
Minus (-): Balanced strengths suggest caution.
3. PO4 Candles (Power of OHLC (4))
Analyzes OHLC for body-closed candles after swing high/low fractals:
C2: Body close above high/below low post fractal with strength conditions.
C3: Stronger body close with pronounced low/high breakouts.
C4: Body close which show strength and might trigger a BeB/BuB
Visualization: Green (bullish), purple (bearish) bars; triangle markers for fractals.
4. MC2 (High Volume Reversal Candles)
High buy/sell volume candles reversed by opposing volume:
Bullish MC2: Buy volume flipped by sell volume, signaling exhaustion.
Bearish MC2: Sell volume flipped by buy volume, indicating reversal.
Visualization: Dark green (bullish), dark red (bearish) bars.
5. MMM Blocks (eBlocks and iBlocks)
Marks institutional order blocks:
External Blocks (eBlocks): At market structure changes (MSC), labeled BuB/BeB.
Internal Blocks (iBlocks): Within trends, labeled L/S.
Volume: Normalized with indicators (🔥 high, ↑ above average, ↓ low).
Filters: Discount (0-50), premium (50-100), extreme (0-20, 80-100), mid-range (20-50, 50-80).
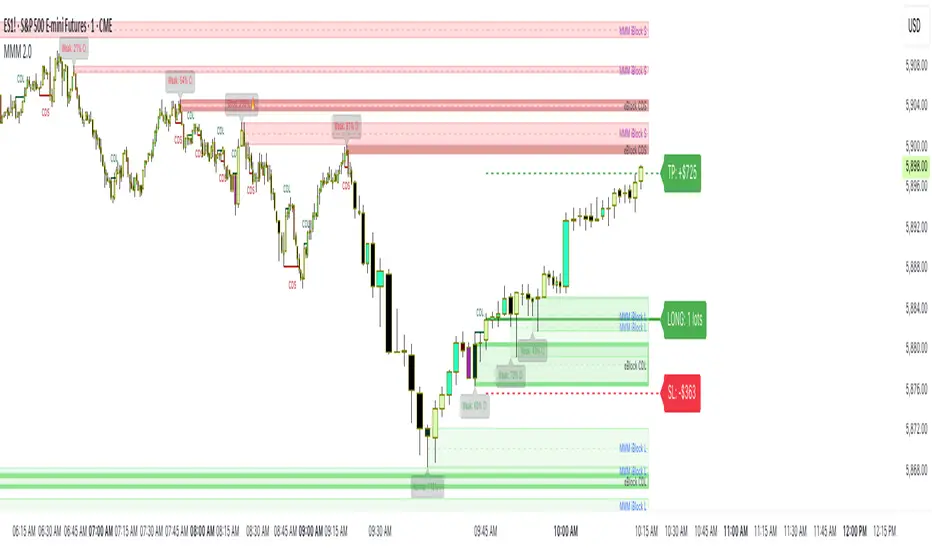
6. Entry Blocks - Specific Entry Areas
Entry Blocks are precise zones for framing trades based on the MMM system, triggered post-MSC to capitalize on institutional momentum:
Purpose: Pinpoint high-probability entry areas following a Market Structure Change (MSC), aligning with smart money direction.
Formation:
MMM Entry Block Long: Forms after a bullish MSC (BuB), typically at the swing low (e.g., lowerValueMSC) of the fractal pattern, marking a long entry zone.
MMM Entry Block Short: Forms after a bearish MSC (BeB), typically at the swing high (e.g., upperValueMSC), marking a short entry zone.
Styles :
Close-to-Swing High/Low: Box drawn from the candle’s close to the swing high/low level, emphasizing the fractal pivot.
High/Low-to-Close: Box drawn from the candle’s high/low to its close, capturing the full price action range.
Visualization:
Labeled “MMM Entry Block Long” (cyan background/border) or “Short” (pink background/border).
Includes a dashed midline for reference.
Volume displayed if enabled, normalized with markers (🔥 >150%, ⚡ >120%, ❄️ <70%).
Behavior:
Deletes when price touches the level (On Level Touch) or closes beyond it (On Candle Close)
Limited to a configurable number ( default 5) to avoid clutter.
Trade Framing:
Entry: Enter within the eBreak box, ideally on a pullback or confirmation candle aligning with MMM bias (e.g., Bullish Body Close or Affinity).
Stop-Loss: Placed below the eBreak low (bullish) or above the high (bearish), leveraging the swing level as support/resistance.
Take-Profit: Targets higher timeframe high (bullish) or low (bearish), with ratio (default 2.0) for risk-reward.
MMM Integration: Use candle bias (Plus/Minus), PO4 signals, and MMPD consensus to confirm entry direction and strength.
Significance: eBreaks frame trades by isolating institutional entry points post-MSC, reducing noise and enhancing precision.
7. Market Structure Change (MSC)
Tracks structure shifts:
Detection: Fractal highs/lows with adjustable candle count.
Visualization: Green (BuB), red (BeB) lines/labels; numbered breaks (Bub1/Beb1).
Counter: Tracks consecutive MSCs for trend strength.
8. MMPD (Market Momentum Price Delivery)
Analyzes momentum/trend:
Conditions: Red (bearish), Green (bullish), Pink (modifying bearish), Pale Green (modifying bullish).
Traps: Flags bullish/bearish traps when MMPD conflicts with body close.
Metrics: SuperMaxTrend, momentum (K/D), MMPD level.
Consensus: Rated signals (e.g., “Very Strong Buy ★★★★★”).
9. Trade and Risk Management
Disciplined trading:
Entry Visualization: Entry, stop-loss, take-profit lines/labels with customizable risk (riskAmount, default $50) and reward (ratio).
Behavior: Shows last/all entries, removes on MSC shift or breach.
Text Size: Tiny, Small, Normal.
NB: The Trade and risk management is to use with caution, it is not fully implemented yet.
10. Stats Table
Real-time dashboard:
Elements: Timeframe, symbol, candle bias, strength, MMPD, momentum, SuperMaxTrend, MMPD level, volume, consensus, divergence, delta MA, price delivery, note (“Analyze | Wait | Repeat”).
Customization: Position, size, element visibility.
Colors: Green (bullish), red (bearish), orange (warnings), gray (neutral).
11. Delta MA and Divergence
Monitors volume delta:
Delta MA: Smoothed delta with direction arrows (↗↘→).
Divergence: Flags MMPD-momentum divergences (⚠️).
Key Features
Automated Analysis: Detects PO4, MSC, blocks, MC2, Entry Block via OHLC.
Color-Coded Visualization: Bars, lines, table cells reflect bias/strength.
Dynamic Bias Lines: Higher timeframe high/low lines with labels.
Volume Analysis: Normalized volume across blocks, entries, MC2.
Flexible Filters: Tailors block/entry Block display to strategies.
Real-Time Metrics: Tracks strength, delta, trend points.
Trading Advantages
Institutional Insight: Decodes manipulation via OHLC and volume.
Early Reversals: Spots shifts via PO4, MC2, MSC, Entry Blocks.
Precise Entries: entry block frame high-probability trades.
Robust Risk Management: Stop-loss, take-profit, risk-reward.
Simplified Complexity: Actionable signals from complex action.
Profit Target Framework
Bullish: Higher timeframe high.
Bearish: Higher timeframe low.
Plus Strength: Direct move.
Minus Strength: Pullbacks expected.
Entry Blocks/MSC-Driven: Entry anchor entries to MSC targets.
Trader’s Mantra
“Analyze | Wait | Repeat” - Discipline drives profits.
The MMM @MaxMaserati 2.0 indicator, with Entry Blocks as specific trade-framing zones, offers a professional-grade framework for precise, institutional-aligned trading.
Note: Based on the proprietary Max Maserati Method for educational and analytical use.
Enigma Sniper 369The "Enigma Sniper 369" is a custom-built Pine Script indicator designed for TradingView, tailored specifically for forex traders seeking high-probability entries during high-volatility market sessions.
Unlike generic trend-following or scalping tools, this indicator uniquely combines session-based "kill zones" (London and US sessions), momentum-based candle analysis, and an optional EMA trend filter to pinpoint liquidity grabs and reversal opportunities.
Its originality lies in its focus on liquidity hunting—identifying levels where stop losses are likely clustered (around swing highs/lows and wick midpoints)—and providing visual entry zones that are dynamically removed once price breaches them, reducing clutter and focusing on actionable signals.
The name "369" reflects the structured approach of three key components (session timing, candle logic, and trend filter) working in harmony to snipe precise entries.
What It Does
"Enigma Sniper 369" identifies potential buy and sell opportunities by drawing two types of horizontal lines on the chart during user-defined London and US
session kill zones:
Solid Lines: Mark the swing low (for buys) or swing high (for sells) of a trigger candle, indicating a potential entry point where stop losses might be clustered.
Dotted Lines: Mark the 50% level of the candle’s wick (lower wick for buys, upper wick for sells), serving as a secondary confirmation zone for entries or tighter stop-loss placement.
These lines are plotted only when specific candle conditions are met within the kill zones, and they are automatically deleted once the price crosses them, signaling that the liquidity at that level has likely been grabbed. The indicator also includes an optional EMA filter to ensure trades align with the broader trend, reducing false signals in choppy markets.
How It Works
The indicator’s logic is built on a multi-layered approach:
Kill Zone Timing: Trades are only considered during user-defined London and US session hours (e.g., London from 02:00 to 12:00 UTC, as seen in the screenshots). These sessions are known for high volatility and liquidity, making them ideal for capturing institutional moves.
Candle-Based Momentum Logic:
Buy Signal: A candle must close above its midpoint (indicating bullish momentum) and have a lower low than the previous candle (suggesting a potential liquidity grab below the previous swing low). This is expressed as close > (high + low) / 2 and low < low .
Sell Signal: A candle must close below its midpoint (bearish momentum) and have a higher high than the previous candle (indicating a potential liquidity grab above the previous swing high), expressed as close < (high + low) / 2 and high > high .
These conditions ensure the indicator targets candles that break recent structure to hunt stop losses while showing directional momentum.
Optional EMA Filter: A 50-period EMA (customizable) can be enabled to filter signals based on trend direction.
Buy signals are only generated if the EMA is trending upward (ema_value > ema_value ), and sell signals require a downward EMA trend (ema_value < ema_value ). This reduces noise by aligning entries with the broader market trend.
Liquidity Levels and Deletion Logic:
For a buy signal, a solid green line is drawn at the candle’s low, and a dotted green line at the 50% level of the lower wick (from the candle body’s bottom to the low).
For a sell signal, a solid red line is drawn at the candle’s high, and a dotted red line at the 50% level of the upper wick (from the body’s top to the high).
These lines extend to the right until the price crosses them, at which point they are deleted, indicating the liquidity at that level has been taken (e.g., stop losses triggered).
Alerts: The indicator includes alert conditions for buy and sell signals, notifying traders when a new setup is identified.
Underlying Concepts
The indicator is grounded in the concept of liquidity hunting, a strategy often employed by institutional traders. Markets frequently move to levels where stop losses are clustered—typically just beyond swing highs or lows—before reversing in the opposite direction. The "Enigma Sniper 369" targets these moves by identifying candles that break structure (e.g., a lower low or higher high) during high-volatility sessions, suggesting a potential sweep of stop losses. The 50% wick level acts as a secondary confirmation, as this midpoint often represents a zone where tighter stop losses are placed by retail traders. The optional EMA filter adds a trend-following element, ensuring entries are taken in the direction of the broader market momentum, which is particularly useful on lower timeframes like the 15-minute chart shown in the screenshots.
How to Use It
Here’s a step-by-step guide based on the provided usage example on the GBP/USD 15-minute chart:
Setup the Indicator: Add "Enigma Sniper 369" to your TradingView chart. Adjust the London and US session hours to match your timezone (e.g., London from 02:00 to 12:00 UTC, US from 13:00 to 22:00 UTC). Customize the EMA period (default 50) and line styles/colors if desired.
Identify Kill Zones: The indicator highlights the London session in light green and the US session in light purple, as seen in the screenshots. Focus on these periods for signals, as they are the most volatile and likely to produce liquidity grabs.
Wait for a Signal: Look for solid and dotted lines to appear during the kill zones:
Buy Setup: A solid green line at the swing low and a dotted green line at the 50% lower wick level indicate a potential buy. This suggests the market may have grabbed liquidity below the swing low and is now poised to move higher.
Sell Setup: A solid red line at the swing high and a dotted red line at the 50% upper wick level indicate a potential sell, suggesting liquidity was taken above the swing high.
Place Your Trade:
For a buy, set a buy limit order at the dotted green line (50% wick level), as this is a more conservative entry point. Place your stop loss just below the solid green line (swing low) to cover the full swing. For example, in the screenshots, the market retraces to the dotted line at 1.32980 after a liquidity grab below the swing low, triggering a buy limit order.
For a sell, set a sell limit order at the dotted red line, with a stop loss just above the solid red line.
Monitor Price Action: Once the price crosses a line, it is deleted, indicating the liquidity at that level has been taken. In the screenshots, after the buy limit is triggered, the market moves higher, confirming the setup. The caption notes, “The market returns and tags us in long with a buy limit,” highlighting this retracement strategy.
Additional Context: Use the indicator to identify liquidity levels that may be targeted later. For example, the screenshot notes, “If a new session is about to open I will wait for the grab liquidity to go long,” showing how the indicator can be used to anticipate future moves at session opens (e.g., London open at 1.32980).
Risk Management: Always set a stop loss below the swing low (for buys) or above the swing high (for sells) to protect against adverse moves. The 50% wick level helps tighten entries, improving the risk-reward ratio.
Practical Example
On the GBP/USD 15-minute chart, during the London session (02:00 UTC), the indicator identifies a buy setup with a solid green line at 1.32901 (swing low) and a dotted green line at 1.32980 (50% wick level). The market initially dips below the swing low, grabbing liquidity, then retraces to the dotted line, triggering a buy limit order. The price subsequently rises to 1.33404, yielding a profitable trade. The user notes, “The logic is in the last candle it provides new level to go long,” emphasizing the indicator’s ability to identify fresh levels after a liquidity sweep.
Customization Tips
Adjust the EMA period to suit your timeframe (e.g., a shorter period like 20 for faster signals on lower timeframes).
Modify the session hours to align with your broker’s timezone or specific market conditions.
Use the alert feature to get notified of new setups without constantly monitoring the chart.
Why It’s Useful for Traders
The "Enigma Sniper 369" stands out by combining session timing, momentum-based candle analysis, and liquidity hunting into a single tool. It provides clear, actionable levels for entries and stop losses, removes invalid signals dynamically, and aligns trades with high-probability market conditions. Whether you’re a scalper looking for quick moves during London open or a swing trader targeting session-based reversals, this indicator offers a structured, data-driven approach to trading.

ICT HTF Candles [Pro] (fadi)The ICT HTF Candles shows you multi-timeframe price action by plotting up to six higher timeframe candles on your chart, scaled to real price levels. Set candle counts per timeframe or toggle them off for a clean view, saving you time switching between charts. This helps you spot trends and reversals quickly, align trades with the market’s direction, and time setups like sweeps or bounces better. From scalping on the 1m to swinging on the 4H, it simplifies ICT and Smart Money Concepts (SMC), revealing trend shifts and institutional moves clearly. Once you use it, trading without this clarity just won’t feel right.
Key Features:
In-Depth Price Action Levels
These levels track ICT PD arrays and confluences across timeframes, making it easy to see how price action flows from higher timeframes and what your setup faces. Is your 5m trade about to run into a 1H bearish order block? Did it bounce off a higher timeframe FVG and create an SMT with a correlated asset? They make your chart a clear roadmap to market structure, helping you find strong setups, save time, and align with institutional moves:
Change in State of Delivery (CISD): In ICT trading, CISD marks potential reversal levels on each timeframe by showing the open of the highest series of up (green) candles for a bullish shift or the open of the lowest series of down (red) candles for a bearish shift. These levels are set at the opening price of the first candle in those runs, highlighting where the market turns. The indicator makes these levels easy to spot across timeframes, so you can track reversal points clearly. You can set your own confirmation criteria—a close or wick above/below the CISD line (bearish/bullish) or a close or wick above/below the high/low—to verify the CISD level cross. When confirmed, there is a high probability that we have a change in trend, and a reversal order block forms. CISD helps you track these reversal levels and confirm market shifts, making multi-timeframe analysis straightforward.
Order Blocks: When a CISD level cross is confirmed, the price is now below a series of up (green) candles or above a series of down (red) candles, marking these candles as order blocks that usually support the new trend direction. The indicator shows these levels clearly across timeframes, making it easy to spot high-probability reversal or consolidation areas. Keep in mind that price may sometimes move to mitigate an imbalance, so use your best judgment based on your multi-timeframe analysis to confirm they meet your trading criteria.
Trend Bias: Traders often struggle figuring out market bias—guessing the trend wrong, losing on trades against the flow, or missing how lower and higher timeframes line up. The Trend Bias feature tracks order blocks and change in state of delivery, displaying bullish or bearish trends for each timeframe to help you choose trades that go with the market’s direction. The indicator shows these trends clearly across timeframes, so you can quickly see if the 5m matches the 1H or if you’re going against the bigger trend. This makes it easier to avoid bad trades and make decisions faster, keeping you on track with setups that follow the main trend.
Immediate Rebalance: When looking at price action, you’ll see the market doesn’t usually leave behind many Fair Value Gaps (FVGs). That’s because the market is efficient and always rebalancing any inefficiencies. When the market starts a strong move, the last candle will usually close above the previous candle high (for up moves) or below the low (for down moves). At this point, the market will do one of two things: immediately rebalance by retracing first, or have a small retracement but leave behind an FVG. The Immediate Rebalance feature tracks rebalance levels across multiple timeframes, clearly showing where price rebalances. This helps traders have a better expectation of how the market may need to retrace and anticipate Power of Three (PO3) setups by being ready for a Judas swing to rebalance the imbalance.
Fair Value Gaps and Volume Imbalances: If the market fails to immediately rebalance, it will usually attempt to come back and rebalance it at a later time. FVGs and VIs give you a clear area where the price might be heading if it starts breaking structure on lower timeframes. These inefficiencies—price gaps (FVGs) or aggressive moves (VIs)—show where the market’s working to fix imbalances. The Fair Value Gaps and Volume Imbalances feature tracks these levels across timeframes.
Previous Candle Levels: The Previous Candle Levels feature marks the high, low, and middle of the prior candle on each timeframe, helping you identify key price levels for sweeps, bounces, or breakouts. It tracks the candle’s high and low as its extremes and the middle as the 50% mark, which you can set to calculate using the high-to-low range or the open-to-close range. These levels can provide tradable setups on lower timeframes.
Smart Money Techniques (SMT): What’s an ICT indicator without an SMT feature to track cracks in correlated assets? The ICT HTF Candles monitors your chosen correlated assets, like EUR/USD and GBP/USD or SQ and NQ, for signs of strength or weakness to use as confluence with other features and build the case for A+ setups. The SMT feature spots divergences when one asset makes a higher high or lower low while the other doesn’t follow, hinting at potential reversals or market shifts. It tests SMT using two immediate candles, since higher timeframes (HTFs) create larger gaps on lower timeframes. Traders can easily see these divergence levels, like a 15m SMT lining up with a 1H order block or CISD, helping you confirm high-probability setups and strengthen trade entries with multi-timeframe confluence.

StockLeave Signal BarThe indicator identifies potential trade entries by highlighting expansion and reversal bars. These are defined by individual bar characteristics and refined by contextual factors such as price position relative to structural boundaries. The purpose is to locate bars that could indicate potential market initiation.
Expansion Bars
The expansion captures bars that breakout from a period of reduced volatility. These often initiate directional movement and are recognized using a two-part definition:
Range Expansion The current bar’s range must exceed the average range. This ensures the move is comparatively large and stands out from recent behavior.
Range Compression The bars before the expansion must be below a threshold of the average range. This confirms a low-volatility lead-up, strengthening the likelihood that the expansion has significance.
This script applies additional filters. A local breakout ensures price breaks the previous bar’s high or low. A strong close confirms directional intent by requiring the close near the bar’s extreme. Mean proximity checks that expansion starts near the mean price using a dynamic buffer relative to bar size. A directional filter blocks signals during extended directional runs. Consecutive suppression prevents multiple expansions to show in succession.
Reversal Bars
Reversal setups aim to identify potential turning points after price has reached a zone of imbalance or extension. These bars typically exhibit long tails and occur near structural boundaries such as the outer Keltner bands. Their design favors short-term price rejection and potential reversal.
Tail Dominance The wick must be at least twice the body and make up a significant portion of the bar’s total range, signaling strong rejection rather than indecision.
Close Location The close should be near the opposite end of the wick, near the low for bearish signals and near the high for bullish, confirming pressure in the reversal direction.
This script applies additional filters. Local extreme ensures the bar marks a local turning point to confirm reversals occur after extension, not within structure. Boundary proximity requires the bar to appear near the outer envelope, aligning bearish signals with the upper band and bullish with the lower, indicating price has reached an area of likely imbalance.
This section also incorporate snapback reversals, designed to capture failed extensions beyond structural boundaries. Unlike single-bar rejections, snapbacks use a two-bar sequence: a strong impulse bar that closes outside the envelope, followed by a reversal bar that closes back inside.
Alert Configuration
The Signal Bars indicator includes an alert function with two built-in conditions to help reduce screen time and focus attention when predefined conditions are met.
Expansion: Alerts when a bar meets all conditions for a valid expansion.
Reversal: Alerts when a bar meets the criteria for a pin bar or snapback reversal.
These are built into the indicator with the alertcondition() function and can be turned on whenever the indicator is applied to a chart. Each alert includes a default message that uses dynamic placeholders; {{ticker}} for the symbol and {{interval}} for the timeframe.
Create a new alert and select the condition “StockLeave Signal Bars.”
Then select from the two options: Expansion and Reversal.
For expansions, select “once per bar” to capture developing momentum.
For reversals, use “once per bar close” to confirm rejection setups.
Apply alerts across multiple timeframes to improve coverage. Lower timeframes are better suited for fast-moving markets, while higher timeframes work well in slower or more selective environments. This process only needs to be done once. The created alerts can then be toggled on or off from the Alerts panel as preferred, without requiring reconfiguration.
Applied Discretion
The indicator functions on fixed logic, but interpretation always takes precedence. Consider price action, structure, volatility, and broader market context. Most signals will not lead to trades; while many may appear in a session, only a select few will align with context and warrant execution based on discretion.

IU Three Line Strike Candlestick PatternIU Three Line Strike Candlestick Pattern
This indicator identifies the Three Line Strike candlestick pattern — a rare yet powerful 4-bar reversal setup that captures exhaustion and momentum shifts at the end of strong trends.
Pattern Logic:
The Three Line Strike is a 4-candle pattern that typically signals a sharp reversal after a sustained directional move. This script detects both bullish and bearish variations using strict criteria to ensure accuracy.
Bullish Three Line Strike:
* Previous three candles must be bearish (red)
* Each of these candles must close progressively lower (indicating a strong downtrend)
* The current candle must:
* Be bullish (green)
* Open below the prior close
* Completely engulf the previous three candles by closing above the first candle's open
* And make a higher high than the last 3 bars — confirming a strong reversal
* Once confirmed, a green shaded box is drawn around the 4-bar zone to highlight the pattern
Bearish Three Line Strike:
* Previous three candles must be bullish (green)
* Each must close progressively higher (indicating a strong uptrend)
* The current candle must:
* Be bearish (red)
* Open above the prior close
* Completely engulf the prior three candles by closing below the first candle's open
* And make a lower low than the last 3 bars — confirming downside strength
* A red shaded box is plotted around the 4-bar formation to emphasize the reversal zone
Why this is unique:
Most candlestick tools focus on 1–2 bar patterns. The Three Line Strike goes a step further by combining trend exhaustion (3 same-colored candles) with a full reversal engulfing candle. This pattern is both rare and highly expressive of sentiment shift, making it a standout signal for discretionary and algorithmic traders alike.
How users can benefit:
* High-probability setups: Filters out weak signals using multi-bar confirmation logic
* Clear visual cues: Dynamic shaded boxes and labels make spotting reversals effortless
* Cross-timeframe compatible: Works on intraday and higher timeframes across all markets
* Real-time alerts: Get notified instantly when a bullish or bearish setup forms
This indicator is a valuable addition for traders who want to capture key reversals backed by strong multi-bar price action logic. Whether you are a price action purist or a pattern-based strategist, the IU Three Line Strike gives you a reliable edge.
Disclaimer:
This script is for educational purposes only and does not constitute financial advice. Trading involves risk, and past performance is not indicative of future results. Always do your own research and consult with a licensed financial advisor before making trading decisions.

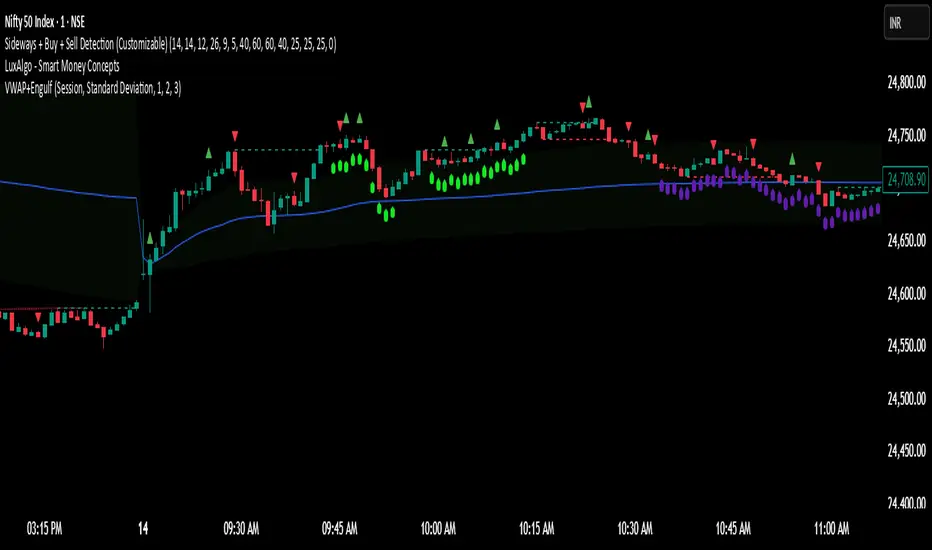
VWAP + Engulfing CandlesHere’s a clear breakdown of what your merged Pine Script does:
---
### 📌 **Indicator Name: VWAP + Engulfing Candles**
* This custom TradingView indicator **plots VWAP (Volume Weighted Average Price)** along with **up to 3 dynamic bands** around it.
* It also **detects Bullish and Bearish Engulfing Candlestick Patterns**, displaying visual markers and triggering alerts.
---
## 🔹 **1. VWAP Section**
### ➤ **Main Features:**
* Calculates VWAP anchored to a **customizable time period**:
* Options: Session, Week, Month, Quarter, Year, Decade, Century, Earnings, Dividends, Splits.
* Optional **hiding of VWAP on Daily/Weekly/Monthly charts** to reduce clutter.
### ➤ **Bands Around VWAP:**
* Up to **3 bands** can be plotted above and below the VWAP.
* Bands can be based on either:
* **Standard Deviation** of the price from VWAP (volatility-based), or
* **Percentage** deviation from VWAP (fixed range).
* You can control:
* Whether each band is shown
* Band width via multiplier (e.g., 1x, 2x, 3x)
### ➤ **Plot Colors:**
* VWAP: Blue
* Bands: Green (1x), Olive (2x), Teal (3x)
* Band fill areas are semi-transparent.
---
## 🔹 **2. Engulfing Candlestick Pattern Detector**
### ➤ **Bullish Engulfing Criteria:**
* Current candle opens **below** or **equal to** the close of the previous candle.
* Current candle opens **below** the previous candle's open.
* Current candle closes **above** the previous candle’s open.
### ➤ **Bearish Engulfing Criteria:**
* Current candle opens **above** or **equal to** the close of the previous candle.
* Current candle opens **above** the previous candle’s open.
* Current candle closes **below** the previous candle’s open.
### ➤ **Visual Signals:**
* 🔼 Green triangle **below bar** for **Bullish Engulfing**
* 🔽 Red triangle **above bar** for **Bearish Engulfing**
### ➤ **Alerts:**
* The script includes two alert conditions:
* One for Bullish Engulfing
* One for Bearish Engulfing
These alerts can be used to automate notifications for potential reversal points.
---
## 🛠️ **Use Cases**
* **Trend following or reversal spotting**: VWAP helps identify the average trading price; engulfing patterns often signal reversals.
* **Intraday and swing trading**: Works best on timeframes like 5m, 15m, 1h for intraday, or 4h, 1D for swing.
* **Mean reversion strategies**: Bands help spot overbought/oversold areas relative to VWAP.
Power Block Consolidation with Volume @MaxMaserati 2.0Power Block Consolidation with Volume @MaxMaserati 2.0
Overview
Price action hinges on consolidation, the foundation of market moves. The "Power Block Consolidation with Volume @MaxMaserati 2.0" (MMPB) indicator uses a proprietary, ingenious system to identify high-probability consolidation zones—termed "power blocks"—where smart money drives accumulation or distribution. By leveraging a unique limitorphe closing candle system, to plots volume to signal price direction: significant volume at the high price indicates bullish continuation, while volume at the low price suggests bearish momentum. This tool empowers traders to exploit bullish and bearish trends with precision.
Key Features
Consolidation Detection: Pinpoints power blocks using a secret system, marking zones of smart money activity.
Volume Analysis: A proprietary limitrophe closing candle system splits volume into buying (high price) and selling (low price), revealing accumulation (buying pressure) or distribution (selling pressure).
Trend Visualization:
Bullish Trends: Green boxes and lines highlight consolidation zones with high volume at the high price, signaling upward continuation.
Bearish Trends: Red boxes and lines mark zones with high volume at the low price, indicating downward momentum.
NB: The volume matter more than the color of the box.
Example
High volume up at the box vs low volume at the low we expect an up move
Even we had a bearish Body close below the box price reconfirmed the up move
Price make the bullish upside move
Price retest the box and reject it strongly
Breakout and Retest: Captures breakouts from power blocks, with price often retesting the zone before resuming the trend.
Volume Labels: Displays buying (green) and selling (red) volume on lines for clear pressure analysis.
Breakout Alerts: Triggers alerts for bullish ("BuBC") and bearish ("BeBC") breakouts, with optional visual markers (triangles).
Strategy
MMPB is designed to capture smart money behavior in consolidation zones, where markets prepare for significant moves. Key principles:
Volume-Driven Direction: High volume at the high price within a power block signals strong bullish continuation; high volume at the low price indicates bearish potential.
Accumulation/Distribution: Buying volume reflects accumulation, priming bullish trends; selling volume signals distribution, fueling bearish trends.
Breakout and Retest: Price often breaks out from power blocks and retests the zone, offering low-risk entry points.
Consolidation as Precursor: Markets require consolidation to build momentum, making power blocks critical for trend prediction.
Traders can:
Enter on breakouts with strong volume confirmation.
Target retests of power blocks for high-probability setups.
Use volume labels to assess trend strength.
Use Cases
Trend Trading: Ride bullish or bearish trends post-breakout from high-volume power blocks.
Swing Trading: Use power blocks as dynamic support/resistance for entries and exits.
Smart Money Analysis: Identify accumulation (bullish) or distribution (bearish) zones.
Risk Management: Place stops at power block edges during retests.
Conclusion
The MMPB indicator, powered by a proprietary system, transforms consolidation analysis by identifying power blocks where smart money operates. Its limitrophe closing candle system highlights volume-driven trends, enabling traders to capitalize on bullish and bearish moves with confidence. Ideal for trend and swing traders, MMPB shines in markets where consolidation precedes significant trends, offering clear signals for breakouts and retests.

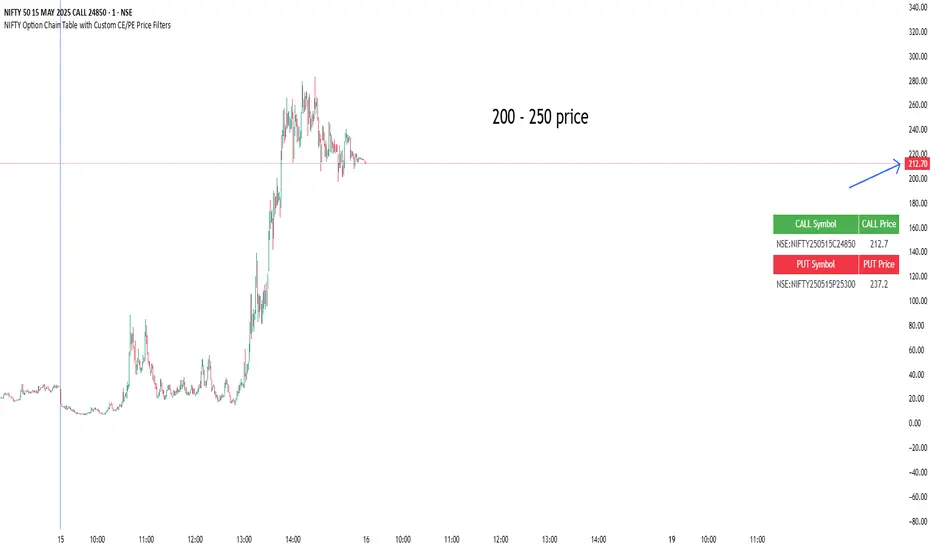
NIFTY Option Chain Table with Custom CE/PE Price FiltersThis Pine Script creates a powerful and visually organized option chain dashboard for NIFTY Index Options, showing 10 Call Options (CE) and 10 Put Options (PE), with real-time prices updated on a 5-minute chart.
You can filter and view only the most relevant option contracts based on your preferred price ranges, helping you make quick decisions for scalping, intraday, or positional trades.
🔍 How It Works:
You manually select up to 10 Call Option symbols and 10 Put Option symbols from NSE (e.g., NIFTY240530C18000, NIFTY240530P18000, etc.).
Keep that time options this are old options in defalt so there will be a error
The script fetches the real-time close price of each option using the request.security() function.
You define the minimum and maximum price range separately for Calls and Puts.
The script filters out any options that fall outside of your desired price range.
Only a limited number of matching options (as set by you) are displayed in the table for both Calls and Puts.
The table is shown at your preferred location on the chart (Bottom Right, Top Left, etc.).
✅ Features:
🔟 Supports exactly 10 CE and 10 PE options for tracking.
📈 Live price updates pulled directly from the chart timeframe (5-min).
🎯 Custom price filters for CE and PE (separate inputs).
📊 Show only the top X number of contracts that meet your filter criteria.
🧱 Vertical layout with clear headers and color-coded sections (green for Calls, red for Puts).
🎛️ Position the table wherever it's most convenient on your chart.
⚡ Helps you quickly spot low premium or range-bound options during the day.
📌 Use Case:
Ideal for:
Option scalpers and day traders who want to focus only on options within a specific price zone.
Traders who want to monitor multiple strikes simultaneously without clutter.
Users building custom NIFTY strategies based on option premiums.