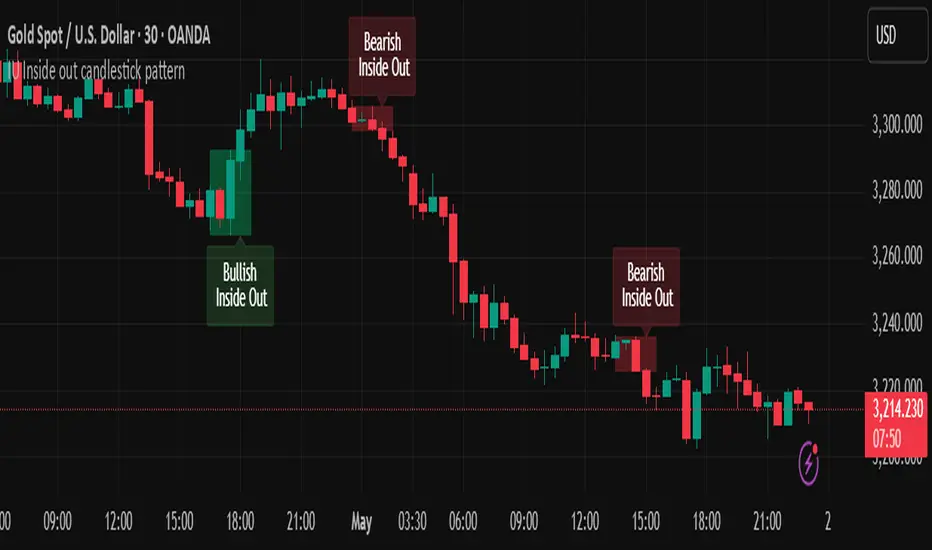
IU Inside out candlestick patternIU Inside Out Candlestick Pattern
This indicator identifies the Inside Out Candlestick Pattern — a unique 3-bar price action setup that captures strong market momentum and potential reversals with greater reliability than traditional patterns.
Pattern Logic:
The Inside Out pattern builds upon a classic engulfing setup by adding a breakout confirmation, making it a refined and filtered approach to candlestick analysis.
Bullish Inside Out Logic:
- Bar must be a bullish engulfing candle (engulfs previous bearish candle).
- Current bar must be bullish and must close above the high of the engulfing candle (a bullish breakout).
- When this setup is confirmed, a shaded green box is drawn around the range of the engulfing candle and its preceding bar.
Bearish Inside Out Logic:
- Bar must be a bearish engulfing candle (engulfs previous bullish candle).
- Current bar must be bearish and must close below the low of the engulfing candle (a bearish breakdown).
- When confirmed, a red box highlights the zone formed by the engulfing candle and its prior bar.
Why this is unique:
Unlike conventional candlestick indicators that trigger signals immediately after an engulfing pattern, this script adds a breakout condition to validate follow-through strength. This reduces false positives and gives traders a clearer edge. The pattern is also rare, which means it captures strong, decisive moves when it does appear.
How users can benefit:
- High-quality entries: Only shows patterns with proven follow-through, improving trade timing.
- Visual clarity: Boxes and labels highlight significant price zones for easy interpretation.
- Flexible use: Applicable across timeframes and instruments — ideal for both intraday and swing traders.
- Alerts included: Real-time alerts help traders stay updated without staring at charts all day.
This script is a powerful tool for price action traders looking to enhance pattern reliability and signal strength through structure-based breakout confirmation.
Candlestick analysis
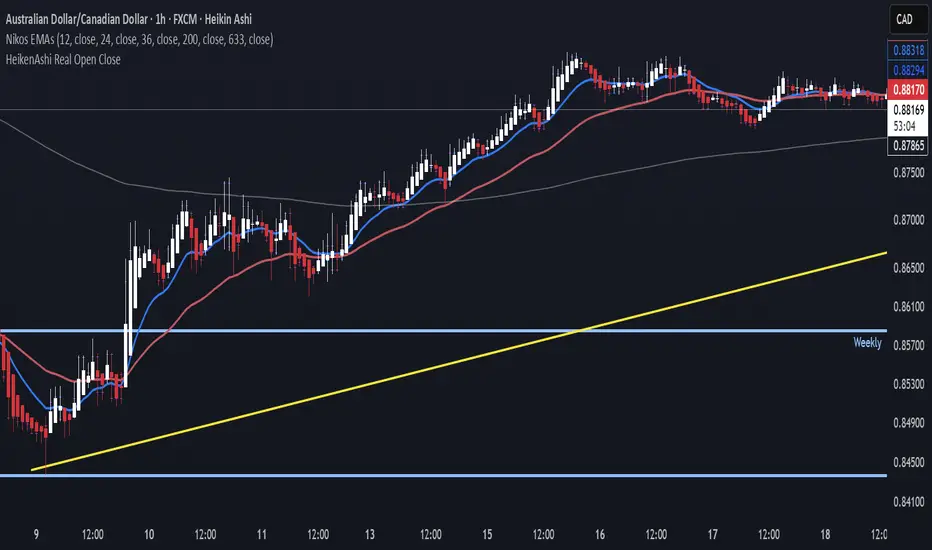
Real Open/Close Ticks for Heiken Ashi CandlesJapanese candle open and close prices. Good if you're using a HeikenAshi chart and you want to see real opens and closes.
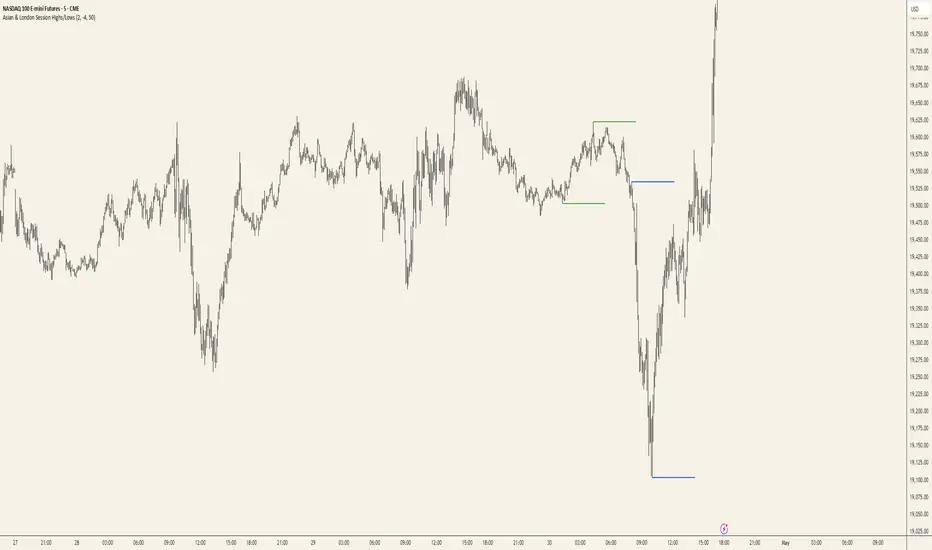
Asian & London Session Highs/LowsAsian & London Session Highs/Lows with Extendable Lines
This TradingView script automatically marks the highs and lows of the Asian and London trading sessions for the most recent day, allowing traders to identify key levels during these active periods. The lines representing the high and low of each session are drawn at the exact price point where the high/low occurred, and they extend to the right for a customizable number of bars, helping to visualize how the price reacts to these key levels after the session ends.
Key Features:
Session High/Low Tracking: Automatically tracks the highest and lowest points for the Asian and London sessions.
Extendable Lines: Lines start at the exact bar where the high/low occurred and can be extended to the right for a specified number of bars.
Timezone Adjustment: Allows you to input a timezone offset to adjust session times based on your local time or desired market time zone.
Customizable Colors & Line Thickness: Adjust the color and thickness of the session high and low lines to suit your visual preferences.
Clear & Precise Levels: Helps identify important support and resistance levels, making it easier to spot market reactions around session highs and lows.
This indicator is perfect for day traders and those looking to trade during specific market hours, offering clear visual markers of session boundaries and critical price levels.
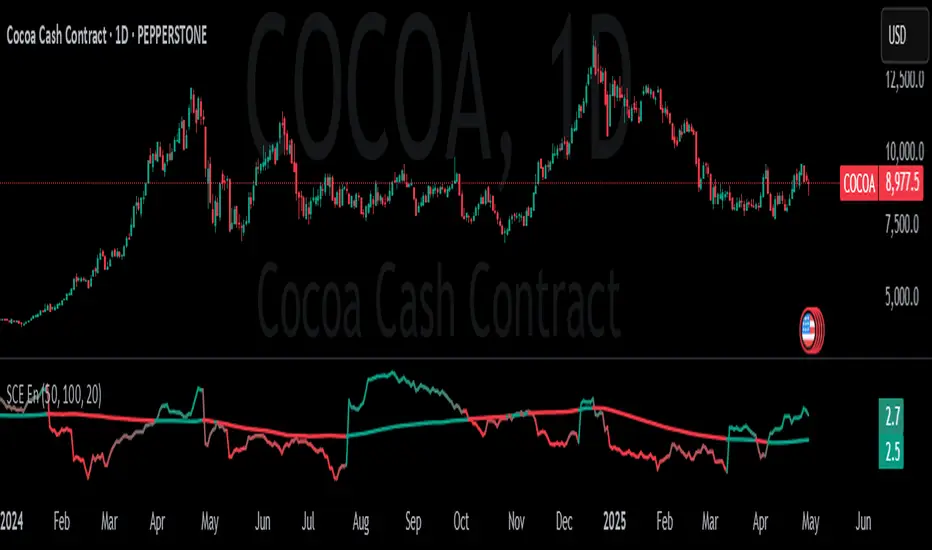
Entropy [ScorsoneEnterprises]This indicator calculates the entropy of price log returns over a user-defined lookback period, providing insights into market complexity and unpredictability. Entropy measures the randomness or disorder in price movements, helping traders identify periods of high or low market uncertainty.
How It Works
The indicator computes the entropy of log returns (log(close/close )) using a histogram-based approach with customizable bins. Log returns are stored in an array of size N (lookback period), and entropy is calculated by:
Binning the returns into bins intervals based on their range.
Computing the probability distribution across bins.
Calculating entropy as -Σ(p * log(p)), where p is the probability of each bin.
A reference Simple Moving Average (SMA) of the entropy, with a separate lookback period (SMA_N), is plotted to highlight trends in market complexity. The entropy plot uses a gradient color scheme (red for lower entropy, teal for higher), while the SMA color shifts based on whether entropy is above (teal) or below (red) the SMA.
Key Features
Inputs:
Lookback Period (default: 50): Number of bars for calculating log returns.
Reference SMA Lookback Period (default: 100): Period for the entropy SMA.
Number of Bins (default: 20): Number of histogram bins for entropy calculation.
Plots:
Entropy: Gradient-colored line reflecting market randomness.
Reference SMA: Trend line to compare entropy against its average.
Interpretation
High Entropy: Indicates chaotic, unpredictable price movements, often during volatile or trendless markets.
Low Entropy: Suggests more predictable, ordered price behavior, often in trending or stable markets.
Compare entropy to its SMA to gauge whether current market complexity is above or below its recent average.
Usage
Use this indicator to assess market regimes. High entropy may signal choppy, range-bound conditions, while low entropy could indicate trending opportunities. Combine with price action or other indicators for confirmation.
Examples
We see on this PEPPERSTONE:COCOA chart that when entropy is low it signals a strong trend, either up or down. High entropy signals indecision and choppiness in the market. We can determine this by noticing when the value is above or below its recent average.
Entropy is used in high frequency trading often. It is a nice tool for lower time frames to determine how predictable and strong a trend is.
Inputs
Users can enter the lookback value for entropy, bin count, and the look back for the entropy moving average.
No tool is perfect, the Entropy value is also not perfect and should not be followed blindly. It is good to use any tool along with discretion and price action.
Long-Term VWAP Mean Reversion SDCACore Idea:
This indicator is designed to support Strategic Dollar Cost Averaging (SDCA) for Bitcoin using a cumulative VWAP-based mean reversion model. It helps long-term investors identify high-conviction buy zones and overbought conditions using statistical deviation from the cumulative VWAP. This indicator evaluates how much price is stretched from the true market average price, weighted by cumulative volume over time.
Core Concepts and Formulas:
Cumulative VWAP (Volume Weighted Average Price):
VWAP cumulative = ∑(Price×Volume) / ∑Volume
A long-term anchor that reflects the average dollar cost of all market participants across all candles. This version does not reset daily, unlike intraday VWAP.
VWAP Deviation % :
Deviation% = Price - VWAP cumulative / VWAP cumulative x 100
Shows how far current price has diverged from the long-term fair value.
Z-Score of VWAP Deviation:
Z= (Price−VWAP)−μ / σ (lookback period: default 200)
SDCA Multiplier Mapping:
*Keep in mind in my Z-Score system, -2 represents the overbought level (white horizontal line) and +2 represents oversold (cyan horizontal line) conditions. So the scores on the Y axis and Z-score in the table are reversed.
| Z-Score Range | SDCA Multiplier |
---------------------------------------------
| ≤ -2 | 0.25×
| -1 to +1 | 1.0×
| > +2 | 2.0×
The pink line plots this multiplier. It’s meant to control buy weight at each time step.
How to Use This for SDCA:
-Buy normally when the multiplier is 1.0× (Z-score between -1 and +1)
-Accelerate buying when Z-score is deeply negative (price far below VWAP)
-Slow or pause buying when Z-score is high (price far above VWAP)
-Use the stats panel to track current Z-score, VWAP level, deviation %, and multiplier
-Watch the red/blue backgrounds as visual confirmation of oversold/overbought zones
Inputs:
Z-Score Lookback Length:
Default: 200 but can be adjusted.
Visuals:
Z-Score Line (cyan): shows current standardized deviation from VWAP
Multiplier Line (bright pink): your SDCA intensity signal
Background Zones: cyan = oversold, white = overbought
Horizontal Lines: +2 and -2 standard deviation thresholds
Stats Panel (bottom right): live values for Z-score, multiplier, price, VWAP, and the deviation formula
Suited For:
-Long-term Bitcoin investors
-SDCA Systems
-Mean reversion systems
-Macro-level buy/sell planning

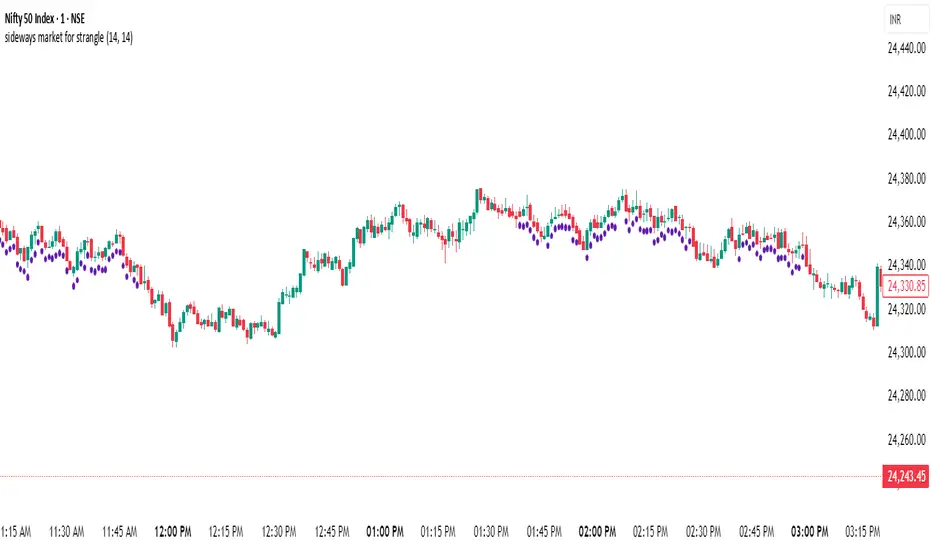
sideways market for strangleThis Pine Script is designed to identify **sideways or range-bound markets**, which are often ideal conditions for trading **options strangle strategies**. Here's a breakdown of what the script does:
---
### 🛠 **Purpose:**
To **detect low-volatility, sideways market conditions** where price is not trending strongly in either direction — suitable for **neutral options strategies like short strangles**.
---
### 📌 **Key Components:**
#### 1. **Inputs:**
- `RSI Length`: Default 14 — used for calculating the Relative Strength Index (RSI).
- `ADX Length`: Default 14 — used for calculating the Average Directional Index (ADX), DI+ (positive directional movement), and DI- (negative directional movement).
#### 2. **RSI Calculation:**
- `rsiValue` is calculated using the built-in `ta.rsi(close, rsiLength)`.
- A **sideways market** is expected when RSI is in the **40–60 range**, indicating lack of strong momentum.
#### 3. **ADX and Directional Indicators (DI+ and DI-):**
- `diPlus` and `diMinus` are calculated based on recent price movements and the True Range.
- `dx` (Directional Index) measures the strength of trend direction using the difference between DI+ and DI-.
- `adx` is a smoothed version of `dx` and represents **overall trend strength**.
#### 4. **Sideways Market Conditions:**
- **RSI Condition**: RSI is between 40 and 60.
- **ADX Condition**:
- `adx <= 25` → Weak or no trend.
- `adx < diPlus` and `adx < diMinus` → Confirms ADX is lower than directional components, reducing likelihood of a trending market.
#### 5. **Signal Plot:**
- A **green label below the bar** (`shape.labelup`) is plotted when both conditions are met.
- Indicates potential sideways market conditions.
---
### ✅ **Use Case:**
- This signal can help identify **low-volatility zones** suitable for **short strangles** or **iron condors**, where you profit from time decay while expecting the price to stay within a range.
True Range Orginal📌 Description – True Range Original
This indicator calculates the range (price spread) of the last N candles and displays it directly on the chart, along with suggested dynamic stop-loss levels based on recent volatility. Ideal for scalpers and day traders working on short timeframes such as 1-minute charts.
🔍 Features:
Calculates the difference between the highest high and lowest low of the last N bars (default: 15).
Plots a floating label with the current range value, updated every 5 candles.
Displays 4 dynamic stop levels:
For long positions:
Stop at 1x range (green line)
Stop at 1.5x range (light green line)
For short positions:
Stop at 1x range (red line)
Stop at 1.5x range (dark red line)
⚙️ Inputs:
Range period (number of bars)
Stop multiplier 1 (default: 1.0)
Stop multiplier 2 (default: 1.5)
📈 Usage:
This tool helps you size your stop-loss dynamically based on recent price action instead of using fixed values. It can be used alone or in combination with other tools like support/resistance, volume, or aggression indicators.

London/NY Sessions + SMC Levels📜 Indicator Description: London/NY Sessions + SMC Levels
Overview: This indicator highlights the key trading sessions — London, New York, NY Lunch, and Asian Range — providing structured visual guides based on Smart Money Concepts (SMC) and ICT principles.
It dynamically plots:
Session Backgrounds and Boxes for London, NY, Lunch, and Asian sessions
Reference Levels for the High, Low, and Close from today, previous day, or weekly data
Midnight Open line for ICT-style power of three setups
Real-time alerts for session starts, session closes, and important price level crossings
Features:
🕰️ Session Visualization:
Toggle London, NY, Lunch, and Asian session ranges individually, with customizable colors and transparent backgrounds.
🔔 Built-in Alerts:
Alerts for:
Price crossing the previous day's high/low
Price crossing the Midnight Open
Start and end of major sessions (London, NY, Lunch, Asian)
🟩 Reference Levels:
Plot selectable session reference levels:
Today’s intraday High/Low/Close
Previous Day’s High/Low/Close
This Week’s or Previous Week’s levels for broader context.
🌙 Midnight Open:
Track the Midnight New York Open as a reference point for daily bias shifts.
🎯 Customizable Settings:
Choose your session time zones (UTC, New York, London, etc.)
Customize all border colors, background colors, and session hours.
Use Cases:
Identify killzones and optimal trade entry windows for Smart Money Concepts (SMC) and ICT strategies.
Monitor liquidity pool sweeps and session transitions.
Confirm or refine your intraday or swing trading setups by referencing session highs/lows.
Recommended For:
ICT traders
Smart Money Concepts (SMC) practitioners
Forex, indices, crypto, and futures traders focusing on session-based volatility patterns
Anyone wanting a clean, professional session mapping tool
📈
Designed to help you trade with session precision and Smart Money accuracy.
Integrates seamlessly into any ICT, Wyckoff, or Liquidity-based trading approach.

Binary Strategy (with SMI logic)🧠 How to Use:
Chart Timeframe: 5-minute
Setup: Wait for an arrow to appear
Green arrow = BUY a 20-min binary in uptrend with positive momentum
Red arrow = SELL a 20-min binary in downtrend with negative momentum
SMI Logic: Entry only when SMI crosses its signal line in the trend direction and above/below zero
Works for Nadex 20-Minute $&P 500 Binary
If long at 75 get out at 50, or if short at 25 get out at 50. This allow you to be trading at a 1:1 ratio. (Approx.)

Entropy Bands (TechnoBlooms)Entropy Bands — A New Era of Volatility and Trend Analysis
Entropy Bands is our next indicator as a part of the Quantum Price Theory (QPT) Series of indicators.
🧠 Overview
Entropy Bands are an advanced volatility-based indicator that reimagines traditional banded systems like Bollinger Bands.
Built on entropy theory, adaptive moving averages, and dynamic volatility measurement, Entropy Bands provide deeper insights into market randomness, trend strength, and breakout potential.
Instead of only relying on price deviation (like Bollinger Bands), Entropy Bands integrate chaos theory principles to create smarter, more responsive dynamic bands that adapt to real market behavior.
🚀Why is Entropy Bands Different — and Better
Dynamic Band Width : Adjusts using both entropy and ATR, creating smarter expansion/contraction.
Multi-Moving Average Core : Choose between SMA, EMA, or WMA for optimal centerline behavior.
Noise and Breakout Filtering : Filters fake breakouts by analyzing candle body size and entropy conditions.
Visual Clarity : Background and candle coloring highlight chaotic/noisy zones, trend zones, and breakout moments.
Entropy Bands don't just react to price — they analyze the underlying market behavior, offering superior decision-making signals.
📚 Watch Band Behavior:
Bands expand during volatility spikes or chaotic conditions.
Bands contract during low volatility or tight consolidation zones.
📚 Analyze Candle Coloring:
Green = Bullish breakout (closing above upper band).
Pink = Bearish breakout (closing below lower band).
Gray = Inside bands (neutral/random noise).
✨ Key Features of Entropy Bands:
Entropy-Based Band Width Calculation: A scientific edge over pure price deviation methods.
Dynamic Background Coloring: Highlights high entropy areas where randomness dominates.
Candle Breakout Coloring: Easy-to-spot trend breakouts and strength moves.
Multi-MA Flexibility: Adapt the bands’ core to trending, ranging, or volatile markets.
Body Size Filter: Protects against fake breakouts by requiring meaningful candle body moves.

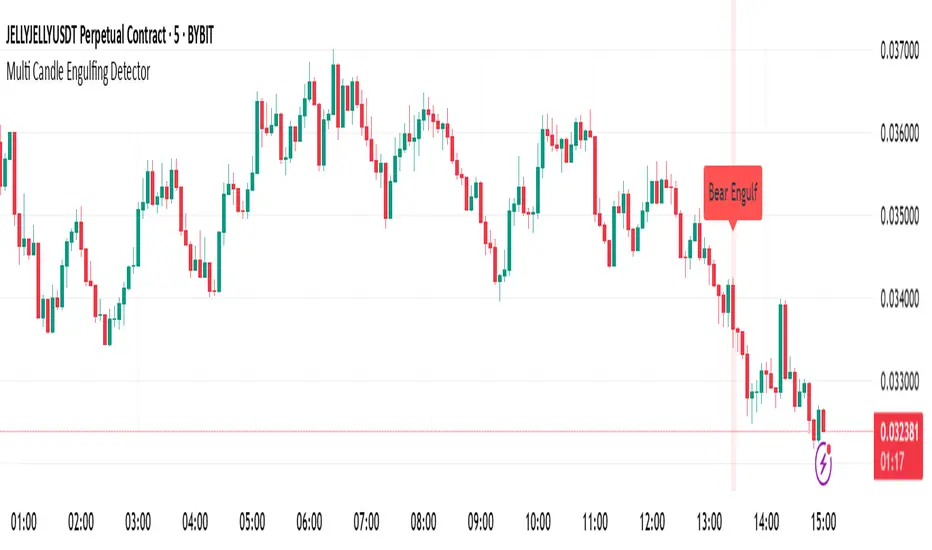
Multi Candle Engulfing Detector🔍 Multi Candle Engulfing Detector
This indicator identifies powerful engulfing candles that consume three or more previous candles — a signal often tied to strong market reversals or continuation moves.
🧠 Features
Detects candles that fully engulf the previous 3 or more candles
Optional filtering: only trigger when the engulfed candles are of the opposite color
Customizable engulf count for greater pattern control
Clear bullish and bearish signal labels on the chart
Alerts integrated: get notified the moment a setup forms
Background highlighting for enhanced visibility
⚙️ Settings
Minimum Number of Candles to Engulf: Default is 3, but can be adjusted
Require Opposite Color: When enabled, the engulfing candle must be opposite in color to the engulfed ones (e.g., green engulfing red)
📈 Use Cases
Spot strong reversal signals at tops and bottoms
Confirm breakout momentum on trend continuation
Use in confluence with other tools like volume or support/resistance
🚨 Alerts
Alerts fire when a bullish or bearish engulfing pattern is detected, allowing for mobile, email, or webhook notifications.
✅ Notes
This script is fully customizable and can be extended into a strategy or scanning tool. Feedback and suggestions are always welcome!
FVG# Fair Value Gap (FVG) Indicator
## Overview
The Fair Value Gap (FVG) indicator is a technical analysis tool designed to identify potential areas of price imbalance in the market. These imbalances, known as "fair value gaps," represent discontinuities in price movement where supply and demand were significantly imbalanced, potentially creating zones that price may return to in the future. This indicator was developed by Michele Amori for TradingView and operates as an overlay on price charts.
## Core Concept
Fair Value Gaps occur when price makes a significant move in one direction, leaving behind an area where no trading occurred. Specifically:
- **Bullish FVG**: Forms when the low of the current candle is higher than the high of the candle two positions back, creating an upward gap in price movement.
- **Bearish FVG**: Forms when the high of the current candle is lower than the low of the candle two positions back, creating a downward gap in price movement.
These gaps represent potential "fair value" areas that price may revisit to establish equilibrium between buyers and sellers.
## Visual Representation
The indicator displays FVGs in the following manner:
1. **Bullish FVGs**:
- Represented by semi-transparent green boxes
- Extend from the high of the candle two positions back to the low of the current candle
- Include a dashed green center line representing the middle point of the gap
2. **Bearish FVGs**:
- Represented by semi-transparent red boxes
- Extend from the low of the candle two positions back to the high of the current candle
- Include a dashed red center line representing the middle point of the gap
All FVG boxes and their center lines are extended to the right of the chart, making them visible until they are filled or invalidated.
## Invalidation Logic
The indicator automatically removes FVGs when they are considered filled or invalidated:
- **Bullish FVGs**: Removed when the closing price falls below the bottom of the FVG box, indicating that the upward gap has been filled.
- **Bearish FVGs**: Removed when the closing price rises above the top of the FVG box, indicating that the downward gap has been filled.
This removal only occurs after a candle is confirmed (fully formed), ensuring that premature invalidation doesn't occur during candle formation.
## Technical Implementation
The indicator uses arrays to store and manage the FVG boxes and their center lines. Key features of the implementation include:
- Creation of new FVGs only after candle confirmation
- Dynamic addition and removal of visual elements
- Transparent coloring (75% transparency) for better chart visibility
- Dashed center lines with less transparency (25%) to highlight the middle point of gaps

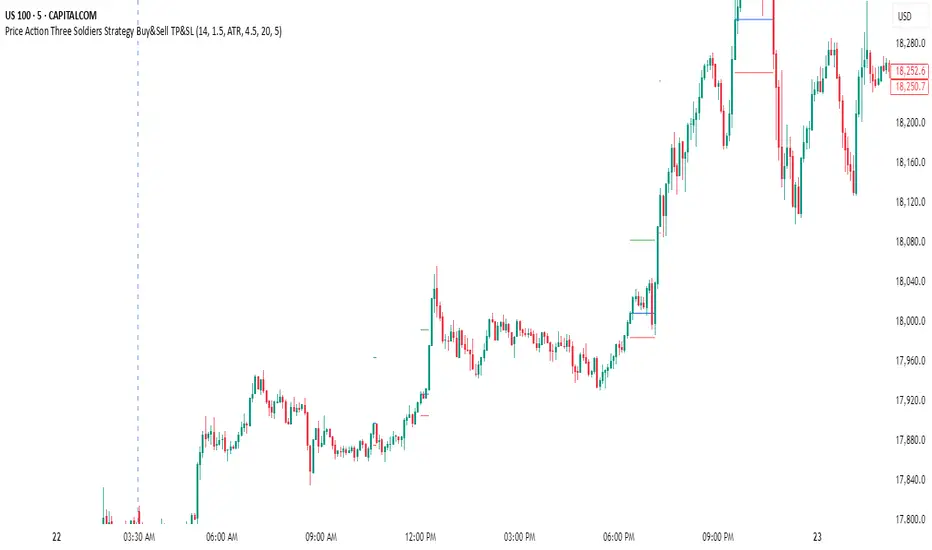
Price Action Three Soldiers Strategy Buy&Sell TP&SLStrategy Overview:
This indicator detects a "Three White Soldiers" bullish pattern to suggest potential buy opportunities. It uses dynamic Stop Loss (SL) and Take Profit (TP) management, based on either market volatility (ATR) or liquidity zones.
This tool is intended for educational and informational purposes only.
📈 Key Features:
Entry: Based on detecting Three White Soldiers candle pattern.
Exit: Targets are managed through ATR multiples or previous liquidity levels (swing highs).
Smart Liquidity: Optionally identify deeper liquidity targets.
Full Alerts: Buy and Sell signals supported with customizable alerts.
Visualized Trades: Entry, SL, and TP levels are plotted on the chart.
⚙️ User Inputs:
ATR Length, ATR Multipliers
Take Profit Mode (Liquidity/ATR)
Swing Lookback and Strength
Toggleable Buy/Sell alerts
📖 How to Use:
Add the Indicator:
Apply the script to your chart from the TradingView indicators panel.
Look for Buy Signals:
A buy signal is triggered when the script detects a "Three White Soldiers" bullish pattern.
Entry, Stop Loss, and Take Profit levels are plotted automatically.
Choose Take Profit Mode:
ATR Mode: TP is based on a volatility target.
Liquidity Mode: TP is based on past swing highs.
Set Alerts (Optional):
Enable Buy/Sell alerts in the settings to receive real-time notifications.
Practice First:
Always backtest and paper trade before live use.
📜 Disclaimer:
This script does not offer financial advice.
No guarantees of profit or performance are made.
Use in demo accounts or backtesting first.
Always practice proper risk management and seek advice from licensed professionals if needed.
✅ Script Compliance:
This script is designed in full accordance with TradingView’s House Rules for educational tools.
No financial advice is provided, no performance is guaranteed, and users are encouraged to backtest thoroughly.
2 MA + Strat Candle ColorsThe "2 MA + Strat Candle Colors" indicator combines two customizable moving averages (MAs) with a strategic candle-coloring system to help traders analyze trends and price action. Here’s a breakdown of its features:
1. Two Moving Averages (MAs):
MA 1 & MA 2 Settings:
Users can select between 7 MA types for each line: SMA, EMA, WMA, HMA, VWMA, LSMA, SMMA.
Adjustable periods and price sources (e.g., close, open) for both MAs.
Default settings: MA 1 = 9-period EMA, MA 2 = 20-period EMA.
Plotting:
MA 1 is blue, MA 2 is red (colors customizable via inputs).
Crossovers between the MAs can signal trend changes.
2. Strategic Candle Coloring:
Candles are colored based on their relationship to the previous candle:
Green (Bullish): "Two-Up Bar" – current high > prior high, and low does not break prior low.
Red (Bearish): "Two-Down Bar" – current low < prior low, and high does not break prior high.
Purple (Outside Bar): "Three Bar" – current candle engulfs the prior candle (higher high and lower low).
Yellow (Inside Bar): "One Bar" – current candle is contained within the prior candle’s range.
Candle coloring is based on:
Bar Count for XAUThis TradingView indicator labels every other five-minute candle for XAU during the current Beijing session, which runs from 06:00 to 05:00 the next day. It shows the actual bar numbers—1, 3, 5, and so on—only for today’s session; yesterday’s labels are automatically cleared at the new open. The tags appear just below each qualifying candle with no background box, and you can adjust the font size in the settings. In short, it gives you a clean, real-time visual of intraday bar order without clutter

OBV by Randy_New指標介紹: 本指標基於傳統 OBV(On-Balance Volume)設計,並加入 EMA(21) 作為基準線,生成震盪型 OBV 差值指標(OBV Oscillator),進一步強化趨勢動能判斷能力。
改良特色:
傳統 OBV 直接累積買賣量,但視覺變化不明顯。本腳本將 OBV 減去 EMA,形成震盪指標,方便判斷趨勢轉折點。
以紅/綠顏色區分 OBV Oscillator 正負,紅色代表上升趨勢,綠色代表下降趨勢,提升視覺判讀效率。
修正 OBV 初期累積偏移問題,讓指標更加準確。
應用方式:
OBV Oscillator > 0 時:代表買盤動能佔優,偏多思考。
OBV Oscillator < 0 時:代表賣盤動能佔優,偏空思考。
可搭配趨勢線、支撐阻力或其他指標(如 MACD、RSI)進行交叉驗證,增加交易勝率。
適合對象:
喜歡使用 OBV 判斷動能轉折的交易者
需要視覺化量價結合訊號的操盤手
備註: 本腳本為封閉原始碼,因應自有改良與應用,保護獨特邏輯設計,感謝理解
Indicator Name: OBV by Randy_New
Overview:
This indicator is based on the traditional On-Balance Volume (OBV) concept, with an enhancement that integrates an EMA (Exponential Moving Average) smoothing of the OBV data. The indicator plots an OBV Oscillator, which is the difference between the raw OBV and its EMA, helping traders to better visualize momentum changes and potential trend reversals.
Key Features:
Instead of simply accumulating OBV values, this script calculates the difference between OBV and its EMA to create a more responsive oscillator.
Color-coded visualization: Red when the oscillator is above zero (indicating bullish momentum), Green when below zero (indicating bearish momentum).
Corrects initial offset issues caused by na values in volume changes to ensure a more accurate OBV calculation from the beginning.
How to Use:
When the OBV Oscillator is above zero, it suggests buying pressure is dominant — consider bullish strategies.
When the OBV Oscillator is below zero, it suggests selling pressure is dominant — consider bearish strategies.
For higher accuracy, combine it with other technical tools such as trendlines, support/resistance, MACD, or RSI for confirmation.
Target Users:
Traders who like to use volume-based indicators for momentum analysis.
Traders looking for a simplified and visually enhanced version of the traditional OBV.
Important Notice:
This script is closed-source to protect the specific improvements and proprietary adjustments made to the traditional OBV calculation and visualization method. Thank you for your understanding.

Long Bar With ATR Multi Timframe | Amoo HassanLong Bar with ATR Multi Timeframe | Amoo Hassan
Looking for a smarter way to spot powerful moves in the market?
Long Bar with ATR Multi Timeframe is built exactly for that!
This tool helps you catch strong trend breakouts and potential reversals — in a simple, clear, and effective way.
What This Script Does:
Detects Long Bars: It looks for candles with a larger body compared to recent averages and confirms them with ATR (Average True Range). Only truly significant moves are highlighted.
Trend Filtering: Uses fast and slow moving averages (60 EMA, 34 EMA, and 200 SMA) to check if the overall market trend supports your trade.
Multi-Timeframe Supertrend: Supertrend signals are combined across different timeframes to give extra confirmation and reduce false signals.
Sharp Peaks and Valleys: Special candlestick patterns like sharp tops and bottoms are detected automatically.
Smart Trading Sessions: Trades are filtered based on the most active trading hours, avoiding dead times when price action is messy.
Important Date Control: On days with historically strange price action (like the 13th and 20th), the script stays cautious by disabling trades.
Clear Buy and Sell Labels: When all conditions are aligned, you'll see clean and clear "BUY" or "SELL" signals right on your chart.
Why You'll Like It:
It's easy to use, even if you're not a technical analysis expert.
It helps you avoid bad trades and focus on quality setups.
It fits into your existing trading system — or it can work as a standalone entry tool.
Friendly Reminder:
No indicator is 100% perfect! Always combine signals with good risk management and your own judgment.
And remember: Past results don't guarantee future performance.
Best Timeframes:
For the best results, we recommend using this script on 5-minute and 1-minute timeframes.

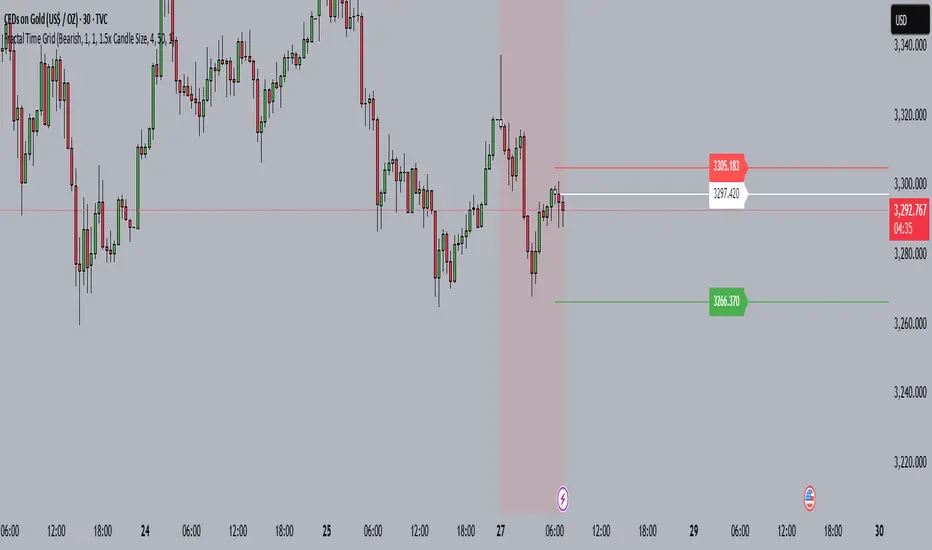
Fractal Time GridOverview
The Fractal Time Grid is a Pine-Script v5 TradingView indicator designed to automate session-based entries, stops, and targets. It overlays on your chart, shading trading “quarters” of any chosen timezone, highlighting bullish or bearish bias zones, and marking up to N entries per quarter with on-chart signals. Optional SL/TP rays and built-in alerts make it a one-stop tool for disciplined session trading.
1. User Inputs
All inputs appear in the indicator’s Settings panel:
Category Input Description
Trend & History Trend Source („Auto“, Bull, Bear) Auto-detects daily bias or forces Bull/Bear
History (days) (≥1) How far back (in days) to keep session shading active
Session Limits Max Entries per 6H Quarter (1–10) Caps how many signals you’ll get in each 6-hour window
Risk Management & Visuals Show Entry/SL/TP Rays (On/Off) Toggles horizontal lines and price labels
SL Method („Bar High/Low“ or „1.5× Candle“) How the stop-loss distance is calculated
Risk:Reward Ratio (e.g. 4.0) Multiplier applied to SL distance to plot TP
Ray Length (bars) (≥1) How far right SL/TP rays extend
Session Timing Timezone Offset (hours, –12 to +14) Shifts session shading to your local clock
Colors Bullish/Bearish Session BG opacity Semi-transparent fill for bias zones
Entry candle colors (Bull/Bear) Highlights actual entry bars
2. Bias Determination
Daily Close vs. Open
Fetches prior-day open/close via request.security(..., "D", …)
If close > open → bullish bias; close < open → bearish
Manual Override
“Bullish” or “Bearish” mode forces one direction
“Auto” follows daily bias
3. Time-Grid Logic
Timezone Handling
Converts UTC bar timestamps by your tzOffset input
Quarter Windows (6H each)
Q1: 23:00–05:00 local
Q2: 05:00–11:00
Q3: 11:00–17:00
Q4: 17:00–23:00
Session Shading
During Q1–Q3 (configurable days back), background colored to match bias
4. Entry Logic
Conditions:
Within an active quarter, bias must match candle direction (bullish candle in bullish quarter, etc.)
Entry count for the quarter must be below your maximum
Counters:
Automatically resets on quarter switch
Tracks how many entries you’ve taken, preventing over-trading
5. Visual Signals
Bar Coloring: Flags entry bars green/red
Shape Markers:
BUY label below bar for long entries
SELL label above bar for shorts
6. Optional SL/TP Rays
When “Show Entry/SL/TP Rays” is enabled:
Computes SL distance either from bar high/low or a multiple of candle size
TP = SL × R:R ratio
Draws three horizontal rays (entry, SL, TP) with end-of-ray price labels
7. Alerts
Pre-built alertcondition calls let you create TradingView alerts instantly:
Names: “BUY Alert” and “SELL Alert”
Messages:
arduino
Copy
Edit
BUY {{ticker}} at {{close}} – Q{{quarter}} – {{entryCount}}/{{maxEntriesQuarter}} entries
(same format for SELL)
8. Why Publish This?
Discipline Built-In: Caps over-trading per session
Timezone-Agnostic: Works equally for NY, London, Tokyo sessions
All-in-One: Bias, timing, entries, risk and alerts in one script
Fully Customizable: Colors, risk settings, time windows, and more
Bollinger Free BarsIdentify Extreme Price Actions with Non-Overlay Visualization
Core Functionality
This indicator detects two types of Bollinger Band breakout patterns without cluttering your chart:
1 ️⃣ Half Breakout Bar (Blue Triangles)
- Triggers when both open & close prices are outside the Bollinger Bands
- Suggests strong directional momentum continuation
2 ️⃣ Complete Breakout Bar (Red Flags)
- Activates when entire price action (including wicks) stays outside the bands
- Signals extreme volatility exhaustion points
Feature Highlights
◾ Smart Band Display
Translucent bands (#2196F3 & #FF9800 with 70% transparency) maintain chart clarity while showing dynamic volatility ranges
◾ Parameter Customization
- Adjustable period (default 20) & deviation multiplier (default 2.0)
- Selectable price source (close/open/high/low)
◾ Statistical Validation
Based on Bollinger Band's 95.4% price containment principle, signals filter out 4.6% extreme market conditions for high-probability scenarios.
Recommended Usage
1. Combine with volume analysis (significant breakout with high volume increases signal reliability)
2. Confirm with trend lines or RSI divergence
3. Adjust transparency via "Style" tab for multi-indicator layouts
Code Safety
- No repainting: All calculations use historical price data only
- No external network requests
- Open-source logic compliant with Pine Script v6 standards
Disclaimer
This tool is for technical analysis education only. Past performance doesn't guarantee future results. Always validate signals with fundamental analysis and proper risk management.

Another EMA trend indicator"Another EMA Trend Indicator" is a dynamic trend-following tool. Blending customizable Moving Averages (EMA or SMA) with an automated, visualized trade management system. It identifies bullish and bearish trend shifts based on short- and long-term MA crossovers, dynamically calculates optimal entry points, stop-losses, and take-profits, and visually manages trades on the chart with optional clouds, lines, and labels.
Main Features:
Moving Average Trend Detection:
Choice between EMA (Exponential Moving Average) or SMA (Simple Moving Average).
Two customizable lengths: a short MA and a long MA.
Detects bullish and bearish switches based on MA crossover events.
Entry, SL, and TP Calculation:
Entries are calculated dynamically after a signal using a combination of historical candle high/low analysis and a risk divider.
Stop-loss and take-profit levels are automatically set based on the trend's recent volatility and user-defined risk parameters.
Supports fixed or dynamic profit targets.
Risk Management Settings:
Define minimum and maximum acceptable profit percentages.
Set maximum stop-loss distance and apply a stop-loss multiplier for added flexibility.
Limit maximum trade duration to avoid endless open trades.
Trade Visualization:
Optional debug mode to display:
Entry, stop-loss, and take-profit lines.
Buy/sell signals via shapes on the chart.
Trend cloud between short and long MAs.
Historical trend levels for better visualization.
Dynamic Statistics Panel:
Real-time display of:
First trade date.
Total number of trades.
Number of profitable and losing trades.
Average and maximum trade duration.
Win rate and average profit/loss percentages.
Inputs:
MA Type: Choose between "EMA" or "SMA."
Short/Long MA Length: Customize lengths to control sensitivity.
Source: Apply to typical price values like hl2.
Risk Settings:
Minimum, maximum, and fixed profit percentages.
Stop-loss settings and risk dividers.
Trade Behavior Settings:
Max trade length.
Visualization Toggles:
Show/hide debug labels, lines, clouds.
Use Case:
This indicator is ideal for trend-following traders who prefer a semi-automated trading framework. It helps maintain consistency in entries and exits while visualizing important trend dynamics and trade health directly on the chart.
Best suited for swing trading crypto coins.

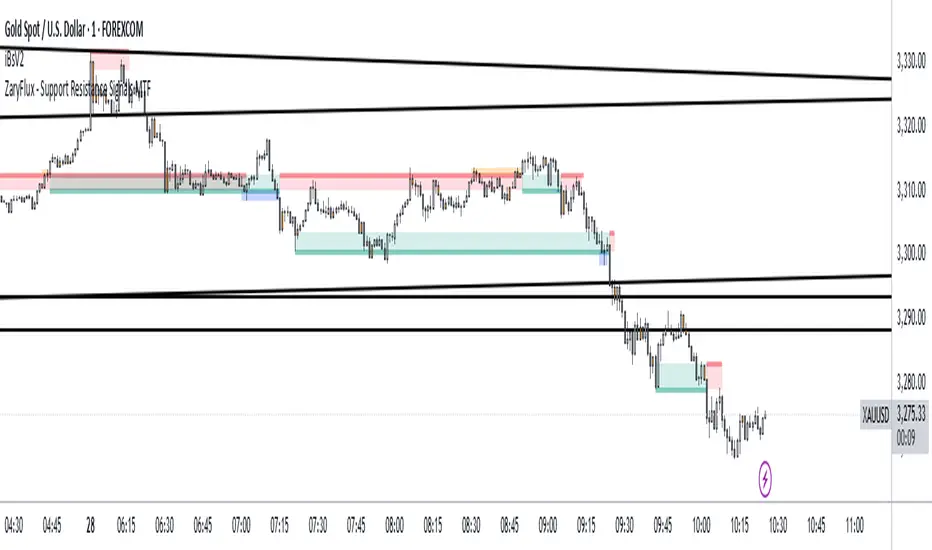
Support and Resistance Signals MTF [ZaryFlux]Support and Resistance Signals MTF is a powerful multi-timeframe (MTF) indicator designed to automatically detect key support and resistance levels across different timeframes.
It highlights significant price zones where reversals, breakouts, or trend continuations are most likely to occur — helping traders of all styles (scalping, swing, intraday) make smarter entries and exits.
Key Features :
Automatic plotting of dynamic support & resistance zones
Multi-Timeframe analysis: view higher timeframe zones directly on your current chart
Real-time alerts for price interactions with key levels
Customizable sensitivity for different trading strategies
Clean, non-cluttered design for easy readability
Whether you're trading Forex, crypto, stocks, or indices, this tool gives you a clearer view of market structure and high-probability trading zones.
Initial Imbalance [First FVG - ICT] v1Initial Imbalance v1
This indicator identifies the first Fair Value Gap (FVG) at the start of a user-defined session, inspired by The Inner Circle Trader. It helps traders spot initial imbalance in a sessions price action, offering filter options to refine FVG detection and optional session high/low lines for context.
Features:
Detects the first bullish or bearish FVG at the session start (default: 08:30). ISE: Sets a custom session start time (hour and minute).
Filters FVGs by size: None, ATR-based, or Points-based.
Displays session high/low lines (optional) to visualize the session range.
Customizable colors for bullish and bearish FVGs (background and border derived from a single color input).
Alerts for new FVGs and mitigated FVGs.
Settings:
Session Start Time: Define the hour and minute for the session start.
FVG Filter Type: Choose None, ATR, or Points to filter FVGs by size.
ATR Multiple / Minimum Points: Set the minimum FVG size for ATR or Points filters.
Show Session High/Low Lines: Toggle visibility of session range lines.
Bullish/Bearish FVG Colors: Customize colors for FVGs.
Technical Details:
Overlay indicator, displayed directly on the price chart.
This indicator is ideal for traders seeking to identify key price imbalances at the start of a session, with flexible filtering and visualization options.

M2D 4H ProfileOverview
This tool is designed to profile 4-hour cycles on your chart. It marks the start of each 4H cycle with vertical lines, tracks the Open, High, and Low prices within each cycle, and displays them as horizontal lines with labeled High and Low levels. Ideal for intraday and swing traders, this indicator provides a clear visual profile of key price levels and cycle transitions, enhancing your market analysis with precision and customization.
If you don't want the label, turn background color to 0.
Features
Cycle Start Markers: Draws vertical lines at the start of each 4H cycle (18:00, 22:00, 2:00, 6:00, 10:00, 14:00 NY EST).
Cycle Start Labels: Displays customizable labels at the top of each vertical line (e.g., "4H Start: 18:00").
Open, High, Low (OHL) Lines: Plots horizontal lines for the Open, High, and Low prices of each 4H cycle, spanning from the cycle start to the next cycle start.
High/Low Labels: Adds labels in the middle of the High and Low lines, showing the cycle start time (e.g., "18:00 High").
DST Adjustment: Includes a toggle to align cycle starts with either the chart’s local time (including DST) or a fixed UTC-4 (EST) time.
Fully Customizable: Adjust colors, styles, and visibility for all visual elements to suit your chart setup.
