XTE+ Optimized Trend Tracker📊 XTE+ Optimized Trend Tracker (OTT)
XTE+ OTT is a powerful, trend-following indicator designed for traders who value clarity, precision, and advanced analytics. It offers not only accurate entry and exit signals but also visual zones, historical signal analysis, and real-time trend monitoring.
🧠 How It Works
XTE+ OTT is based on an improved version of the Optimized Trend Tracker. It utilizes multiple customizable moving average types (VAR, EMA, SMA, WMA, and more) combined with volatility filtering (ATR logic) to generate cleaner, more reliable trend-following signals.
✅ Features
Trend Direction Detection with automatic switch logic
Buy/Sell Signal Icons with distinct large markers
Entry/Exit Zones drawn visually on chart
Custom Take-Profit / Stop-Loss settings for Buy and Sell signals
Statistical Panel showing:
Current Trend (Up/Down)
Number of total signals
Number of winning trades
Win percentage
Configurable Display Options:
Show/hide signals
Show/hide trend zones
Show/hide OTT and MA lines
Supports multiple MA types including EMA, SMA, VAR, ZLEMA, TSF and more
Non-repainting logic — signals are confirmed at bar close
⚙️ Inputs and Customization
OTT Period & Sensitivity (%)
MA Type Selection (VAR, EMA, etc.)
Entry Zone Visualization On/Off
Trend Panel Display On/Off
TP/SL % per direction (Buy/Sell separately)
Option to disable MA or OTT line display
📈 Visuals
Signal icons: BUY (Green Up Label), SELL (Red Down Label)
Entry zones: circles near breakout levels
Trendlines change color dynamically (green for uptrend, red for downtrend)
Trend Panel is pinned in the top-right corner for quick reference
💡 Usage Tips
Best used on higher timeframes (15min, 1H, 4H+) for more meaningful trend signals
Combine with volume/volatility indicators or support/resistance zones for enhanced decision making
Use TP/SL logic to track signal success over time and optimize strategies
📌 Disclaimer
This script is for educational and informational purposes only. It is not financial advice. Always test and validate your strategy before applying it in live markets.
Candlestick analysis

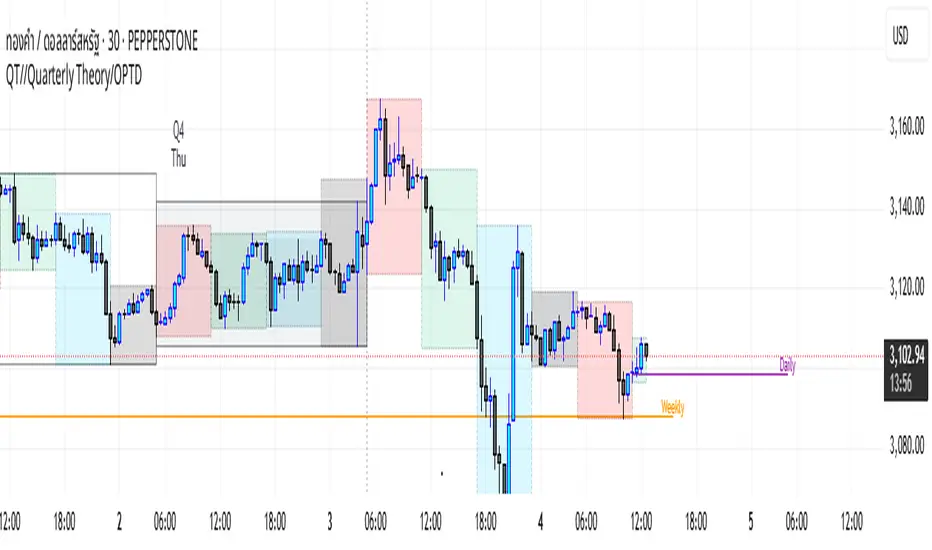
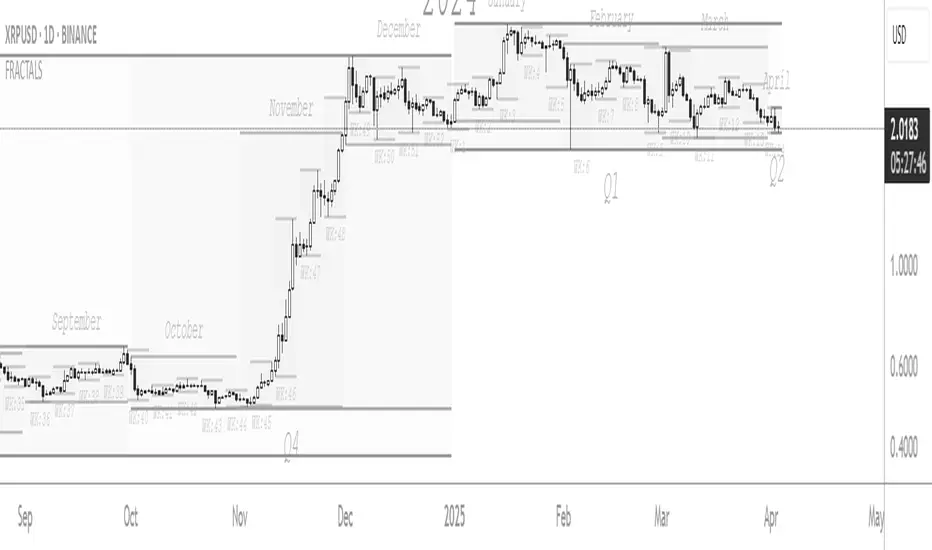
QT/TD.Den Quarterly Theory QT//Quarterly Theory/OPTD
These Quarters represent:
A - Accumulation (required for a cycle to occur)
M - Manipulation
D - Distribution
X - Reversal/Continuation
The latter are going to always be in this specific sequence; however the cycle can be transposed to have its beginning in X, trivially followed by A, M, and finally D.
This feature is not automatic and at the subjective discretion of the Analyst.
Note: this theory has been developed on Futures, hence its validity and reliability may change depending on the market Time.
This tool does provide a dynamic and auto-adapting aspect to different market types and Times, however they must be seen as experimental.
> Quarterly Cycles
The Quarterly Cycles currently supported are: Yearly, Monthly, Weekly, Daily, 90 Minute, Micro Sessions.
– Yearly Cycle:
Analogously to financial quarters, the year is divided in four sections of three months each
Q1 - January, February, March
Q2 - April, May, June (True Open, April Open)
Q3 - July, August, September
Q4 - October, November, December
JW Momentum IndicatorJW Momentum Indicator
This indicator provides clear and actionable buy/sell signals based on a combination of volume-enhanced momentum, divergence detection, and volatility adjustment. It's designed to identify potential trend reversals and momentum shifts with a focus on high-probability setups.
Key Features:
Volume-Enhanced Momentum: The indicator calculates a custom oscillator that combines momentum with volume, giving more weight to momentum when volume is significant. This helps to identify strong momentum moves.
Divergence Detection: It detects bullish and bearish divergences using pivot highs and lows, highlighting potential trend reversals.
Volatility-Adjusted Signals: The indicator adjusts signal sensitivity based on the Average True Range (ATR), making it more reliable in varying market conditions.
Clear Visuals: Buy and sell signals are clearly indicated with up and down triangles, while divergences are highlighted with distinct labels.
How to Use:
Buy Signals: Look for green up triangles or bullish divergence labels.
Sell Signals: Look for red down triangles or bearish divergence labels.
Oscillator and Thresholds: Use the plotted oscillator and thresholds to confirm signal strength.
Parameters:
Momentum Period: Adjusts the length of the momentum calculation.
Volume Average Period: Adjusts the length of the volume average calculation.
Volatility Period: Adjusts the length of the ATR calculation.
Volatility Multiplier: Adjusts the sensitivity of the volatility-adjusted signals.
Disclaimer:
This indicator is for informational purposes only and should not be considered financial advice. Always conduct 1 thorough research and use appropriate risk management techniques when trading.

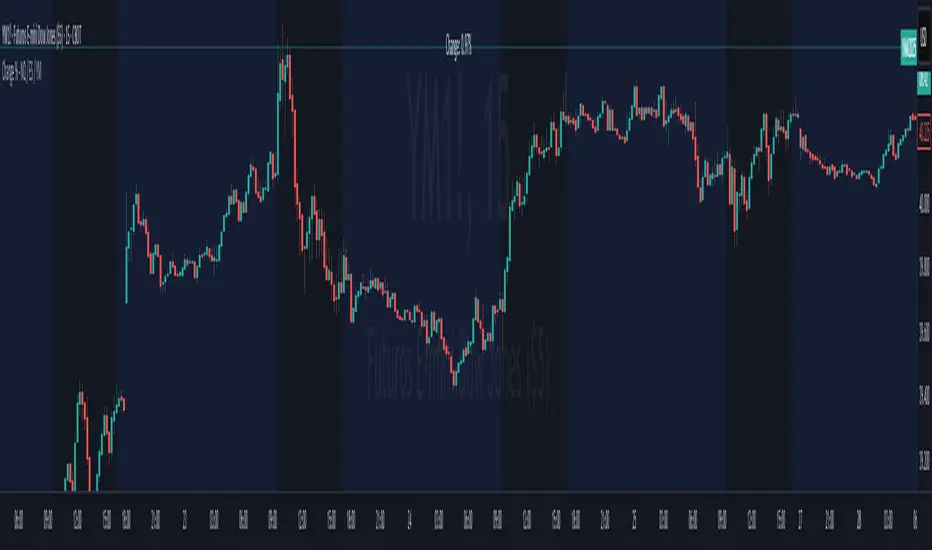
Change % Inteligente - NQ / ES / YMTopstep Compliance: Daily Price Change % Alert (NQ / ES / YM)
Script Purpose
This script helps funded traders (especially those using Topstep or similar programs) monitor the real-time percentage change of major equity index futures: Nasdaq (NQ), S&P 500 (ES), and Dow Jones (YM).
⚠️ Why it matters
Topstep prohibits trading within 2% of the daily price limits set by the CME. If a trader holds a position too close to those limits, they risk account disqualification.
📊 How it works
• Detects the instrument: NQ1!, ES1!, YM1!, or M2025 contracts
• Calculates the real-time % change from today’s market open
• Simulates daily CME price limits (+7% / -7%)
• Highlights when price enters the last 2% of the limit range (prohibited zone)
• Displays a clean, floating panel with the current % change and a warning if necessary
• Sends a visual and optional audio alert when in the prohibited zone
🧠 What makes this script unique?
This tool is **not for technical analysis**. It focuses exclusively on **funding program compliance** and **account protection**, which is not covered by other public scripts. It’s lightweight, intuitive, and designed for traders who manage risk like professionals.
✅ Open-source and ready for review.
✅ CHART SETUP FOR PUBLICATION
✔️ Use a clean chart
✔️ Only apply this script
✔️ Make sure the panel is visible (top-right or top-center recommended)
❌ No extra indicators or drawings
✔️ Use NQM2025, ESM2025 or YMM2025 on a volatile day (to show -1% to -3% range)
INSTRUCTIONS
1. Add the script to your chart.
2. Use it with NQ1!, ES1!, or YM1! (or M2025 contracts).
3. The panel will show today’s price change %.
4. If the market is within the last 2% of the CME price limit, a warning will appear.
5. Use this to avoid violating Topstep’s trading rules during volatile days.
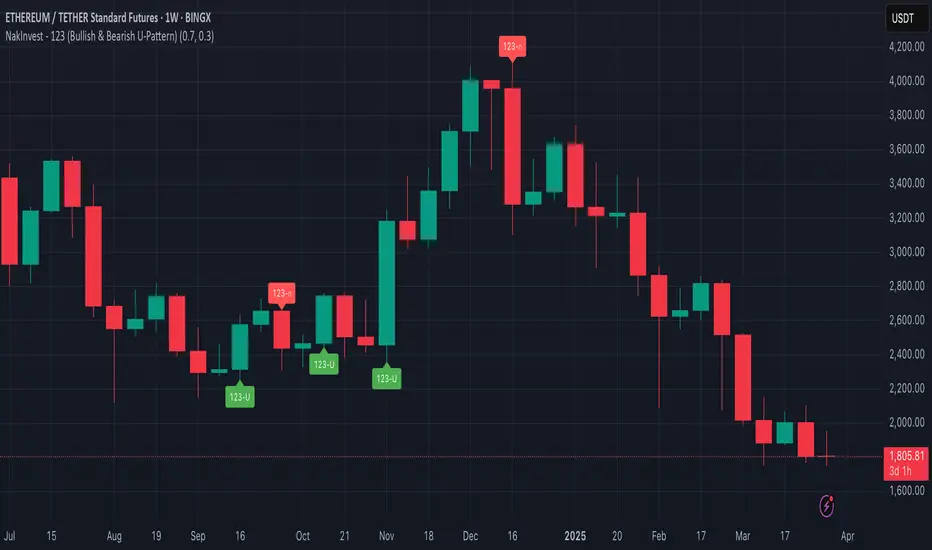
NakInvest - 123 (Bullish & Bearish U-Pattern)📘 Description: U-Shape 123 (Bullish & Bearish Identifier)
This indicator helps you identify the 123 reversal pattern, a powerful yet simple price action setup taught by renowned Brazilian trader Stormer.
I learned this pattern from Lucas Nakata, founder of NakInvest, who was a student of Stormer. Stormer has popularized and refined this setup in the Brazilian trading community, especially for identifying U-shaped reversals that precede strong directional moves.
⸻
🔎 What is the 123 Pattern?
The 123 pattern is a 3-candle formation used to spot bullish or bearish reversals. It forms a “U” or inverted “U” shape and is based purely on candlestick structure — no indicators or lagging signals.
There are two versions:
✅ Bullish 123 (“U” pattern)
• Candle 1: Red candle with a large body (selling pressure).
• Candle 2: Small candle of any color (pause or indecision).
• Candle 3: Green candle with a body at least 70% the size of candle 1 (strong bullish push).
This indicates a potential bullish reversal from a prior downtrend.
❌ Bearish 123 (inverted “U” pattern)
• Candle 1: Green candle with a large body (buying pressure).
• Candle 2: Small candle of any color (pause or indecision).
• Candle 3: Red candle with a body at least 70% the size of candle 1 (strong bearish push).
This indicates a potential bearish reversal from a prior uptrend.
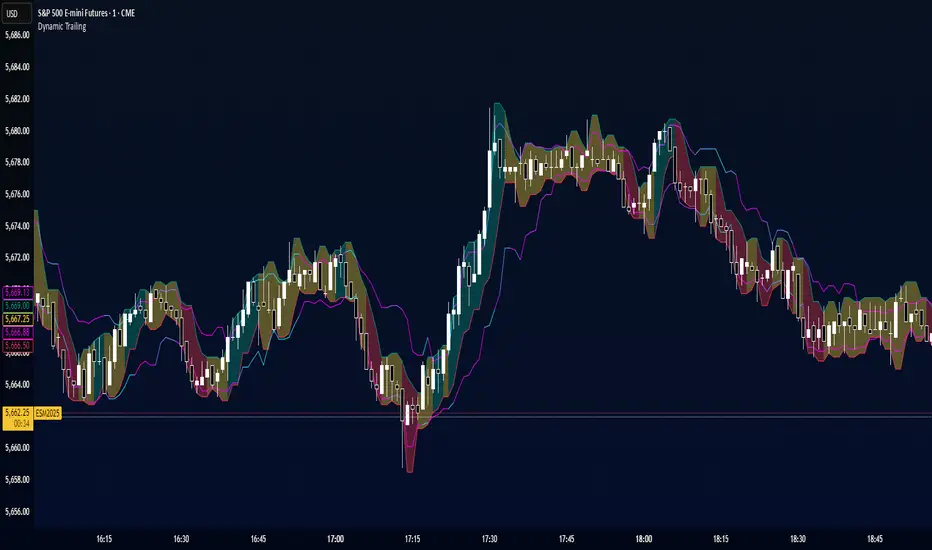
Dynamic TrailingDynamic Trailing is an indicator that reacts quickly to shifting candle structures, using a dynamic trailing lines on either side, essentially "counting" the confluences for either side, and highlighting the winning side.
CISD [TradeWithRon]The CISD (Change in State of Delivery) indicator helps traders identify significant price action events by tracking liquidity sweeps and CISD events. It highlights key market structure shifts by marking liquidity levels and failed breakouts, offering insights into potential reversals and breakout confirmations.
Features:
CISD Detection: Identifies high and low CISD events with customizable display settings.
Customizable Display: Users can control how many CISD lines and liquidity lines are shown.
Customization:
- Adjust the number of CISD and liquidity lines displayed.
- Modify the swing length and back-checking period for greater flexibility.
- Choose different colors and line styles to match your charting preferences.
Use Cases:
- Spot traps and reversals.
- Identify breakout confirmations.
- Enhance market structure analysis.
- Combine with other technical indicators for improved decision-making.
🔶 Disclaimer
Use with Caution: This indicator is provided for educational and informational purposes only and should not be considered as financial advice. Users should exercise caution and perform their own analysis before making trading decisions based on the indicator's signals.
Not Financial Advice: The information provided by this indicator does not constitute financial advice, and the creator (Tradewithron) shall not be held responsible for any trading losses incurred as a result of using this indicator.
Backtesting Recommended: Traders are encouraged to backtest the indicator thoroughly on historical data before using it in live trading to assess its performance and suitability for their trading strategies.
Risk Management: Trading involves inherent risks, and users should implement proper risk management strategies, including but not limited to stop-loss orders and position sizing, to mitigate potential losses.
No Guarantees: The accuracy and reliability of the indicator's signals cannot be guaranteed, as they are based on historical price data and past performance may not be indicative of future

Engulfing Candle Indicator with Single AlertEngulfing Candle Indicator with Alerts
This custom Pine Script indicator identifies Bullish and Bearish Engulfing Candles on the price chart, which are key reversal patterns. A Bullish Engulfing occurs when a smaller bearish candle is completely engulfed by a subsequent bullish candle, signaling a potential upward trend. Conversely, a Bearish Engulfing happens when a bullish candle is engulfed by a following bearish candle, indicating a possible downward trend.
The indicator highlights these patterns on the chart with green arrows for Bullish Engulfing and red arrows for Bearish Engulfing. It also includes an alert system that notifies the user whenever either of these patterns occurs.
The script uses an Average True Range (ATR) filter to ensure that the engulfing candles have sufficient size relative to market volatility. Additionally, users can adjust the minimum engulfing size to fine-tune the signal.

FRACTAL DIMENSIONSFRACTAL DIMENSIONS was created to allow us to properly visualize
the higher time frame dimensional data, While remaining on a lower
time frame. The Fractal dimensions are basically the higher time frames.
Remaining on a lower time frame allows us to get tighter entries and exits.
Each dimension is set in a wave degree formation. From primary to sub-minute,
depending on the time frame being utilized.
These multidimensional wave degrees will be utilized later in the strategy.
This indicator was broken off of the whole for the sake of drawing lines.
The data here is just for debugging purposes and is not used in the strategy,
but yet remains pretty awesome by itself.
Fractal dimensions is the foundation of the main strategy to come.
Now that we have this data, what are we going to do with it?
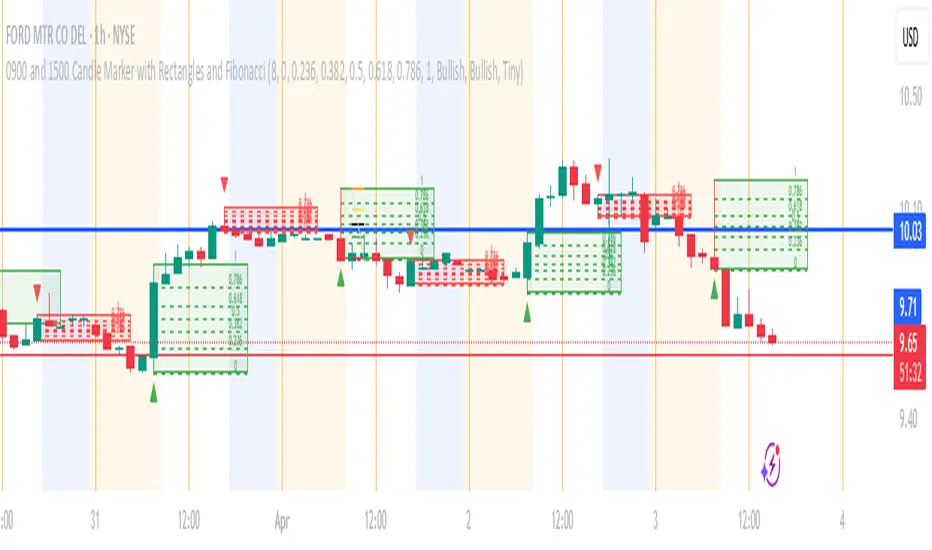
0900 and 1500 Candle Marker with Rectangles and FibonacciWelcome to the Indicator
// This tool is designed to help you analyze stock - crypto - or futures charts on TradingView by marking specific times - 9:00 AM and 3:00 PM (Eastern Time) - with colored rectangles and optional Fibonacci levels.
// It is perfect for spotting key moments in your trading day - like market opens or afternoon shifts - and understanding price ranges with simple lines and numbers.
// Whether you are new to trading or just want an easy way to visualize these times - this indicator is here to assist you.
//
// What It Does
// - Draws a green rectangle at 9:00 AM and a red rectangle at 3:00 PM on your chart - based on Eastern Time (America/New_York timezone).
// - Adds dashed lines inside these rectangles (called Fibonacci levels) to show important price points - like 0.236 or 0.618 of the rectangle’s height.
// - Places numbers on these lines (e.g. "0.5") so you can see exactly what each level represents.
// - Works on different chart types (stocks - crypto - futures) and adjusts for futures trading hours if needed.
// - Is designed to work best on timeframes of 1 hour or shorter (like 1-hour - 30-minute - 15-minute - 5-minute - or 1-minute charts) - where you can see the 9:00 AM and 3:00 PM candles clearly.
// - Lets you customize what you see through a settings menu - like hiding some lines or changing colors.
YOU MAY NOT MONETIZE
ANY PORTION OF THIS CODE.
WE ARE ALL IN THIS THING TOGETHER TO WIN.
BE A BLESSING ONTO THE WORLD AND GIVE.:)
DT_Sessions TOPDT_Sessions TOP - Powerful Trading Sessions and Key Levels Indicator
Description
DT_Sessions is a versatile TradingView indicator that displays major trading sessions and important price levels on your chart. It's ideal for traders working in forex, cryptocurrency, and stock markets, helping to visualize critical market information directly on the chart.
Key Features:
Visualization of major trading sessions: Asian, Frankfurt, London, New York (AM and PM)
Previous day high and low (PDH/PDL) tracking
Display of key psychological levels for major trading instruments
Customizable colors and styles for all indicator elements
Flexible timezone management for accurate session synchronization
Benefits of Use
Enhanced market analysis: Understanding the activity of different trading sessions helps better interpret price movements
Trading time optimization: Visual display of the most volatile market periods
Key resistance and support levels: Automatic display of psychologically significant price levels
Daily extreme monitoring: PDH/PDL help in determining the trading range
Supported Instruments
The indicator automatically recognizes popular instruments, including:
Forex pairs (EUR/USD, GBP/USD, USD/JPY)
Cryptocurrencies (Bitcoin, Ethereum)
Stock indices (DAX, NASDAQ, S&P 500, EuroStoxx50)
Precious metals (XAU/USD)
How to Use
Add the indicator to your favorite asset's chart
Observe the trading session ranges highlighted in different colors
Use PDH/PDL lines to identify significant daily levels
Pay attention to key psychological levels for your instrument
Advanced Settings
The indicator offers numerous settings for each session:
Enable/disable individual sessions
Adjust start and end times for each session
Change colors and transparency
Configure PDH/PDL display
Manage timezones and UTC offset
Effective For
Scalpers and day traders
Long-term investors tracking key levels
Algorithmic traders needing session data visualization
Beginners studying the impact of trading sessions on market activity
DT_Sessions is an essential tool for traders of all levels, providing valuable information about market dynamics and key levels directly on your TradingView chart.

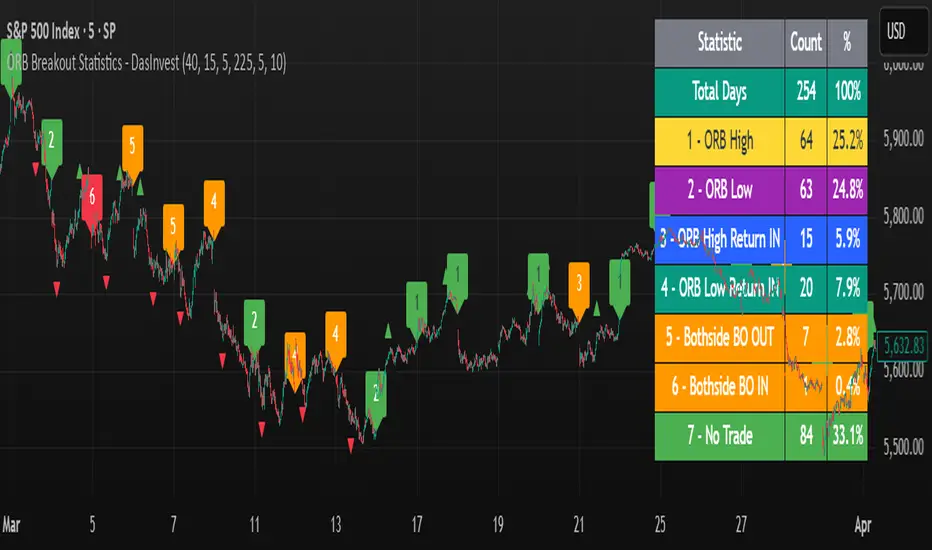
ORB Breakout Statistics with Labels and ProfitOpening Range Breakout Statistics – This indicator identifies the opening range based on user-defined inputs and detects breakouts above the high or below the low. At the end of each trading day, it classifies the session into a specific category based on price action. Additionally, it tracks profit and loss for each classification, allowing you to backtest the strategy using log files.
Open Vertical Lines [TradeWithRon]This indicator allows traders to draw vertical lines manually or automatically based on the current or specified higher timeframes. It is a versatile tool designed to help users identify and mark significant changes in the market, such as new candle formations, based on a selected or auto-adjusted timeframe.
Open Source
Features:
Timeframe Customization: Users can either manually specify a desired timeframe (e.g., 1-hour, 1-day, etc.) or enable the "Auto" feature, which automatically adjusts the timeframe based on the current chart's timeframe for better alignment with different trading strategies.
Customizable Line Style: The vertical line can be drawn in three different styles: Solid, Dashed, or Dotted, giving users the flexibility to choose their preferred appearance for better chart readability.
Line Color: Users can select the color of the vertical line with transparency options to match their chart's visual preferences.
Auto Timeframe Adjustments: The "Auto Align" option dynamically adjusts the timeframe used for vertical lines depending on the chart's current timeframe. For example, if you’re using a lower timeframe (e.g., 5 minutes), the indicator will automatically switch to a higher timeframe (e.g., 1 hour or daily) to mark vertical lines, ensuring the lines correspond to higher timeframe price action.
Vertical Line Placement:
A vertical line is placed each time a new candle appears on the chart, marking key moments for the user to analyze market movements. This can be helpful for marking the start of new trading sessions or significant events in the market.
How to Use:
1. Apply the indicator to your chart.
2. Configure the preferred timeframe settings (either fixed or auto-align).
3. Customize the line style and color according to your visual preference.
4. The indicator will automatically place vertical lines on the chart when a new candle is formed, based on your selected timeframe.

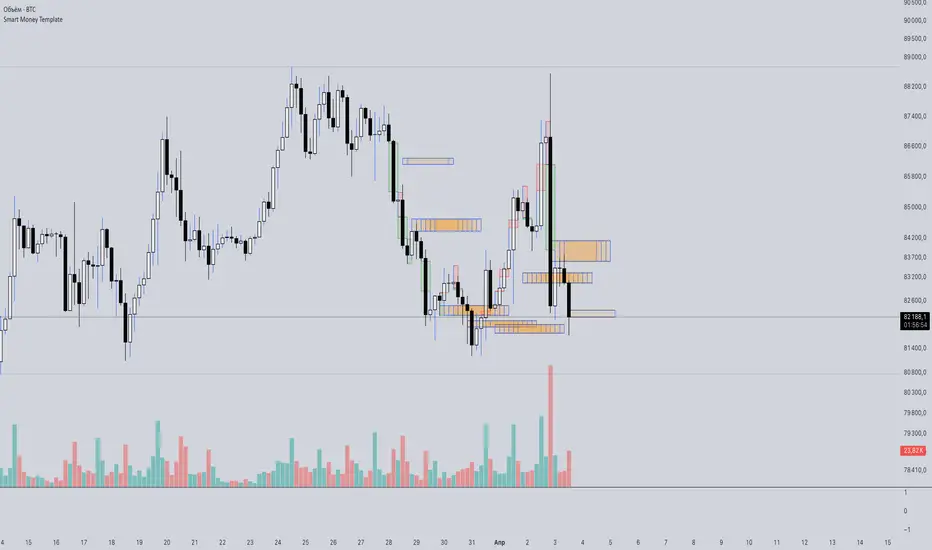
Smart Money Template📈 Smart Money Concepts – BOS / CHoCH / Order Blocks / OTE / FVG
Version: 1.0
Framework: Pine Script v5
Category: Smart Money / Price Action / Institutional Concepts
🧠 Indicator Overview
This indicator is a complete Smart Money Concepts (SMC) toolkit, built to help traders identify institutional activity and market structure shifts using key SMC principles:
• BOS (Break of Structure)
• CHoCH (Change of Character)
• Order Blocks (OB)
• OTE Zones (Optimal Trade Entry)
• FVGs (Fair Value Gaps / Imbalances)
This tool provides visual clarity and high-probability trade zones by automating what professional traders do manually.
⸻
🔍 Core Features
✅ BOS & CHoCH Detection
Automatically detects market structure breaks using HH/LL logic. BOS is highlighted when price breaks significant swing highs/lows.
✅ Order Block Zones
Draws boxes around the last bullish/bearish candle before a displacement (impulse move), showing potential institutional OB zones.
✅ OTE Zone Mapping
Calculates the Optimal Trade Entry zone between 0.705–0.79 of a price leg using Fibonacci logic. A powerful confluence area when combined with OBs.
✅ Fair Value Gap (FVG)
Detects imbalances between candles that often act as magnets for price. Visualizes price inefficiencies for future retests.
✅ Custom Inputs
You can toggle any feature on/off for cleaner analysis: BOS/CHoCH, OBs, OTE, and FVGs.
⸻
⚙️ How It Works
1. Structure Recognition:
• The script checks for Higher Highs / Lower Lows to determine trend context.
• A BOS/CHoCH label appears when structure shifts.
2. Order Blocks:
• A bullish OB is detected when the previous candle is bearish and the current one closes above its high.
• A bearish OB is vice versa.
3. OTE Levels:
• Based on daily range from high to low.
• Highlights 0.705–0.79 as a potential retracement entry zone (optimal sniper entry).
4. FVG Detection:
• If there is a gap between candle 3 and candle 1 (current candle), it is marked as an imbalance zone.
🎯 Best Use Cases
• Entry confirmations using CHoCH + OB + OTE confluence
• Liquidity grabs + FVG retest setups
• Institutional trend reversals (AMD cycles)
• Smart retracement entries using OTE zones
⸻
💡 Tips for Traders
• Works best on 15m, 1H, 4H, or Daily charts
• Combine with liquidity sweep logic, volume profile, or your own strategy for sniper precision
• Backtest using BOS + OB + FVG + OTE for high-RR setups
⸻
🛠️ Upcoming Features (Optional)
• Risk:Reward Ratio Tool
• Stop Hunt Detection (SSL/BSL)
• Volume + Sponsored Candle Filter
• Alerts for BOS / OB reaction
• SFP Pattern recognition
⸻
Disclaimer:
This tool is for educational purposes only and should be used in conjunction with your own risk management and strategy. Not financial advice.
⸻
Body Percentage of Range (Colored)Short Description:
This indicator measures the dominance of the candle's body relative to its total range (High - Low), providing a visual gauge of intra-candle strength versus indecision. Columns are colored based on whether the body constitutes more or less than a defined percentage (default 50%) of the candle's total height.
Detailed Description:
What it Does:
The "Body Percentage of Range" indicator calculates, for each candle, what percentage of the total price range (High minus Low) is occupied by the candle's body (absolute difference between Open and Close).
A value of 100% means the candle has no wicks (a Marubozu), indicating strong conviction during that period.
A value of 0% means the candle has no body (a Doji), indicating perfect indecision.
Values in between show the relative balance between the directional move (body) and the price exploration/rejection (wicks).
How to Interpret:
The indicator plots this percentage as columns:
Column Height: Represents the percentage of the body relative to the total range. Higher columns indicate a larger body dominance.
Column Color:
Green Columns: Appear when the body percentage is above the user-defined threshold (default 50%). This suggests that the directional move within the candle was stronger than the indecision (wicks). Often seen during trending moves or strong momentum candles.
Red Columns: Appear when the body percentage is at or below the user-defined threshold (default 50%). This suggests that wicks dominate the candle (body is 50% or less of the range), indicating significant indecision, struggle between buyers and sellers, or potential reversals. These are common in choppy, consolidating, or reversal market conditions.
Orange Line (Optional MA): A Simple Moving Average (SMA) of the body percentages is plotted to help smooth the readings and identify broader periods where candle structure indicates more trending (high MA) vs. ranging/indecisive (low MA) characteristics.
Potential Use Cases:
Identifying Choppy vs. Trending Markets: Sustained periods of low, predominantly red columns (and often a low/declining MA) can signal a choppy, range-bound market where trend-following strategies might underperform. Conversely, periods with frequent high, green columns suggest a more trending environment.
Confirming Breakouts/Momentum: High green columns appearing alongside increased volume during a breakout can add conviction to the move's strength.
Spotting Potential Exhaustion/Reversals: A very tall green column after a strong trend, followed immediately by a low red column (like a Doji or Spinning Top pattern appearing on the price chart), might signal potential exhaustion or a pending reversal, indicating indecision has suddenly entered the market.
Filtering Entries: Traders might avoid taking entries (especially trend-following ones) when the indicator shows a consistent pattern of low red columns, suggesting high market indecision.
Settings:
Color Threshold %: Allows you to set the percentage level above which columns turn green (default is 50%).
Smoothing MA Length: Adjusts the lookback period for the Simple Moving Average.
Disclaimer:
This indicator is a tool for technical analysis and should be used in conjunction with other methods (like price action, volume analysis, other indicators) and robust risk management. It does not provide direct buy/sell signals and past performance is not indicative of future results.

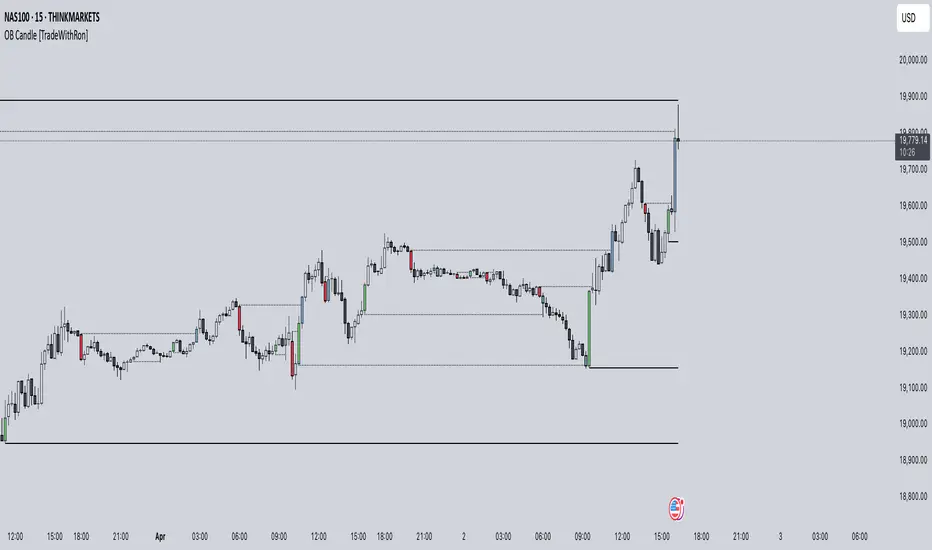
Order Block Candle [TradeWithRon]Order Block Candle
This indicator is designed to help traders identify and visualize key movements within the market. These order blocks are areas where significant buying or selling has occurred, often leading to a strong price reaction. This script detects both bullish and bearish order blocks (with volume spike), marking them directly on your chart, and offers a variety of customization options to enhance your trading experience.
Features:
Bullish and Bearish Candles: Bullish Order Block: Identified when the current price creates a higher high and closes above the previous price, indicating a zone of potential buying activity by institutional traders.
Bearish Order Block: Identified when the current price creates a lower low and closes below the previous price, suggesting strong institutional selling.
Volume-Weighted Analysis: The indicator allows traders to incorporate volume into the order block detection. When a volume pivot (a significant change in volume) is detected, it strengthens the validity of the identified order block.
Customizable Visuals:
- Users can adjust the color and style of order block lines, including solid, dashed, or dotted styles, to suit personal preferences.
- Bullish Order Block Color: Choose from a range of colors to highlight bullish order blocks (default is green).
- Bearish Order Block Color: Choose a color for bearish order blocks (default is red).
- Users can also customize the color and style of the lines representing order blocks, helping traders visually track key levels.
Candle Body or. Wick: The indicator provides flexibility in defining the price range of the order block. Traders can choose whether to calculate the order block using the candle body (open and close) or the full wick (high and low) to suit their trading strategy.
Dynamic Line Extensions: Order block lines are dynamically extended to provide ongoing support and resistance levels. When a price breaks an order block line, the line changes to a dotted style, marking it as "broken." This allows traders to easily spot when the market invalidates an order block.
Alerts:
- Alert for Bullish Order Block: Get notified when a new bullish order block is detected.
- Alert for Bearish Order Block: Receive alerts when a bearish order block is identified.
- Alert for Broken Lines: Set up alerts to be notified when a bullish or bearish order block line is broken, giving traders a signal for potential market shifts.
Zone Management:
- The indicator tracks upper and lower zone information, marking significant price levels where institutional buying or selling might occur. Traders can adjust settings to define how many previous lines should be displayed on the chart for reference.
Optional Mitigated Order Blocks:
- A feature that highlights mitigated (neutralized) order blocks with a specific color and line style, offering additional insight into market behavior.
Input Settings:
- Length: The number of bars to the left and right of a pivot point for it to be considered a high or low.
- Candle Body: Option to use the candle body for calculations (as opposed to the wick).
- Bullish and Bearish Candle Color: Customizable colors for bullish and bearish order blocks.
- Open Line Style: Choose between solid, dashed, or dotted line styles for order block visualization.
- Removed Old Lines: Control the number of broken lines shown on the chart.
- Mitigated Line Style: Select line style for mitigated order blocks.
- Volume Use: Enable volume-based detection for stronger order block validation.
How to Use:
This indicator is ideal for traders looking to trade around institutional support and resistance levels. The bullish and bearish order blocks can serve as key entry or exit points, while broken lines offer dynamic support/resistance that adapt to market changes. Use the alerts to stay informed of critical market developments and adjust your trading strategy accordingly.
🔶 Disclaimer
Use with Caution: This indicator is provided for educational and informational purposes only and should not be considered as financial advice. Users should exercise caution and perform their own analysis before making trading decisions based on the indicator's signals.
Not Financial Advice: The information provided by this indicator does not constitute financial advice, and the creator (Tradewithron) shall not be held responsible for any trading losses incurred as a result of using this indicator.
Backtesting Recommended: Traders are encouraged to backtest the indicator thoroughly on historical data before using it in live trading to assess its performance and suitability for their trading strategies.
Risk Management: Trading involves inherent risks, and users should implement proper risk management strategies, including but not limited to stop-loss orders and position sizing, to mitigate potential losses.
No Guarantees: The accuracy and reliability of the indicator's signals cannot be guaranteed, as they are based on historical price data and past performance may not be indicative of future
Today's Daily LevelsTrack daily price action like a pro with instant visibility of key levels, percentages, and P&L values - all in one clean view.
• Shows Daily Open, High, Low & Median levels
• Dynamic color-coding: green above open, red below
• Real-time price labels with:
Exact price levels
% distance between levels
Point values
Dollar values per contract
• Auto-repaints on timeframe changes
• 30min alerts for median crosses

Rubotics TDI Top/Bottom Indicator**Rubotics TDI Top/Bottom Indicator (Rubots TDI T/B)**
This proprietary indicator integrates several technical analysis tools into one cohesive system to help traders identify potential top and bottom signals directly on the price chart. Unlike standard indicators that merely plot common metrics, this script uniquely fuses a custom moving average algorithm with established oscillators to enhance signal clarity and market timing.
**Core Components and Unique Features:**
- **Global Visual Settings:**
- Easily toggle visual elements (tables, background highlights) that display key metrics and trading setup information.
- Provides a detailed on-chart display of strategy data and essential trading parameters.
- **MAVW Calculation (Proprietary):**
- Computes a series of weighted moving averages using Fibonacci-inspired lengths (3, 5, 8, 13, 21, 34) to generate a dynamic moving average (MAVW).
- The MAVW line is color-coded—blue when trending upward, red when trending downward, and yellow when neutral—to offer an immediate visual cue of market direction.
- **RSI Module:**
- Calculates the RSI on a user-selected price source (default: close) with a customizable period (default: 14).
- Adjustable thresholds (default: 45 and 55) allow for fine-tuning of overbought and oversold conditions.
- **TDI Component:**
- Adapts the RSI into a dynamic channel using a simple moving average and a scaled standard deviation (multiplied by 1.6185) to form upper and lower bands.
- Incorporates both fast and slow moving averages (default periods: 2 and 7) with optional band filling to visually highlight momentum changes.
- **Note:** The TDI logic is based on public methodologies for converting RSI data into a dynamic indicator.
- **WaveTrend Oscillator:**
- Uses configurable channel and smoothing parameters to generate a WaveTrend line for additional momentum confirmation.
- The oscillator is used to further validate top and bottom signals by identifying overbought or oversold conditions.
- **Note:** The WaveTrend calculations are derived from widely available, public-domain techniques.
- **Signal Generation:**
- **Buy Signal:** Generated when the RSI is below its lower threshold, the TDI fast MA crosses above the lower band (with prior bar confirmation), the price is below the MAVW, and the WaveTrend indicates oversold conditions.
- **Sell Signal:** Generated when the RSI is above its upper threshold, the TDI fast MA crosses below the upper band (with prior bar confirmation), the price is above the MAVW, and the WaveTrend signals overbought conditions.
- Signals are visually marked on the chart with upward and downward triangles and accompanied by alert conditions.
- **Volume-Based Bar Coloring & Additional Visuals:**
- Colors price bars based on volume relative to a moving average to highlight the strength of moves.
- Provides background color changes and a dynamic table of key metric values (MAVW, RSI, TDI bands, WaveTrend) for real-time analysis.
**Customization and Originality:**
- Extensive input parameters allow traders to adjust each component to suit their trading style and market conditions.
- The unique combination of the proprietary MAVW calculation with traditional RSI, TDI, and WaveTrend elements creates a robust system for detecting market tops and bottoms.
- **Closed-Source Justification:**
This indicator is published as a closed-source script due to the proprietary enhancements integrated into the MAVW algorithm and signal generation logic. These unique modifications provide added value beyond standard public indicators.

Vertical Line at Specified HoursThis script helps you easily separate time.
This indicator can be used for many different purposes. For example, I use it to separate different days and sessions.
Features :
1- Ability to use 10 vertical lines simultaneously
2- The Possibility to change the color of lines
3- The Possibility to change the line type
Tip : The times you enter in the input section must be in the New York time zone.

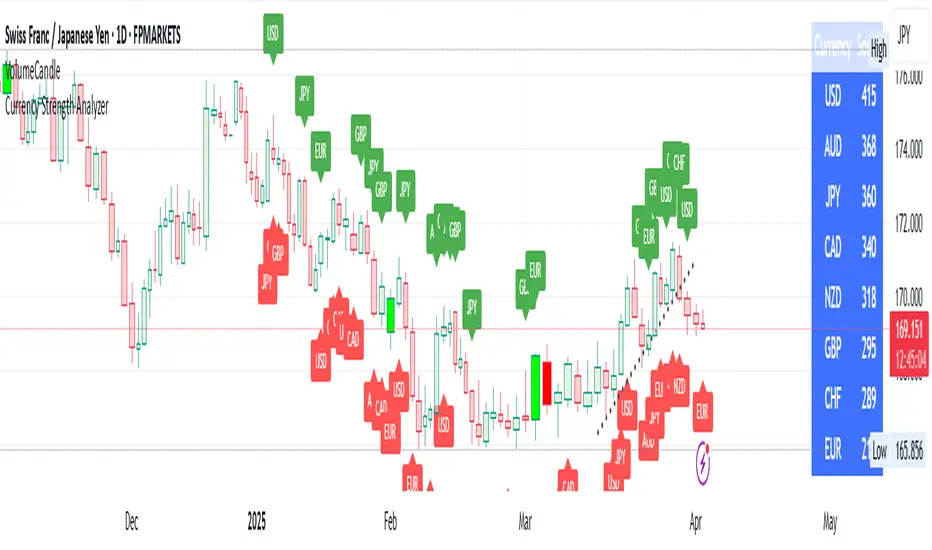
Currency Strength AnalyzerThis indicator calculates and ranks the strength of eight major currencies (AUD, CAD, CHF, EUR, GBP, JPY, NZD, USD) based on a stochastic-based scoring system. It retrieves forex pair data and determines each currency's relative strength using a customized scoring method.
Features:
Uses stochastic (Stoch) indicators to calculate bullish/bearish strength.
Aggregates scores for each currency based on multiple forex pairs.
Sorts currencies from strongest to weakest.
Displays results in a dynamically updated table.
Highlights the strongest and weakest currencies on the chart.
This tool helps traders identify potential trends and reversals in the forex market by visually comparing currency strengths in real-time.
yatofxDescription: "Ramon Coto's 3 Session Bar Color" Indicator
This TradingView Pine Script indicator colors candlestick bars based on three custom trading sessions. It allows traders to visually distinguish different market timeframes on their charts.
Features:
Three configurable trading sessions with user-defined time ranges.
Customizable session colors:
Session A → Blue
Session B → Red
Session C → Lime
Enable/disable sessions independently using input toggles.
Automatic session detection: Bars are colored based on the active session.
Optimized for TradingView Mobile & Desktop with clear and efficient logic.
How It Works:
1. User Inputs: The script takes session time ranges and enables/disables each session.
2. Session Detection: The script checks whether the current time falls within any of the defined sessions.
3. Bar Coloring: If a session is active, the corresponding color is applied to the bars.
This indicator helps traders quickly recognize which market session they are in, improving decision-making for session-based strategies.

Breaking Structures (javieresfeliz)This TradingView script is designed to identify market structure changes, using a break of highs and lows approach, as well as technical indicators such as ATR, RSI, and EMAs (Exponential Moving Averages). It is aimed at detecting bullish and bearish trends, signaling possible entry and exit points based on various factors. It also offers additional confirmations to avoid false signals and provides a clear visualization of buy and sell signals.
Main Features:
Indicators Used:
ATR (Average True Range): Used to calculate a volatility range, which helps set stop-loss levels and price targets based on the current market volatility.
EMAs (50 and 200): Exponential Moving Averages (EMAs) are used to determine the short-term and long-term trends. The 50-period EMA is used to identify the short-term trend, while the 200-period EMA is used to identify the long-term trend.
RSI (Relative Strength Index): Used to identify overbought or oversold conditions in the market, providing additional buy or sell signals.
Volume: Used to confirm the validity of a signal. An increase in volume can confirm a structure break and provide more reliability to the signal.
Break of Structure Detection (BOS):
Bullish Break: Generated when the price surpasses previous highs.
Bearish Break: Generated when the price falls below previous lows.
Change of Character (CHOCH):
Bullish Trend: Defined by a close above the open and above the 50 EMA.
Bearish Trend: Defined by a close below the open and below the 50 EMA.
Buy and Sell Conditions:
Buy (Long): Activated when several conditions are met, including a bullish change of character, a bullish structure break, the price closing above the previous value plus a multiple of the ATR, and additional confirmations from RSI and volume.
Sell (Short): Activated when several conditions are met, including a bearish change of character, a bearish structure break, the price closing below the previous value minus a multiple of the ATR, with additional confirmations from RSI and volume.
Entry and Exit Signals:
Long Entry (Buy): Executed when the buy conditions are met.
Short Entry (Sell): Executed when the sell conditions are met.
Position Close: Positions are closed when the price crosses below (for long positions) or above (for short positions) the 50 EMA.
Historical Highs and Lows Lines:
The script draws lines of historical highs and lows from the last 288 and 60 periods to show key support and resistance levels on the chart.
Signal Table Across Multiple Timeframes:
The script displays a table in the top-right corner of the chart with indicators like the EMA trend, RSI value, and MACD histogram for timeframes of 1 minute, 5 minutes, 30 minutes, 1 hour, 4 hours, daily, and weekly.
Precautions:
Does not guarantee profits: Although the script is designed to detect structure breaks and possible trend changes, it does not guarantee 100% profitable signals. The market is always subject to risk and unpredictable volatility.
Requires adjustments for each asset: Parameters such as ATR length and EMA lengths should be adjusted according to the asset being analyzed and market conditions.
Use of additional confirmations: To reduce false signals, the script uses additional confirmations like RSI and volume, but it is always recommended to perform additional analysis before making trading decisions.
Changing trends: The change of character (CHOCH) can be a useful indicator, but it can give false signals in highly volatile markets or during prolonged consolidations.
Relies on historical data: This script relies on historical data to identify highs and lows. It does not consider fundamental events that may significantly impact the market.
Requires constant monitoring: Although the signals are automated, it is important to monitor open positions and make adjustments if market conditions change.
Risk of false signals: In low liquidity markets or consolidations, structure breaks can be false, so it’s recommended to pay attention to any additional confirmation signals or use a proper risk management strategy.

MarketLuminaMarketLumina: A Comprehensive Technical Analysis Tool
MarketLumina is a technical analysis indicator crafted by a team of traders and developers in Germany. Built for TradingView’s Pine Script, it integrates trend visualization, signal generation, and real-time market insights to provide a multifaceted view of market conditions. This tool is designed to support traders in analyzing trends, spotting potential reversals, and evaluating market dynamics across various timeframes.
The best way to get started with MarketLumina is to take your time exploring its wide range of features. Dive in, experiment, and find the 2-3 tools that feel just right for you. Whether you’re a day trader looking for quick signals, a swing trader tracking trends, or an investor watching the bigger picture, MarketLumina lets you pick and choose what works best. Over time, you’ll craft your own unique trading strategy, perfectly tailored to your goals, preferences, and risk tolerance.
Key Features
Fibonacci Trend-Cloud
Displays market direction through Fibonacci-weighted moving averages. The cloud’s color—green (bullish), red (bearish), or yellow (caution)—reflects prevailing conditions, while its width indicates trend intensity.
Advanced Signal System
Generates signals derived from RSI, momentum, volume, money flow, volatility, price action, divergences, specific cloud-interactions, divergences and historical data. Signal categories include strong reversals, potential reversals, short-term tops/bottoms, strong trend, oversold/overbought conditions, exit signals, and money flow strategy triggers.
LuminaPulse – Real-Time Market Insight
A proprietary module that delivers real-time market analysis through a dashboard of six progress bars, each tailored to the symbol and timeframe using a machine learning approach. It screens historical data—key levels, consolidation zones, volatility spikes, and past price reactions—to optimize insights.
Support & Resistance Zones
Highlights critical price levels using volume-weighted historical data and price-action pivot points.
Candlestick-Overlay
Applies color coding to candlesticks—green (bullish), red (bearish), yellow (caution)—to emphasize signal-relevant bars.
Usage Instructions
MarketLumina is intended as a component of a broader analytical framework.
Below are general guidelines for its application:
Multi-Timeframe Analysis
Align signals with trends on higher timeframes for context.
LuminaPulse Interpretation
Evaluate confluence across trend strength, momentum, money flow, and volume to assess market conditions. Additionally, monitor squeeze conditions for potential breakout signals and volatility to gauge market activity.
Trend-Cloud Context
Use the Fibonacci Trend-Cloud’s direction and width as a filter for signal relevance.
Usage Instructions for MarketLumina’s Advanced Signal System
The Advanced Signal System is a core component of MarketLumina, designed to empower traders by generating a variety of signals derived from RSI, momentum, volume, money flow, volatility, divergences, price action, and more. These signals are organized into distinct categories to help you identify key market conditions and uncover potential trading opportunities.
Below is a comprehensive guide to each signal category, including descriptions, interpretations, and practical applications to enhance your trading decisions:
Strong Reversals
Reversal Signals are generated using a complex price action and volatility algorithm, pinpointing significant potential turning points in the market with elevated confidence.
How to Use:
Look for these signals near critical support or resistance levels, especially when supported by the Fibonacci Trend-Cloud or LuminaPulse metrics.
Treat them as powerful reversal cues when they align with overarching market trends or follow prolonged price movements.
Interpretation:
A bullish Reversal signal flags a strong probability of an upward reversal, often in oversold conditions, suggesting a shift to bullish momentum.
A bearish Reversal signal points to a likely downward reversal, typically in overbought scenarios, indicating bearish potential.
Their reliability increases with confluence factors like divergences or a notable shift in money flow.
Potential Reversals
These signals flag possible trend continuation after a pullback based on price action, RSI thresholds and specific trend-cloud interaction, offering early insights with moderate certainty compared to strong reversals.
How to Use:
Use them as preliminary alerts for potential reversals of a pullback continuing its trend, particularly near support or resistance zones.
Validate their strength with additional tools like the Trend-Cloud thickness or LuminaPulse to gauge reliability.
Interpretation:
Bullish potential reversals hint at the onset of an upward move, while bearish ones suggest a downward continuation may be brewing.
Ideal for spotting early opportunities, these signals gain credibility when paired with confirming indicators.
Short-Term Tops/Bottoms
These signals mark temporary price extremes, identifying short-term tops or bottoms within a trend, driven by Multi-RSI algorithms.
How to Use:
In trending markets, leverage these signals to anticipate brief pullbacks or corrections within the dominant direction.
In range-bound markets, use them to pinpoint reversal points within the established range.
Interpretation:
A short-term top indicates a temporary possible high, offering opportunities to lock in profits or brace for a dip.
A short-term bottom suggests a fleeting low, signaling a potential bounce or recovery within the larger trend.
Oversold/Overbought Conditions
This category highlights extreme market states with oversold/overbought conditions, derived from RSI and price action.
How to Use:
In strong trends, these signals affirm the likelihood of potential temporary exhaustion.
In weaker trends, they signal potential exhaustion and could early indicate reversals.
Interpretation:
Oversold signals in strong trends could mark a short-term break or slower trend continuation and should not be interpreted as a reversal signal.
Strong Trend
These signals flag possible trend continuation based on six key metrics—RSI, Money Flow, Momentum, and more—align to confirm robust momentum.
How to Use:
In strong trends, these signals affirm the likelihood of a continuation.
Interpretation:
Strong trend signals could be interpreted as a confirmation of the bullish movement and a possible continuation.
Money Flow Strategy Triggers
Built on money flow analysis, these signals track capital inflows and outflows on multiple timeframes to reveal shifts in buying or selling pressure, offering a window into market sentiment.
How to Use:
Deploy these triggers to refine entry or exit timing, especially when they sync with other signals and the Trend-Cloud’s direction.
Pair them with LuminaPulse’s Money Flow, Momentum and volume sentiment for a deeper understanding of market participation.
Interpretation:
Positive money flow triggers indicate rising buying pressure, often a precursor to upward price action.
Negative money flow triggers signal increasing selling pressure, potentially foreshadowing a downturn.
Their value shines when diverging from price action, exposing hidden strength or weakness in the market.
Usage Instructions for LuminaPulse
LuminaPulse is a standout feature of MarketLumina, delivering real-time insights into market conditions through a sophisticated, machine-learning-driven approach. It analyzes historical data unique to each symbol and timeframe—examining past key levels, consolidation zones, volatility spikes, and price reactions—to create a dashboard of six progress bars.
These bars represent the strength of critical market factors:
Money Flow
Momentum
Volume
Strength (Trend Strength)
Squeeze
Volatility
Each bar is color-coded—green for bullish conditions, red for bearish—and its fill level reflects the factor’s strength relative to historical patterns. A fully loaded bar suggests a high likelihood of a notable price reaction, based on how the market has responded to similar conditions in the past. What makes LuminaPulse unique is its ability to tailor these insights to the specific symbol and timeframe, going beyond raw metrics to show their historical significance.
Additionally, each bar features a "Ghost-Progress" overlay, marking the highest strength level reached in the current trend. This allows you to see whether the current strength is nearing or retreating from recent peaks, adding depth to your analysis.
How to Use LuminaPulse
LuminaPulse is a confirmation tool, not a standalone signal generator. It shines when paired with other MarketLumina features, like the Fibonacci Trend-Cloud or Advanced Signal System, as part of a broader trading strategy.
Here’s how to apply it effectively:
Seek Confluence
Check for alignment across multiple bars. For example, if Money Flow, Momentum, and Volume are all green and highly filled, it could indicate strong bullish potential.
Spot Divergences
Look for mismatches between price action and the bars. If price rises but Momentum weakens, it might hint at a fading trend.
Monitor Squeeze: A fully loaded Squeeze bar signals consolidation and potential volatility ahead. Use other tools to predict the breakout direction.
Assess Volatility: The Volatility bar sets the context—high levels suggest bigger price swings, while low levels indicate a calmer market.
Interpreting Each Progress Bar
1. Money Flow
Measures the strength of money flowing into or out of the market, compared to historical thresholds, key-levels and past price reactions, using a machine learning approach, tailored to the symbol and timeframe. It’s not just the raw money flow index—it’s the likelihood of a price move based on historical similar money flow movements.
How to Use:
Look for a fully loaded bar alongside a strong Momentum bar near key levels or signals.
Watch for a bar switching colors (e.g., red to green) with a robust Momentum bar for potential trend shifts.
Treat it as the fuel behind price moves, not the absolute flow level.
Interpretation:
A fully loaded green bar suggests strong buying pressure; a red bar indicates selling pressure.
Divergence (e.g., price up, Money Flow down) can signal an impending reversal—confirm with other tools.
2. Momentum
Gauges the strength and direction of price momentum, factoring in historical key levels, volatility, and past reactions, optimized by a machine learning approach, tailored to the symbol and timeframe. It reflects momentum’s strength and potential impact, not just its current state.
How to Use:
Pair a fully loaded bar with a strong Money Flow bar near signals or key levels.
A switching bar (e.g., bearish to bullish) with a solid Money Flow bar may hint at a trend change.
View it as the driving force behind price momentum.
Interpretation:
A fully loaded green bar signals powerful upward momentum; a red bar shows downward force.
Divergence from price action (e.g., price down, Momentum up) can be a reversal clue—verify with confluence.
3. Volume
Shows whether volume is pushing price up or down, based on historical patterns and key levels near the current price, tailored to the symbol and timeframe.
How to Use:
Look for a bar over 50% filled, aligned with Money Flow and Momentum, near signals or key levels.
Combine a strong bar with a fully loaded Squeeze bar for breakout potential.
See it as the muscle behind buying or selling pressure.
Interpretation:
A green bar over 50% suggests volume supports upward moves; a red bar indicates downward pressure.
Alignment with other bars near support/resistance can confirm breakouts or rejections.
4. Strength (Trend Strength)
Focuses on the current trend’s robustness, comparing it to historical price movements, trend direction, and volatility. It helps spot pullbacks or early trend-shift warnings.
How to Use:
Watch for a fully loaded bar opposite your trade, paired with weakening Money Flow or Momentum, as an exit cue.
For reversals, confirm a fully loaded bar with at least two other aligned bars.
Use it to gauge the power of short-term price action.
Interpretation:
A fully loaded bar with supporting bars confirms trend strength.
A dropping bar as price tests key levels may signal a pullback or shift—check support/resistance.
5. Squeeze
Highlights consolidation and building pressure from buyers and sellers, suggesting a big move ahead. Its color reflects the trend but isn’t a reliable directional guide.
How to Use:
A fully loaded bar signals an imminent breakout—use other indicators for direction.
Pair with strong Strength and Volume for timing confirmation.
Treat it as a timing tool, not a directional one.
Interpretation:
A fully loaded bar means a significant move is likely, but not where it’s headed.
Use it to prepare for action, not to predict the outcome—direction comes from confluence.
6. Volatility
Measures current volatility relative to historical levels, using a machine learning approach to analyze past volatility and duration patterns specific to the symbol and timeframe. A calm bar might still appear during big swings if that’s normal for the asset or a calm bar could appear after a big move if it's normal for the asset to show single volatility spikes with consolidation afterwards.
How to Use:
Use a high Volatility bar (fully loaded) to favor short-term trades; a low bar (empty) suggests a quieter market.
Pair with Squeeze to anticipate breakout strength.
Adjust your strategy based on the market’s activity level.
Interpretation:
A fully loaded bar signals high volatility and bigger swings; an empty bar indicates low volatility and smaller moves.
Context is key—high volatility for one symbol might be calm for another, based on its history.
Key Features of LuminaPulse
Tailored Insights: Each bar’s strength is customized to the symbol and timeframe’s historical behavior, making it uniquely relevant.
Ghost-Progress: See the peak strength in the current trend, helping you judge if conditions are peaking or fading.
Individual-Adapting Edge: Algorithms adapt to historical data, ensuring insights reflect past reactions, not just current values.
Important Notes
LuminaPulse is a complex, unique tool designed to enhance your analysis, not dictate trades. Its strength lies in its historical context and real-time adaptability, but it’s most effective when combined with other MarketLumina features and your own strategy.
Illustrative Scenarios
Trend Continuation Example
Picture a market where momentum is steadily building. The Fibonacci Trend-Cloud turns red across both the primary and higher timeframes, reflecting a strong bearish direction. As this trend takes shape, reversal or strategy-based signals begin to line up with the cloud’s downward tilt, hinting at sustained weakness. Short-term bottoms and tops might start forming, offering clues about the trend’s rhythm, while a widening cloud could suggest growing confidence in the move. This setup showcases how the indicator can highlight a trend gathering steam, with multiple features reinforcing the direction.
Reversal Example
Imagine a market that’s been rising but approaches a key support zone. Suddenly, strong reversal signals flash on the chart, catching attention near this critical level. Price action starts to stabilize or reject, while LuminaPulse metrics show a subtle uptick in momentum or a shift in volume sentiment. As the market tests this zone, opposing signals fade, and the potential for a downward turn becomes clearer. This scenario illustrates how the indicator’s signals and metrics can converge to spotlight a possible shift in direction.
Pullback Analysis Example
Consider a strong bullish trend unfolding on the higher timeframe, painting a broad picture of upward movement. Zooming into the lower timeframe, a brief retracement emerges, pulling price back toward a support level. Here, strategy-based or reversal signals might pop up, marking this as a key area to watch. LuminaPulse could reveal a slowdown in downward momentum or a tightening of trend strength, suggesting the retracement might be running out of energy. This example demonstrates how the indicator can help dissect a pullback, revealing opportunities within an ongoing trend.
Range-Bound Market Example
Envision a market stuck in a sideways drift, with the Fibonacci Trend-Cloud narrowing and turning yellow—a sign of consolidation. Reversal signals begin appearing near support and resistance zones, hinting at potential bounces within the range. LuminaPulse metrics might spike, showing bursts of volatility or squeeze conditions building up. As price nears these boundaries, the chance of a breakout looms, with retests of the zones offering further clarity. These examples show how MarketLumina’s features—like the cloud’s color and width, signal alignments, and LuminaPulse shifts—can work together to illuminate market dynamics. Whether it’s a trend gaining traction, a reversal brewing, a pullback pausing, or a range tightening, the indicator provides visual and analytical cues to explore. By watching how these elements evolve, you can get a feel for the market’s rhythm and sharpen your understanding of what to look for in different situations.
Legal Notices
MarketLumina is a technical analysis tool, not a substitute for professional financial advice.
Trading carries inherent risks; past performance does not guarantee future outcomes.
All content is provided for educational purposes only and does not constitute trading recommendations. Users bear full responsibility for their trading decisions and are urged to prioritize robust risk management.
