Twin Range Filter – Buy/Sell SignalsThe Twin Range Filter is a trend-following indicator that combines two adaptive volatility filters to identify potential market reversals and trend continuations. It uses two configurable smoothing periods (fast and slow) to calculate a dynamic range around price, filtering out market noise and highlighting meaningful shifts in direction.
This indicator plots BUY and SELL signals based on price action in relation to the range filter, as well as internal trend conditions.
✅ How It Works:
Long Signal (BUY) is triggered when:
Price is above the filtered range (showing strength), and
Short-term upward momentum is confirmed.
Short Signal (SELL) is triggered when:
Price is below the filtered range (showing weakness), and
Short-term downward momentum is confirmed.
The signals are highlighted using green "Long" and red "Short" labels on the chart.
Background colors reinforce the current directional bias.
🔔 Alerts:
Long Signal – A new BUY condition has been detected.
Short Signal – A new SELL condition has been detected.
📌 Use Cases:
Entry timing for swing or intraday trades
Trend confirmation filter
Signal generator in automated strategies (when paired with a strategy script)
Candlestick analysis

DAX Inducere Simplă v1.3 – Confirmare InducereDAX Inducere Simplă v1.3 – Confirmare Inducere ,signals before fvg mss and displacement

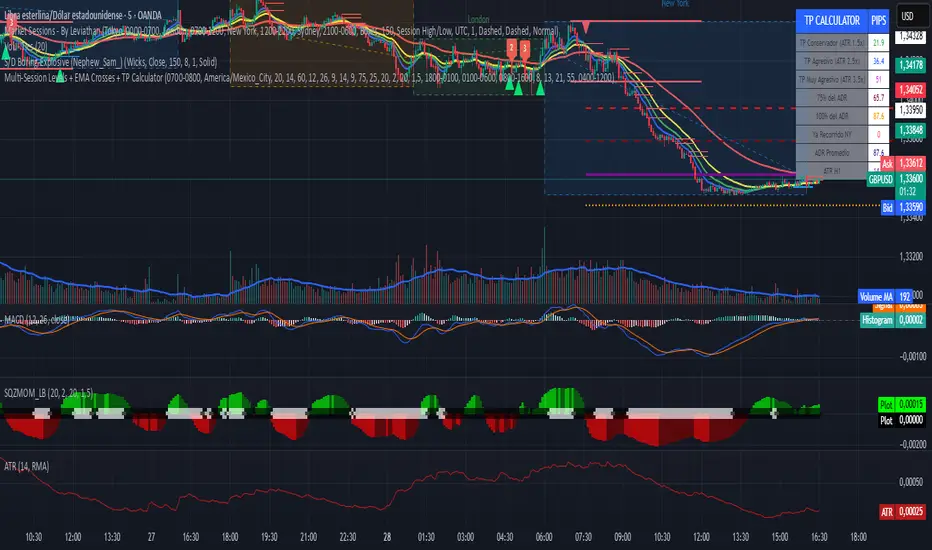
Multi-Session Levels + EMA Crosses + TP Calculator (GBP/USD)# Multi-Session Levels + EMA Crosses + TP Calculator
## 📋 Description
**Advanced trading indicator combining multi-session analysis, EMA cross validation, and automated Take Profit calculations for Forex markets.**
This comprehensive tool integrates session-based level analysis with validated EMA crossovers and intelligent TP calculations, designed specifically for serious traders who need precise entry signals with calculated exit strategies.
## 🎯 Key Features
### 📊 **Multi-Session Analysis**
- **Asian Session (6PM-1AM Mexico)**: Generates key support/resistance levels
- **London Session (1AM-6AM Mexico)**: Analyzes manipulation patterns
- **New York Session (8AM-4PM Mexico)**: Dynamic levels with trend confirmation
- **AMD Setup Detection**: Combines all sessions for high-probability setups
### 📈 **Advanced EMA System**
- **4 EMAs**: 8, 13, 21, and 55 periods with visual display
- **Validated Crossovers**: EMA 8 vs EMA 13 with multiple confirmations
- **Smart Filtering**: Only shows signals during optimal trading hours (6AM-12PM Mexico)
### ✅ **Triple Validation System**
- **MACD Confirmation**: Histogram strength + signal line position + momentum direction
- **RSI Filter**: Overbought/oversold levels with moving average confirmation
- **Squeeze Momentum**: Bollinger Bands vs Keltner Channels compression detection
### 💰 **Intelligent TP Calculator**
- **ADR-Based Targets**: Uses Average Daily Range for realistic profit expectations
- **ATR Multipliers**: Conservative (1.5x), Aggressive (2.5x), Very Aggressive (3.5x)
- **Session-Aware**: Considers already-traveled distance in NY session
- **Real-Time Table**: Live pip calculations for all TP levels
- **Visual Levels**: Automatic TP lines drawn on chart with color coding
### 🚨 **Smart Alert System**
- **Validated Signals Only**: Alerts trigger only when ALL confirmations align
- **TP Integration**: Alerts include suggested take profit levels
- **Non-Validated Tracking**: Shows basic crosses that don't meet full criteria
## 📐 **Technical Calculations**
### **ADR (Average Daily Range)**
- 20-period average of daily high-low ranges
- Converted to pips for easy interpretation
- Used for percentage-based TP targets (50%, 75%, 100% of ADR)
### **ATR (Average True Range)**
- 14-period ATR from H1 timeframe (configurable)
- Accounts for gaps and volatility
- Base for multiplier-based TP levels
### **Session Tracking**
- Real-time monitoring of NY session range
- Calculates remaining potential movement
- Optimizes TP placement based on session progress
## 🎨 **Visual Elements**
### **Chart Levels**
- **Orange Lines**: Asian and London session levels
- **White/Green/Red Lines**: NY session levels (color changes with trend direction)
- **TP Lines**: Color-coded take profit levels with different styles
### **EMA Display**
- **Blue**: EMA 8 (fastest)
- **Green**: EMA 13 (signal line)
- **Yellow**: EMA 21 (trend filter)
- **Red**: EMA 55 (major trend)
### **Signal Shapes**
- **Bright Triangles**: Fully validated signals
- **Faded Triangles**: Non-validated basic crosses
- **Size Variation**: Signal strength indication
## 📊 **Information Table**
Real-time display showing:
- **TP Levels**: All calculated take profit targets in pips
- **Session Data**: NY range already traveled vs average
- **Volatility Metrics**: Current ATR and ADR values
- **Clean Design**: Easy-to-read format with color coding
## ⚙️ **Customization Options**
### **Session Times**
- Fully configurable session times
- Mexico City timezone support
- Enable/disable individual session analysis
### **Validation Controls**
- Toggle MACD, RSI, Squeeze validation independently
- Adjust RSI overbought/oversold levels
- Customize MACD and Squeeze parameters
### **Display Options**
- Show/hide EMAs, crosses, TP levels, table
- Customize TP calculation periods (ADR, ATR)
- Choose ATR timeframe for calculations
## 🎯 **Ideal For**
- **Forex Day Traders**: Especially USD pairs during NY session
- **Session-Based Strategies**: Traders who respect market sessions
- **Risk Management Focus**: Those who need calculated exit strategies
- **Multi-Timeframe Analysis**: Traders using H1-H4 charts
## 📈 **Best Practices**
1. **Use during high-volume sessions** (London-NY overlap)
2. **Wait for full validation** before entering trades
3. **Consider session context** when setting TPs
4. **Combine with proper risk management** (1-2% per trade)
5. **Backtest thoroughly** before live trading
## ⚠️ **Important Notes**
- **Signals work best** during trending market conditions
- **AMD setups** provide highest probability entries
- **TP levels are suggestions** - adjust based on market context
- **Always use stop losses** (not included in this indicator)
- **Designed for Forex markets** - may need adjustment for other instruments
---
*This indicator combines proven technical analysis concepts with modern session-based trading approaches, providing both entry timing and exit planning in one comprehensive tool.*
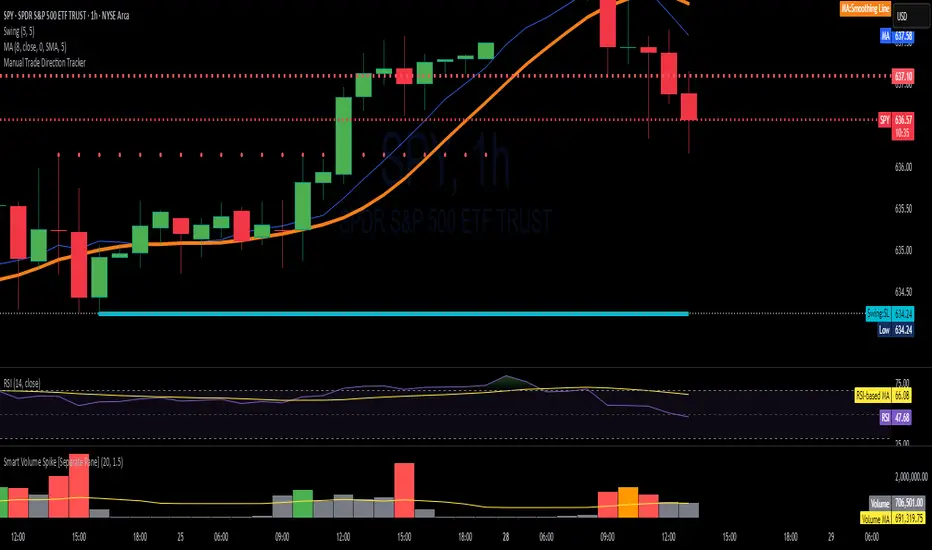
Advanced Swing Breakout + RSI + EMA + Smart Volume SpikeThis indicator is designed to identify high-probability swing trade setups using a confluence of:
Swing High/Low Breakouts
RSI Trend Strength
EMA Directional Bias
Smart Volume Spike Confirmation
It combines key price action levels with volume and momentum filters to generate clean, actionable breakout alerts. It’s perfect for both intraday and swing traders looking to trade breakouts with confirmation from multiple technical layers.
⚙️ How It Works:
✅ Swing Detection:
Plots Swing Highs and Swing Lows based on the past N candles.
Highlights breakouts above highs or breakdowns below lows.
💪 RSI Filter:
Confirms whether the breakout is supported by RSI momentum.
Bullish breakout requires RSI > 50 and price above EMA.
Bearish breakdown requires RSI < 50 and price below EMA.
📈 EMA Trend Bias:
EMA (default 20-period) shows directional bias.
Used as a filter to confirm trade direction.
🔊 Smart Volume Spike:
Detects significant volume spikes above a moving average threshold.
Color-coded bars show whether volume is bullish, bearish, or neutral.
Ensures breakout is not on weak or average volume.
🚨 Alerts Included:
✅ Break Above Swing High: Only triggers when RSI, EMA, and Volume all confirm the move.
⚠️ Break Below Swing Low: Triggered only when bearish conditions are met.
📊 Visual Output:
Swing Highs: 🔴 Red Dots
Swing Lows: 🟢 Green Dots
EMA Line: 🟠 Orange Line
Volume Spike Bars: Appears in separate pane with dynamic color logic.
🧠 Best Use Cases:
Intraday Scalping (5m–15m timeframes)
Swing Trading (1H–4H)
Breakout Confirmation
Volume-Supported Entry Filtering
Multi-Timeframe TrendBelow is a PineScript that calculates the trend for multiple timeframes (5 minutes, 15 minutes, 1 hour, 4 hours, and daily) using the Relative Strength Index (RSI) and Moving Averages (MA) to determine bullish, bearish, or neutral trends. The script displays the trend information on the TradingView chart using a table.
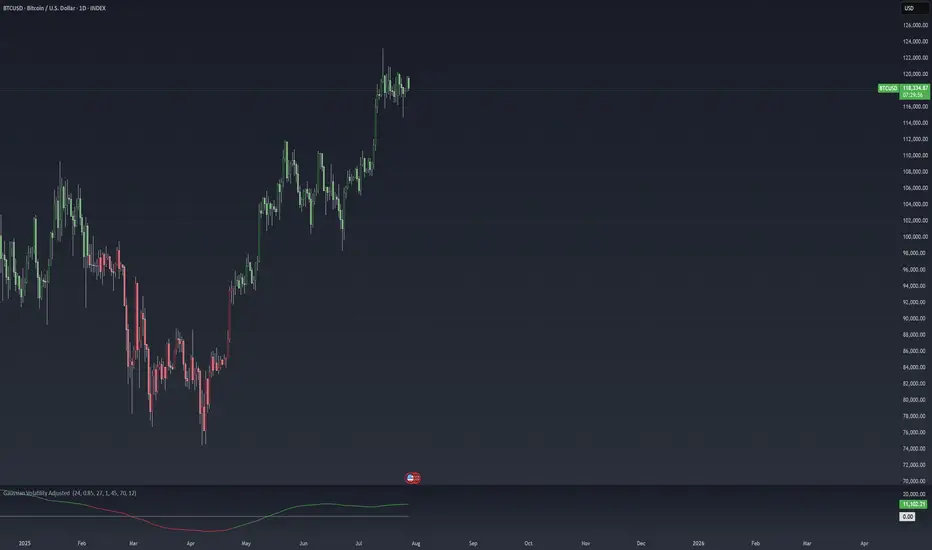
Gaussian Volatility Adjusted Gaussian Volatility Adjusted Indicator
The Gaussian Volatility Adjusted indicator is a powerful tool designed to identify trend direction and momentum by combining a Gaussian-filtered moving average with volatility-based thresholds. By smoothing price data with a Gaussian filter and adjusting for market volatility using Average True Range (ATR) and Standard Deviation (SD), this indicator generates clear bullish and bearish signals. The Exponential Moving Average (EMA) of the momentum difference and price bars are dynamically colored to highlight trend strength, making it easier for traders to identify potential entry and exit points in various market conditions.
How It Works
Gaussian Filter Calculations
Gaussian Filter: Applies a Gaussian smoothing filter to a user-defined price source, typically an EMA of the closing price, over a configurable length (default: 70) with a specified sigma (default: 12). The Gaussian filter uses a weighted sum based on a Gaussian distribution to reduce noise while preserving significant price trends. Weights are calculated using the Gaussian formula and normalized to ensure accurate smoothing.
Base Moving Average: Optionally applies an EMA (default: enabled, length: 45) to the closing price before Gaussian filtering, providing a smoother input for the Gaussian calculation to enhance signal reliability.
Volatility Adjustments
ATR-Based Bands: Calculates the Average True Range (ATR) over a user-defined period (default: 24), scaled by a sensitivity factor (default: 1) and an ATR factor (default: 0.85). These form volatility-adjusted bands around the Gaussian-filtered value:
Upper Band: Gaussian value + (ATR × ATR Factor).
Lower Band: Gaussian value - (ATR × ATR Factor).
Standard Deviation Bands: Computes the Standard Deviation (SD) of the closing price over a user-defined period (default: 27), scaled by the sensitivity factor. These form additional bands:
Upper SD Band: Gaussian value + SD.
Lower SD Band: Gaussian value - SD.
Trend and Momentum SignalsTrend
Detection:Bullish Trend: Triggered when the closing price exceeds the upper SD band, setting the trend to +1.
Bearish Trend: Triggered when the closing price falls below the upper ATR-based band, setting the trend to -1.
Momentum Calculation: Computes a momentum difference (Diff) based on the trend:
For a bullish trend (+1), Diff = Close - Upper ATR Band.
For a bearish trend (-1), Diff = Close - (Gaussian + SD).
EMA of Momentum: Applies an EMA (default length: 45) to the momentum difference to smooth the momentum signal.
Final Trend with EMA Confluences:
If EMA confluence is enabled (default: true), a bullish signal (+1) is confirmed when the trend is +1 and Diff exceeds the EMA of Diff. A bearish signal (-1) is confirmed when the trend is -1 and Diff is below the EMA of Diff.
If EMA confluence is disabled, the final trend follows the initial trend direction (±1).
Visual Representation
The indicator provides a clear and intuitive visual interface:
EMA Line: Plots the EMA of the momentum difference, colored based on the final trend:
Green: Bullish trend (Final_Trend = +1).
Red: Bearish trend (Final_Trend = -1).
Gray: Neutral or no trend.
Zero Line: A dashed line at zero (semi-transparent) serves as a reference for the EMA plot.
Bar Coloring: Price bars are colored to reflect the trend:
Green: Bullish trend (Final_Trend = +1).
Red: Bearish trend (Final_Trend = -1).
No Color: Neutral or no trend.
Volatility Bands: While not plotted in the provided script, the ATR and SD bands are calculated and could be plotted for additional context, marking key levels for trend detection.
Customization & Parameters
The Gaussian Volatility Adjusted indicator offers flexible parameters to suit various trading styles:
Volatility Parameters:
ATR Length: Period for ATR calculation (default: 24).
ATR Factor: Multiplier for ATR-based bands (default: 0.85).
SD Length: Period for Standard Deviation calculation (default: 27).
Sensitivity: Scales ATR and SD for band sensitivity (default: 1).
Moving Average Parameters:
Use EMA Confluence: Enable/disable EMA confluence for trend confirmation (default: true).
EMA Length: Period for EMA calculations (default: 45).
Gaussian Parameter:
Gaussian Length: Period for Gaussian filter (default: 70).
Sigma: Controls the Gaussian filter’s smoothness (default: 12).
Color Settings: EMA line and bars use green for bullish signals, red for bearish signals, and gray for neutral states, with customizable transparency for the zero line.
Trading Applications
This indicator is versatile and can be applied across various markets and strategies:
Trend Following:
Use the final trend signals and bar coloring to identify and follow bullish or bearish trends, with the Gaussian filter reducing noise for clearer trend detection.
Momentum Trading: The EMA of the momentum difference highlights strong momentum shifts, ideal for entering or exiting trades based on trend strength.
Reversal Detection: Monitor price crossings of the ATR and SD bands to identify potential trend reversals, especially when confirmed by the EMA confluence.
Scalping and Swing Trading: Adjust parameters (e.g., ATR length, Gaussian length, or sensitivity) to suit short-term scalping or longer-term swing trading strategies.
Final Note
The Gaussian Volatility Adjusted indicator is a robust tool for traders seeking to leverage smoothed price data and volatility-adjusted thresholds for trend and momentum analysis. Its combination of Gaussian filtering, ATR and SD-based bands, and EMA confluence provides a comprehensive framework for identifying trading opportunities. The dynamic coloring of the EMA line and price bars enhances visual clarity, making it easier to act on signals. As with all indicators, backtest thoroughly and integrate into a comprehensive trading strategy for optimal results.
Kalman VWMA For LoopKalman VWMA For Loop Indicator
The Kalman VWMA For Loop indicator is a sophisticated tool designed to smooth price data using a Kalman filter applied to a Volume Weighted Moving Average (VWMA). By combining the VWMA’s volume-weighted price sensitivity with the adaptive noise reduction of a Kalman filter, this indicator provides traders with a robust momentum and trend-following signal. The indicator includes a customizable for-loop mechanism to potentially iterate over a range of calculations or parameters, enhancing flexibility for advanced trading strategies. Visual outputs are plotted to help traders identify trends and potential trading opportunities with reduced noise.
How It Works
VWMA Calculations
Volume Weighted Moving Average (VWMA): Computes a VWMA based on a user-selected price source (default: Close) over a configurable period (default: 14). The VWMA weights price data by trading volume, providing a more accurate representation of market activity compared to a simple moving average.
Kalman Filter Calculation
Kalman Filter: Applies a Kalman filter to the price source to smooth price movements and reduce noise.
The filter uses:
Process Noise: Controls the adaptability of the filter to price changes (default: 0.01).
Measurement Noise: Adjusts sensitivity to price fluctuations (default: 3).
Filter Order (N): Defines the number of states in the Kalman filter (default: 3), allowing for multi-state modeling of price dynamics.
The Kalman filter iteratively predicts and updates the price estimate using state estimates and error covariances stored in arrays. This process minimizes noise while preserving significant price trends.
For-Loop Mechanism
The script includes a for-loop structure with user-defined parameters (from and to_, defaulting to 1 and 25, respectively). While the provided code does not fully implement the for-loop’s functionality, it is intended to allow iterative calculations or parameter sweeps, such as testing multiple periods or thresholds within the specified range. This feature enhances the indicator’s flexibility for optimization or multi-scenario analysis.
Visual Representations
The indicator plots the VWMA as a red line on the chart, providing a clear visual reference for the volume-weighted trend.
The Kalman-filtered price is calculated but not plotted in the provided code. When plotted, it would appear as a smoothed price line, highlighting the underlying trend with reduced noise.
The for-loop parameters suggest potential for additional visual outputs (e.g., multiple VWMA lines or signals) if fully implemented, but the current script only plots the VWMA.
Customization & Parameters
The Kalman VWMA For Loop indicator offers flexible parameters to suit various trading styles:
Moving Average Parameters:
Price Source: Select the input price (default: Close; options: Close, High, Low, Open).
MA Period: Adjust the VWMA calculation period (default: 14).
Kalman Parameters:
Process Noise: Adjusts the filter’s adaptability to price changes (default: 0.01).
Measurement Noise: Controls sensitivity to price fluctuations (default: 3).
Filter Order (N): Sets the number of states for the Kalman filter (default: 3).
For-Loop Parameters:
From: Starting value for the for-loop (default: 1).
To: Ending value for the for-loop (default: 25).
Color Settings: The VWMA is plotted in red, with potential for additional customizable colors if the for-loop is expanded to plot multiple outputs.
Trading Applications
This indicator is versatile and can be applied across various markets and strategies:
Trend Following:
Use the Kalman-filtered price and VWMA to identify the direction and strength of trends, with the smoothed output reducing false signals in volatile markets.
Momentum Trading: The VWMA highlights volume-driven price movements, allowing traders to enter or exit based on momentum shifts.
Parameter Optimization: The for-loop structure (if fully implemented) enables testing multiple VWMA periods or Kalman parameters, aiding in strategy optimization.
Scalping and Swing Trading: Adjust the MA period and Kalman parameters to suit short-term (scalping) or longer-term (swing trading) strategies.
Final Note
The Kalman VWMA For Loop indicator is a powerful tool for traders seeking to combine volume-weighted price analysis with advanced noise reduction via a Kalman filter. Its customizable parameters and potential for iterative calculations through the for-loop make it adaptable to various trading styles. While the for-loop functionality is not fully implemented in the provided code, completing it could enable dynamic parameter testing or signal generation. As with all indicators, backtest thoroughly and integrate into a comprehensive trading strategy for optimal results.

Venkat Sir RSI 38Here's a Pine Script (TradingView) code that does the following:
Uses the RSI indicator (Relative Strength Index).
Watches for RSI crossing below level 38 and then crossing above 38.
When RSI crosses above 38 (after having gone below), it plots a green triangle-up symbol above the candle that triggered the cross.

Ashish indicator//@version=5
// Copyright (c) 2021-present, Alex Orekhov (everget)
indicator('Ashish indicator', overlay=true)
amplitude = input(title='Amplitude', defval=1)
channelDeviation = input(title='Channel Deviation', defval=2)
showArrows = input(title='Show Arrows', defval=true)
showChannels = input(title='Show Channels', defval=false)
var int trend = 0
var int nextTrend = 0
var float maxLowPrice = nz(low , low)
var float minHighPrice = nz(high , high)
var float up = 0.0
var float down = 0.0
float atrHigh = 0.0
float atrLow = 0.0
float arrowUp = na
float arrowDown = na
atr2 = ta.atr(100) / 2
dev = channelDeviation * atr2
highPrice = high
lowPrice = low
highma = ta.sma(high, amplitude)
lowma = ta.sma(low, amplitude)
if nextTrend == 1
maxLowPrice := math.max(lowPrice, maxLowPrice)
if highma < maxLowPrice and close < nz(low , low)
trend := 1
nextTrend := 0
minHighPrice := highPrice
minHighPrice
else
minHighPrice := math.min(highPrice, minHighPrice)
if lowma > minHighPrice and close > nz(high , high)
trend := 0
nextTrend := 1
maxLowPrice := lowPrice
maxLowPrice
if trend == 0
if not na(trend ) and trend != 0
up := na(down ) ? down : down
arrowUp := up - atr2
arrowUp
else
up := na(up ) ? maxLowPrice : math.max(maxLowPrice, up )
up
atrHigh := up + dev
atrLow := up - dev
atrLow
else
if not na(trend ) and trend != 1
down := na(up ) ? up : up
arrowDown := down + atr2
arrowDown
else
down := na(down ) ? minHighPrice : math.min(minHighPrice, down )
down
atrHigh := down + dev
atrLow := down - dev
atrLow
ht = trend == 0 ? up : down
var color buyColor = color.purple
var color sellColor = color.red
htColor = trend == 0 ? buyColor : sellColor
htPlot = plot(ht, title='Ashish indicator', linewidth=2, color=htColor)
atrHighPlot = plot(showChannels ? atrHigh : na, title='ATR High', style=plot.style_circles, color=sellColor)
atrLowPlot = plot(showChannels ? atrLow : na, title='ATR Low', style=plot.style_circles, color=buyColor)
fill(htPlot, atrHighPlot, title='ATR High Ribbon', color=sellColor, transp=90)
fill(htPlot, atrLowPlot, title='ATR Low Ribbon', color=buyColor, transp=90)
buySignal = not na(arrowUp) and trend == 0 and trend == 1
sellSignal = not na(arrowDown) and trend == 1 and trend == 0
plotshape(showArrows and buySignal ? atrLow : na, title='Arrow Up', style=shape.triangleup, location=location.belowbar, size=size.tiny, color=buyColor)
plotshape(showArrows and sellSignal ? atrHigh : na, title='Arrow Down', style=shape.triangledown, location=location.abovebar, size=size.tiny, color=sellColor)
alertcondition(buySignal, title='Alert: Ashish indicator Buy', message='Ashish indicator Buy')
alertcondition(sellSignal, title='Alert: Ashish indicator Sell', message='Ashish indicator Sell')

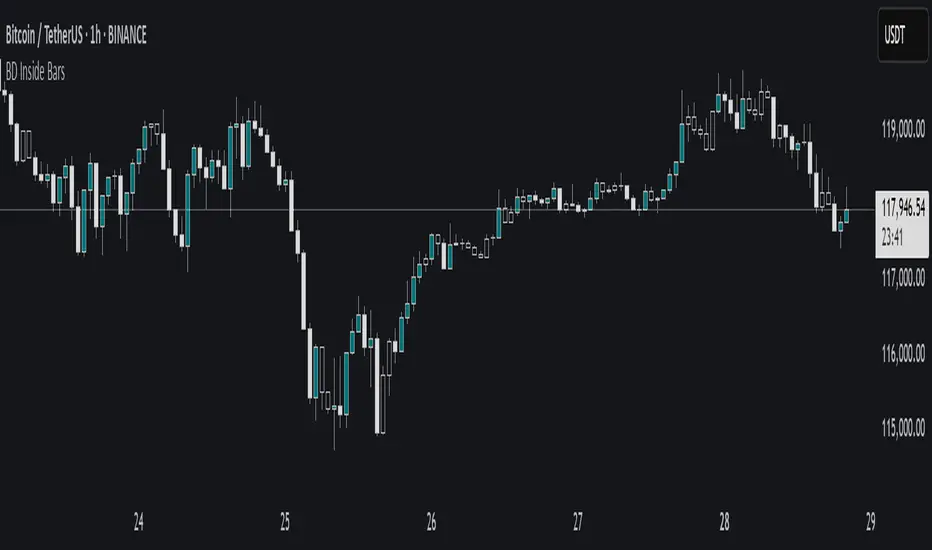
TLP Swing Chart V2thanks
// This source code is subject to the terms of the Mozilla Public License 2.0 at mozilla.org
// Sửa đổi trên code gốc của © meomeo105
// © meomeo105
//@version=5
indicator('TLP Swing Chart V2', shorttitle='TLP Swing V2', overlay=true, max_lines_count=500)
//-----Input-------
customTF = input.timeframe(defval="",title = "Show Other TimeFrame")
showTLP = input.bool(false, 'Show TLP', inline = "TLP1")
colorTLP = input.color(color.aqua, '', inline = "TLP1")
showSTLP = input.bool(true, 'Show TLP Swing', inline = "Swing1")
colorSTLP = input.color(color.aqua, '', inline = "Swing1")
showLabel = input.bool(true, 'Show Label TimeFrame')
lineSTLP = input.string(title="",options= ,defval="(─)", inline = "Swing1")
lineStyleSTLP = lineSTLP == "(┈)" ? line.style_dotted : lineSTLP == "(╌)" ? line.style_dashed : line.style_solid
//IOSB
IOSB = "TLPInOutSideBarSetting"
ISB = input(true,group =IOSB, title="showISB")
colorISB = input.color(color.rgb(250, 171, 0), inline = "ISB")
OSB = input(true,group =IOSB, title="showOSB")
colorOSB = input.color(color.rgb(56, 219, 255), inline = "OSB")
ZoneColor = input(defval = color.new(color.orange, 90),group =IOSB, title = "Background Color")
BorderColor = input(defval = color.new(color.orange, 100),group =IOSB, title = "Border Color")
/////////////////
var aCZ = array.new_float(0)
float highest = high
float lowest = low
if (array.size(aCZ) > 0)
highest := array.get(aCZ, 0)
lowest := array.get(aCZ, 1)
insideBarCondtion = low >= lowest and low <= highest and high >= lowest and high <= highest
if ( insideBarCondtion == true )
array.push(aCZ, high )
array.push(aCZ, low )
if( array.size(aCZ) >= 2 and insideBarCondtion == false )
float maxCZ = array.max(aCZ)
float minCZ = array.min(aCZ)
box.new(bar_index - (array.size(aCZ) / 2) - 1, maxCZ, bar_index - 1, minCZ, bgcolor = ZoneColor, border_color = BorderColor)
array.clear(aCZ)
//////////////////////////Global//////////////////////////
var arrayLineTemp = array.new_line()
// Funtion
f_resInMinutes() =>
_resInMinutes = timeframe.multiplier * (
timeframe.isseconds ? 1. / 60. :
timeframe.isminutes ? 1. :
timeframe.isdaily ? 1440. :
timeframe.isweekly ? 10080. :
timeframe.ismonthly ? 43800. : na)
// Converts a resolution expressed in minutes into a string usable by "security()"
f_resFromMinutes(_minutes) =>
_minutes < 1 ? str.tostring(math.round(_minutes*60)) + "S" :
_minutes < 60 ? str.tostring(math.round(_minutes)) + "m" :
_minutes < 1440 ? str.tostring(math.round(_minutes/60)) + "H" :
_minutes < 10080 ? str.tostring(math.round(math.min(_minutes / 1440, 7))) + "D" :
_minutes < 43800 ? str.tostring(math.round(math.min(_minutes / 10080, 4))) + "W" :
str.tostring(math.round(math.min(_minutes / 43800, 12))) + "M"
f_tfRes(_res,_exp) =>
request.security(syminfo.tickerid,_res,_exp,lookahead=barmerge.lookahead_on)
var label labelError = label.new(bar_index, high, text = "", color = #00000000, textcolor = color.white,textalign = text.align_left)
sendError(_mmessage) =>
label.set_xy(labelError, bar_index + 3, close )
label.set_text(labelError, _mmessage)
var arrayLineChoCh = array.new_line()
var label labelTF = label.new(time, close, text = "",color = color.new(showSTLP ? colorSTLP : colorTLP,95), textcolor = showSTLP ? colorSTLP : colorTLP,xloc = xloc.bar_time, textalign = text.align_left)
//////////////////////////TLP//////////////////////////
var arrayXTLP = array.new_int(5,time)
var arrayYTLP = array.new_float(5,close)
var arrayLineTLP = array.new_line()
int drawLineTLP = 0
_high = high
_low = low
_close = close
_open = open
if(customTF != timeframe.period)
_high := f_tfRes(customTF,high)
_low := f_tfRes(customTF,low)
_close := f_tfRes(customTF,close)
_open := f_tfRes(customTF,open)
highPrev = _high
lowPrev = _low
// drawLineTLP => 2:Tiếp tục 1:Đảo chiều; // Outsidebar 2:Tiếp tục 3:Tiếp tục và Đảo chiều 4 : Đảo chiều 2 lần
drawLineTLP := 0
if(_high > highPrev and _low > lowPrev )
if(array.get(arrayYTLP,0) > array.get(arrayYTLP,1))
if(_high <= high)
array.set(arrayXTLP, 0, time)
array.set(arrayYTLP, 0, _high )
drawLineTLP := 2
else
array.unshift(arrayXTLP,time)
array.unshift(arrayYTLP,_high )
drawLineTLP := 1
else if(_high < highPrev and _low < lowPrev )
if(array.get(arrayYTLP,0) > array.get(arrayYTLP,1))
array.unshift(arrayXTLP,time)
array.unshift(arrayYTLP,_low )
drawLineTLP := 1
else
if(_low >= low)
array.set(arrayXTLP, 0, time)
array.set(arrayYTLP, 0, _low )
drawLineTLP := 2
else if(_high >= highPrev and _low < lowPrev or _high > highPrev and _low <= lowPrev )
if(array.get(arrayYTLP,0) > array.get(arrayYTLP,1))
if(_high >= array.get(arrayYTLP,0) and array.get(arrayYTLP,1) < _low )
if(_high <= high)
array.set(arrayXTLP, 0, time)
array.set(arrayYTLP, 0, _high )
drawLineTLP := 2
else if(_high >= array.get(arrayYTLP,0) and array.get(arrayYTLP,1) > _low )
if(_close < _open)
if(_high <= high)
array.set(arrayXTLP, 0, time)
array.set(arrayYTLP, 0, _high )
array.unshift(arrayXTLP,time)
array.unshift(arrayYTLP,_low )
drawLineTLP := 3
else
array.unshift(arrayXTLP,time)
array.unshift(arrayYTLP,_low )
array.unshift(arrayXTLP,time)
array.unshift(arrayYTLP,_high )
drawLineTLP := 4
else if(array.get(arrayYTLP,0) < array.get(arrayYTLP,1))
if(_low <= array.get(arrayYTLP,0) and _high < array.get(arrayYTLP,1))
if(_low >= low)
array.set(arrayXTLP, 0, time)
array.set(arrayYTLP, 0, _low )
drawLineTLP := 2
else if(_low <= array.get(arrayYTLP,0) and _high > array.get(arrayYTLP,1))
if(_close > _open)
if(_low >= low)
array.set(arrayXTLP, 0, time)
array.set(arrayYTLP, 0, _low )
array.unshift(arrayXTLP,time)
array.unshift(arrayYTLP,_high )
drawLineTLP := 3
else
array.unshift(arrayXTLP,time)
array.unshift(arrayYTLP,_high )
array.unshift(arrayXTLP,time)
array.unshift(arrayYTLP,_low )
drawLineTLP := 4
else if((_high <= highPrev and _low >= lowPrev ))
highPrev := highPrev
lowPrev := lowPrev
if(f_resInMinutes() < f_tfRes(customTF,f_resInMinutes()) and drawLineTLP == 0)
if(array.get(arrayYTLP,0) > array.get(arrayYTLP,1))
if(array.get(arrayYTLP,0) <= high)
array.set(arrayXTLP, 0, time)
drawLineTLP := 2
else
if(array.get(arrayYTLP,0) >= low)
array.set(arrayXTLP, 0, time)
drawLineTLP := 2
if((showSTLP or showTLP) and f_resInMinutes() <= f_tfRes(customTF,f_resInMinutes()))
if(drawLineTLP == 2)
if(array.size(arrayLineTLP) >0)
line.set_xy2(array.get(arrayLineTLP,0),array.get(arrayXTLP,0),array.get(arrayYTLP,0))
else
array.unshift(arrayLineTLP,line.new(array.get(arrayXTLP,1),array.get(arrayYTLP,1),array.get(arrayXTLP,0),array.get(arrayYTLP,0), color = colorTLP,xloc = xloc.bar_time, style = lineStyleSTLP))
else if(drawLineTLP == 1)
array.unshift(arrayLineTLP,line.new(array.get(arrayXTLP,1),array.get(arrayYTLP,1),array.get(arrayXTLP,0),array.get(arrayYTLP,0), color = colorTLP,xloc = xloc.bar_time, style = lineStyleSTLP))
else if(drawLineTLP == 3)
if(array.size(arrayLineTLP) >0)
line.set_xy2(array.get(arrayLineTLP,0),array.get(arrayXTLP,1),array.get(arrayYTLP,1))
else
array.unshift(arrayLineTLP,line.new(array.get(arrayXTLP,2),array.get(arrayYTLP,2),array.get(arrayXTLP,1),array.get(arrayYTLP,1), color = colorTLP,xloc = xloc.bar_time, style = lineStyleSTLP))
array.unshift(arrayLineTLP,line.new(array.get(arrayXTLP,1),array.get(arrayYTLP,1),array.get(arrayXTLP,0),array.get(arrayYTLP,0), color = colorTLP,xloc = xloc.bar_time, style = lineStyleSTLP))
else if(drawLineTLP == 4)
array.unshift(arrayLineTLP,line.new(array.get(arrayXTLP,2),array.get(arrayYTLP,2),array.get(arrayXTLP,1),array.get(arrayYTLP,1), color = colorTLP,xloc = xloc.bar_time, style = lineStyleSTLP))
array.unshift(arrayLineTLP,line.new(array.get(arrayXTLP,1),array.get(arrayYTLP,1),array.get(arrayXTLP,0),array.get(arrayYTLP,0), color = colorTLP,xloc = xloc.bar_time, style = lineStyleSTLP))
//////////////////////////Swing TLP//////////////////////////
var arrayXSTLP = array.new_int(5,time)
var arrayYSTLP = array.new_float(5,close)
var arrayLineSTLP = array.new_line()
int drawLineSTLP = 0
int drawLineSTLP1 = 0
if(showSTLP)
if(math.max(array.get(arrayYSTLP,0),array.get(arrayYSTLP,1)) < math.min(array.get(arrayYTLP,0),array.get(arrayYTLP,1)) or math.min(array.get(arrayYSTLP,0),array.get(arrayYSTLP,1)) > math.max(array.get(arrayYTLP,0),array.get(arrayYTLP,1)))
//Khởi tạo bắt đầu
drawLineSTLP1 := 5
array.set(arrayXSTLP, 0, array.get(arrayXTLP,1))
array.set(arrayYSTLP, 0, array.get(arrayYTLP,1))
array.unshift(arrayXSTLP,array.get(arrayXTLP,0))
array.unshift(arrayYSTLP,array.get(arrayYTLP,0))
// drawLineSTLP kiểm tra điểm 1 => 13:Tiếp tục có sóng hồi // 12|19(reDraw):Tiếp tục không có sóng hồi // 14:Đảo chiều
if(array.get(arrayXTLP,0) == array.get(arrayXTLP,1))
if(array.get(arrayXSTLP,0) >= array.get(arrayXTLP,2) and array.get(arrayYSTLP,0) != array.get(arrayYTLP,1) and ((array.get(arrayYTLP,1) > array.get(arrayYTLP,2) and array.get(arrayYSTLP,0) > array.get(arrayYSTLP,1)) or (array.get(arrayYTLP,1) < array.get(arrayYTLP,2) and array.get(arrayYSTLP,0) < array.get(arrayYSTLP,1))))
drawLineSTLP1 := 12
array.set(arrayXSTLP, 0, array.get(arrayXTLP,1))
array.set(arrayYSTLP, 0, array.get(arrayYTLP,1))
else if(array.get(arrayXSTLP,0) <= array.get(arrayXTLP,2))
if((array.get(arrayYSTLP,0) > array.get(arrayYSTLP,1) and array.get(arrayYTLP,1) < array.get(arrayYSTLP,1)) or (array.get(arrayYSTLP,0) < array.get(arrayYSTLP,1) and array.get(arrayYTLP,1) > array.get(arrayYSTLP,1)))
drawLineSTLP1 := 14
array.unshift(arrayXSTLP,array.get(arrayXTLP,1))
array.unshift(arrayYSTLP,array.get(arrayYTLP,1))
else if((array.get(arrayYSTLP,0) > array.get(arrayYSTLP,1) and array.get(arrayYTLP,1) > array.get(arrayYSTLP,0)) or (array.get(arrayYSTLP,0) < array.get(arrayYSTLP,1) and array.get(arrayYTLP,1) < array.get(arrayYSTLP,0)))
drawLineSTLP1 := 13
_max = math.min(array.get(arrayYSTLP,0),array.get(arrayYSTLP,1))
_min = math.max(array.get(arrayYSTLP,0),array.get(arrayYSTLP,1))
_max_idx = 0
_min_idx = 0
for i = 2 to array.size(arrayXTLP)
if(array.get(arrayXSTLP,0) >= array.get(arrayXTLP,i))
break
if(_min > array.get(arrayYTLP,i))
_min := array.get(arrayYTLP,i)
_min_idx := array.get(arrayXTLP,i)
if(_max < array.get(arrayYTLP,i))
_max := array.get(arrayYTLP,i)
_max_idx := array.get(arrayXTLP,i)
if(array.get(arrayYSTLP,0) > array.get(arrayYSTLP,1))
array.unshift(arrayXSTLP,_min_idx)
array.unshift(arrayYSTLP,_min)
else if(array.get(arrayYSTLP,0) < array.get(arrayYSTLP,1))
array.unshift(arrayXSTLP,_max_idx)
array.unshift(arrayYSTLP,_max)
array.unshift(arrayXSTLP,array.get(arrayXTLP,1))
array.unshift(arrayYSTLP,array.get(arrayYTLP,1))
if(f_resInMinutes() < f_tfRes(customTF,f_resInMinutes()))
if(array.get(arrayYSTLP,0) == array.get(arrayYTLP,1) and array.get(arrayXSTLP,0) != array.get(arrayXTLP,1))
array.set(arrayXSTLP, 0, array.get(arrayXTLP,1))
drawLineSTLP1 := 19
if(f_resInMinutes() <= f_tfRes(customTF,f_resInMinutes()))
if(drawLineSTLP1 == 12 or drawLineSTLP1 == 19)
if(array.size(arrayLineSTLP) >0)
line.set_xy2(array.get(arrayLineSTLP,0),array.get(arrayXSTLP,0),array.get(arrayYSTLP,0))
else
array.unshift(arrayLineSTLP,line.new(array.get(arrayXSTLP,1),array.get(arrayYSTLP,1),array.get(arrayXSTLP,0),array.get(arrayYSTLP,0), color = colorSTLP,xloc = xloc.bar_time))
else if(drawLineSTLP1 == 14)
array.unshift(arrayLineSTLP,line.new(array.get(arrayXSTLP,1),array.get(arrayYSTLP,1),array.get(arrayXSTLP,0),array.get(arrayYSTLP,0), color = colorSTLP,xloc = xloc.bar_time))
else if(drawLineSTLP1 == 13)
array.unshift(arrayLineSTLP,line.new(array.get(arrayXSTLP,2),array.get(arrayYSTLP,2),array.get(arrayXSTLP,1),array.get(arrayYSTLP,1), color = colorSTLP,xloc = xloc.bar_time))
array.unshift(arrayLineSTLP,line.new(array.get(arrayXSTLP,1),array.get(arrayYSTLP,1),array.get(arrayXSTLP,0),array.get(arrayYSTLP,0), color = colorSTLP,xloc = xloc.bar_time))
else if(drawLineSTLP1 == 15)
if(array.size(arrayLineSTLP) >0)
line.set_xy2(array.get(arrayLineSTLP,0),array.get(arrayXSTLP,1),array.get(arrayYSTLP,1))
else
array.unshift(arrayLineSTLP,line.new(array.get(arrayXSTLP,2),array.get(arrayYSTLP,2),array.get(arrayXSTLP,1),array.get(arrayYSTLP,1), color = colorSTLP,xloc = xloc.bar_time))
array.unshift(arrayLineSTLP,line.new(array.get(arrayXSTLP,1),array.get(arrayYSTLP,1),array.get(arrayXSTLP,0),array.get(arrayYSTLP,0), color = colorSTLP,xloc = xloc.bar_time))
// drawLineSTLP kiểm tra điểm 0 => 3:Tiếp tục có sóng hồi // 2|9(reDraw):Tiếp tục không có sóng hồi // 4:Đảo chiều
if(array.get(arrayXSTLP,0) >= array.get(arrayXTLP,1) and array.get(arrayYSTLP,0) != array.get(arrayYTLP,0) and ((array.get(arrayYTLP,0) > array.get(arrayYTLP,1) and array.get(arrayYSTLP,0) > array.get(arrayYSTLP,1)) or (array.get(arrayYTLP,0) < array.get(arrayYTLP,1) and array.get(arrayYSTLP,0) < array.get(arrayYSTLP,1))))
drawLineSTLP := 2
array.set(arrayXSTLP, 0, array.get(arrayXTLP,0))
array.set(arrayYSTLP, 0, array.get(arrayYTLP,0))
else if(array.get(arrayXSTLP,0) <= array.get(arrayXTLP,1))
if((array.get(arrayYSTLP,0) > array.get(arrayYSTLP,1) and array.get(arrayYTLP,0) < array.get(arrayYSTLP,1)) or (array.get(arrayYSTLP,0) < array.get(arrayYSTLP,1) and array.get(arrayYTLP,0) > array.get(arrayYSTLP,1)))
drawLineSTLP := 4
array.unshift(arrayXSTLP,array.get(arrayXTLP,0))
array.unshift(arrayYSTLP,array.get(arrayYTLP,0))
else if((array.get(arrayYSTLP,0) > array.get(arrayYSTLP,1) and array.get(arrayYTLP,0) > array.get(arrayYSTLP,0)) or (array.get(arrayYSTLP,0) < array.get(arrayYSTLP,1) and array.get(arrayYTLP,0) < array.get(arrayYSTLP,0)))
drawLineSTLP := 3
_max = math.min(array.get(arrayYSTLP,0),array.get(arrayYSTLP,1))
_min = math.max(array.get(arrayYSTLP,0),array.get(arrayYSTLP,1))
_max_idx = 0
_min_idx = 0
for i = 1 to array.size(arrayXTLP)
if(array.get(arrayXSTLP,0) >= array.get(arrayXTLP,i))
break
if(_min > array.get(arrayYTLP,i))
_min := array.get(arrayYTLP,i)
_min_idx := array.get(arrayXTLP,i)
if(_max < array.get(arrayYTLP,i))
_max := array.get(arrayYTLP,i)
_max_idx := array.get(arrayXTLP,i)
if(array.get(arrayYSTLP,0) > array.get(arrayYSTLP,1))
array.unshift(arrayXSTLP,_min_idx)
array.unshift(arrayYSTLP,_min)
else if(array.get(arrayYSTLP,0) < array.get(arrayYSTLP,1))
array.unshift(arrayXSTLP,_max_idx)
array.unshift(arrayYSTLP,_max)
array.unshift(arrayXSTLP,array.get(arrayXTLP,0))
array.unshift(arrayYSTLP,array.get(arrayYTLP,0))
if(f_resInMinutes() < f_tfRes(customTF,f_resInMinutes()))
if(array.get(arrayYSTLP,0) == array.get(arrayYTLP,0) and array.get(arrayXSTLP,0) != array.get(arrayXTLP,0))
array.set(arrayXSTLP, 0, array.get(arrayXTLP,0))
drawLineSTLP := 9
if(f_resInMinutes() <= f_tfRes(customTF,f_resInMinutes()))
if(drawLineSTLP == 2 or drawLineSTLP == 9)
if(array.size(arrayLineSTLP) >0)
line.set_xy2(array.get(arrayLineSTLP,0),array.get(arrayXSTLP,0),array.get(arrayYSTLP,0))
else
array.unshift(arrayLineSTLP,line.new(array.get(arrayXSTLP,1),array.get(arrayYSTLP,1),array.get(arrayXSTLP,0),array.get(arrayYSTLP,0), color = colorSTLP,xloc = xloc.bar_time))
else if(drawLineSTLP == 4)
array.unshift(arrayLineSTLP,line.new(array.get(arrayXSTLP,1),array.get(arrayYSTLP,1),array.get(arrayXSTLP,0),array.get(arrayYSTLP,0), color = colorSTLP,xloc = xloc.bar_time))
else if(drawLineSTLP == 3)
array.unshift(arrayLineSTLP,line.new(array.get(arrayXSTLP,2),array.get(arrayYSTLP,2),array.get(arrayXSTLP,1),array.get(arrayYSTLP,1), color = colorSTLP,xloc = xloc.bar_time))
array.unshift(arrayLineSTLP,line.new(array.get(arrayXSTLP,1),array.get(arrayYSTLP,1),array.get(arrayXSTLP,0),array.get(arrayYSTLP,0), color = colorSTLP,xloc = xloc.bar_time))
else if(drawLineSTLP == 5)
if(array.size(arrayLineSTLP) >0)
line.set_xy2(array.get(arrayLineSTLP,0),array.get(arrayXSTLP,1),array.get(arrayYSTLP,1))
else
array.unshift(arrayLineSTLP,line.new(array.get(arrayXSTLP,2),array.get(arrayYSTLP,2),array.get(arrayXSTLP,1),array.get(arrayYSTLP,1), color = colorSTLP,xloc = xloc.bar_time))
array.unshift(arrayLineSTLP,line.new(array.get(arrayXSTLP,1),array.get(arrayYSTLP,1),array.get(arrayXSTLP,0),array.get(arrayYSTLP,0), color = colorSTLP,xloc = xloc.bar_time))
///////////////////////Other//////////////////////////////////
if(f_resInMinutes() <= f_tfRes(customTF,f_resInMinutes()))
if(showSTLP)
if(showLabel and (barstate.islast or barstate.islastconfirmedhistory))
texLabel = f_resInMinutes() == f_tfRes(customTF,f_resInMinutes()) ? f_resFromMinutes(f_resInMinutes()) : f_resFromMinutes(f_tfRes(customTF,f_resInMinutes()))
label.set_xy(labelTF,array.get(arrayXSTLP,0),array.get(arrayYSTLP,0))
label.set_text(labelTF,texLabel)
label.set_style(labelTF,array.get(arrayYSTLP,0) < array.get(arrayYSTLP,1) ? label.style_label_upper_right : label.style_label_lower_right)
if(not showTLP)
arrayLineTemp := array.copy(arrayLineTLP)
for itemArray in arrayLineTemp
if(line.get_x1(itemArray) < array.get(arrayXSTLP,0))
line.delete(itemArray)
array.remove(arrayLineTLP,array.indexof(arrayLineTLP, itemArray))
//Inside Bars - Outside Bars
insideBar() => ISB and high <= high and low >= low ? 1 : 0
outsideBar() => OSB and (high > high and low < low ) ? 1 : 0
//Inside and Outside Bars
barcolor(insideBar() ? color.new(colorISB,0) : na )
barcolor(outsideBar() ? color.new(colorOSB,0) : na )

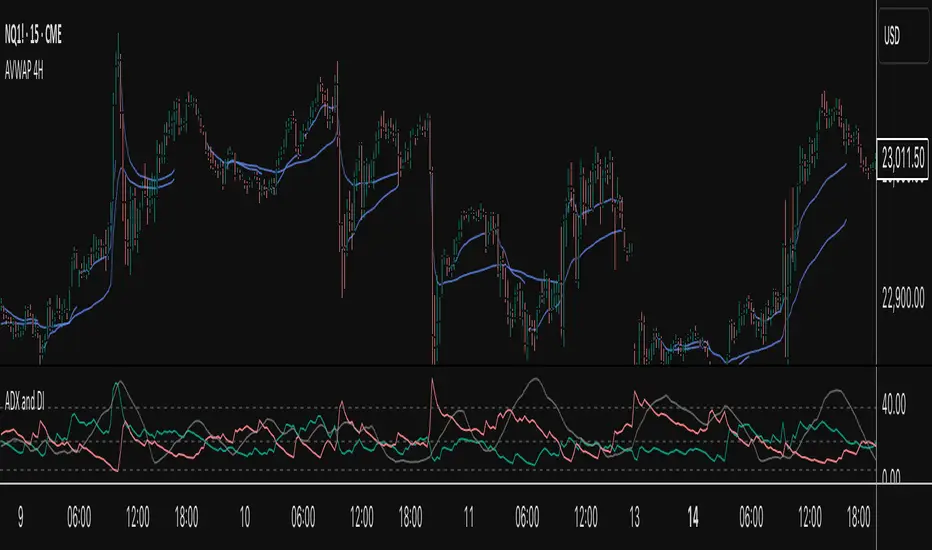
AVWAP 4HThe AVWAP 4H indicator is a multi-session Anchored Volume-Weighted Average Price (AVWAP) tool designed for intraday precision and institutional-grade insight. It plots session-specific AVWAP lines based on a series of key UTC-based time anchors, allowing traders to monitor value zones and dynamic support/resistance across global trading hours.
This script calculates and displays AVWAP lines anchored from five distinct UTC times:
8:00 PM (ETH Open)
10:00 PM
2:00 AM
6:00 AM
10:00 AM
Each line is calculated using ohlc4 as the price source and resets at its respective session start time. Traders can enable or disable any AVWAP anchor individually, as well as customize line color and width for better visual distinction.
The indicator is ideal for identifying volume-weighted equilibrium levels across overlapping global market sessions, particularly useful for short-term mean-reversion, breakout, and institutional order flow strategies.
Volume Surge Detector[SpeculationLab]Volume Surge Detector
This tool is especially useful for spotting early signs of breakouts, news-driven spikes, or institutional activity that are often preceded by abnormal surges in volume.
For better chart readability, the volume bar colors are based on TradingView’s original Volume indicator, while all other code is fully original by Speculation Lab.
You can customize both the SMA line and the volume bar colors to fit your style.
The logic compares the current volume against its SMA (default length: 14, fully adjustable).
The script comes with two surge levels:
Surge Level 1 (default = 5) → When volume is more than 5× the SMA, the bar turns aqua.
Surge Level 2 (default = 10) → When volume is more than 10× the SMA, the bar turns yellow.
It also includes built-in alerts, so you’ll be notified instantly whenever a surge is detected.
This makes it easier to spot potential breakout moves or large market participation in real time.
Disclaimer: This script is for educational purposes only. It does not provide financial advice.
这是一个用于探测 成交量爆发 的指标。
为了图表美观,成交量柱的颜色借鉴了 TradingView 原始 Volume 指标,其余代码均为 Speculation Lab 原创。
用户可以自由调整成交量柱和其对应的 SMA 均线的颜色。
指标通过对比成交量和其 SMA(默认长度为14,可自定义长度和颜色)的比例来检测放量。
默认设置了两个放量级别:
Surge Level 1(默认=5):当成交量超过均量的 5 倍时,量柱变为水蓝色。
Surge Level 2(默认=10):当成交量超过均量的 10 倍时,量柱变为黄色。
脚本还设置了 内置警报功能,方便交易者在出现放量时实时收到通知。

PHL Sweep Signals(1 Hour)PHL Sweep Signals (Full History)
This indicator is designed to identify high-probability reversal setups by detecting liquidity sweeps of the previous standard hour's high and low (PHL). It provides clear, actionable signals complete with visual aids and a data table to keep you in tune with the higher-timeframe context.
Key Features
Previous Hour Levels: Automatically draws the high and low of the previous standard hour as key reference lines for the current trading hour. The line colors rotate to provide a clear visual separation.
Bearish Sweep Signal: Identifies a specific bearish pattern: a green (bullish) candle that wicks above the previous hour's high but fails to hold, with its body remaining entirely below the line.
Bullish Sweep Signal: Identifies the opposite bullish pattern: a red (bearish) candle that wicks below the previous hour's low but is absorbed, with its body remaining entirely above the line.
Clear Visual Signals: When a signal is confirmed, the indicator provides a multi-faceted alert:
Plots a "Buy" or "Sell" arrow on the chart.
Draws a colored box around the signal candle for easy identification.
Displays a label with the potential Stop Loss size (calculated from the size of the signal candle).
Informative Display Table: Includes a convenient table in the corner showing the Open and Close data for the last 3 hours, helping you stay aware of the broader market context without leaving your chart.
Built-in Alerts: Triggers an alert for every confirmed Buy and Sell signal so you never miss a potential setup.
How to Use
This indicator helps you spot potential exhaustion and reversals at key hourly levels.
A "Sell" signal suggests a failed breakout to the upside, indicating potential weakness and a possible entry for shorts.
A "Buy" signal suggests a failed breakdown to the downside, indicating potential strength and a possible entry for longs.
As with any tool, these signals are most powerful when used as part of a comprehensive trading strategy and combined with your own analysis for confirmation.
Optimal Settings:
Timeframe: 5-Minute
Time Zone: UTC-4 (New York Time)
-ratheeshinv

HTF Candles [theUltimator5]Overlay higher timeframe candles on any lower timeframe chart with real-time updates.
This indicator displays the full structure of each higher timeframe (HTF) candle—including open-close bodies and full wicks—directly on your current chart. Great for multi-timeframe traders who want to align short-term entries with broader market context.
🔹 Features:
View higher timeframe candles (e.g., 1H, 4H, Daily) on intraday charts
Dynamic candle bodies that update in real-time
Accurate wick representation with auto-redrawing
Customizable bullish/bearish colors and transparency
Efficient object management for minimal clutter
🛠️ How to Use:
Add this indicator to a lower timeframe chart (e.g., 1m, 5m, or 15m).
Select a higher timeframe (must be greater than your chart timeframe).
Customize your candle colors and transparency for better visibility.
Watch as each higher timeframe candle evolves live with every bar.
📌 Example: Use a 5-minute chart with a 1-hour HTF overlay to track hourly market structure without switching timeframes.

HTF Sweep Model with CISD Table vmodA mod of NotProfGreens w/ alerts and some stylish options- thanks for your work.

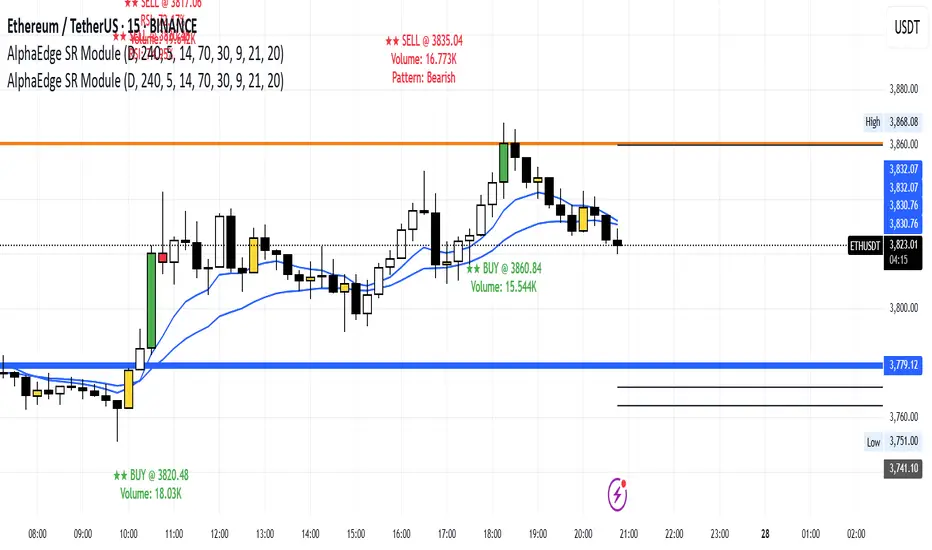
AlphaEdge SR Modulentroducing AlphaEdge SR Module – a powerful tool that combines:
🔹 Clean S/R Zones (Daily & 4H)
🔹 EMA Trend Filters
🔹 RSI OB/OS Highlighting
🔹 Reversal Candle Detection (Engulfing, Pin Bar, Doji)
🔹 Volume Spike Highlighting
🔹 Smart Signal Labels with EMA, RSI, and Volume
Optimized for Gold (XAUUSD), Forex, and Crypto on 1H+ timeframes.
Use it for trend reversals, breakouts, or S/R scalping.
🎯 Public & Free – Search “AlphaEdge SR Module” under Community Scripts.
6FG Plan Checklist & Alerts - Final Version🧠 SCRIPT OVERVIEW: "6FG A+ SETUP - Simplified"
This script is designed to identify high-probability A+ trade setups in alignment with your personal 6FG trading plan, based on:
H1 Break of Structure (required)
4H trend confirmation
15M candle confirmation
Session filter
A+ Label & Visual Table Checklist
✅ KEY COMPONENTS
1. Toggle Inputs
These allow you to customize your view and filters without changing the code:
showSession: Only allow alerts inside Asian or NY sessions
show4hTrend: Include or ignore 4H directional bias
show15mConfirm: Include or ignore confirmation from 15M candles
showTable: Display checklist table on chart
showLabel: Display the “✅ A+” label on qualifying bars
2. Session Filter
Defines valid timeframes for trading (Asian or New York)
Helps avoid setups during low-liquidity hours
Controlled by showSession
3. 4H Trend (Confirmation Only)
Uses a 20-period SMA on 4H to detect general bias:
Bullish = Price above SMA
Bearish = Price below SMA
This trend is not mandatory for an alert if toggle is off
4. H1 Break of Structure (REQUIRED)
Looks at the highest high and lowest low of the last 10 candles on the 1H timeframe
Detects either:
Bullish BOS = Current close > highest high
Bearish BOS = Current close < lowest low
This is the core trigger for the A+ setup
If BOS doesn't happen, no entry is valid
5. 15M Confirmation Candles
(Optional - controlled by show15mConfirm)
Checks for one of three confirmation patterns:
Bullish Engulfing
Bearish Engulfing
Pin Bar
This adds confidence but can be toggled off
6. Entry Conditions (A+ Setup)
All the following must be true for entryOK = true:
✅ H1 BOS (required)
✅ Session is valid (if toggle is on)
✅ 15M confirmation pattern (if toggle is on)
✅ 4H trend (if toggle is on)
7. Visual Output
If entryOK = true:
✅ A green "A+" label appears below price
✅ A checklist table on the top-right shows:
Session status ✔️❌
4H bullish/bearish ✔️❌
H1 BOS ✔️❌
15M confirmation ✔️❌
Final Direction: Bullish / Bearish / —
A+ Setup: ✔️❌
8. Alerts
You will receive a TradingView alert when an A+ Setup is detected:
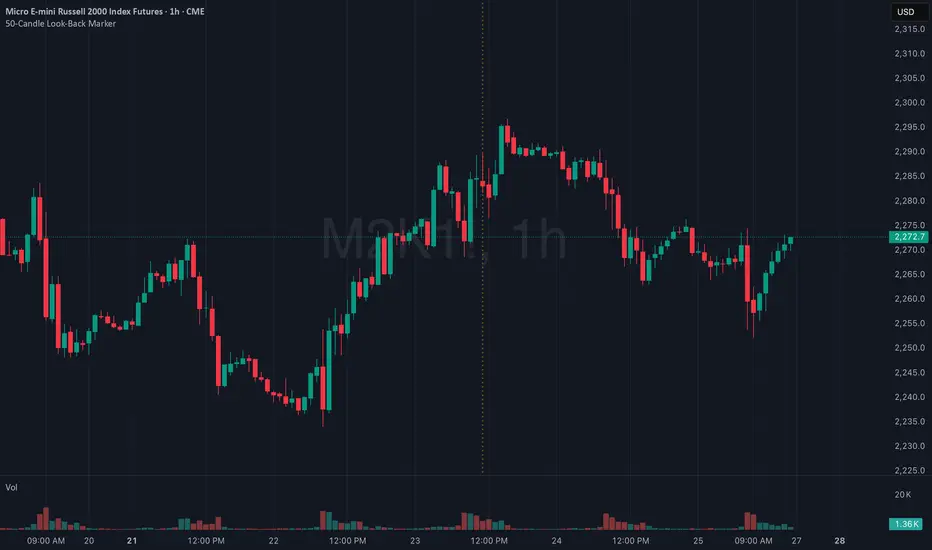
50-Candle Look-Back MarkerIt simply redraws one vertical dotted line that always sits exactly 50 bars behind the current bar, so you can check at a glance that any trend-line you draw has at least 50 candles of data to the right of it.
FVG + IFVG Gap (ULTRA) by Aditya NejeThis Indicator shows Fair Value Gap and Inverse Fair Value gaps

Current Hourly Open Liquidity with Sweep DetectionStatistics indicate that if the current hourly candle reaches the high or low of the previous hourly candle, there is a strong likelihood that the price will return to the current hour's open, depending on how quickly the previous hour's high or low was swept. If the sweep occurs within the first 20 minutes, there is a 75% chance the current hour's open will be reached; if it takes between 21 and 40 minutes, the probability decreases to 50%; and if it takes longer than 41 minutes, the chance drops to 25%.
These statistics can help identify manipulation on the hourly timeframe and guide trade decisions accordingly. For instance, if the previous hourly high is taken within the first 20 minutes but the current hour's open is not reached, it may be wise to avoid long positions until it happens or consider short positions in the direction of the open liquidity, using your existing entry rules and risk management.
The indicator highlights the current hour's open with a line and label to visually represent that liquidity pool, adjusting the line's color based on whether and when the previous hour's high or low was tapped. Once the open is reached, the indicator can, depending on settings, remove the line and label from the chart (this is enabled by default) since the liquidity pool is no longer relevant, preventing chart clutter.
All colors, line widths, label text sizes, and colors can be customized.

Day‑trade Long/Short Signalsday trade Long\Short signals idskator
Displays EMA 5, 8, and 13 to track the trend.
Signals LONG when EMA5 crosses above EMA8 and the MACD line is above the signal line.
Signals SHORT when EMA5 crosses below EMA8 and the MACD line is below the signal line.
