BB Reentry Alert by miewKey Features of This System:
• Automatically detects “BB False Breakout Traps”
• Simple and easy to use – no need to wait for additional Price Action
• Higher win rate when combined with support/resistance levels or Order Blocks
Candlestick analysis

Step 1: Draw Thursday HighScript Description: Thursday High Marker
This is an automated charting tool designed to identify the high of each Thursday and display it as a key reference level for future trading sessions.
Core Functionality:
The script's logic is simple and precise. It waits for the trading session on Thursday to complete. At the very beginning of Friday, it looks back, finds the highest price from Thursday, and draws a clean, white horizontal line at that level.
Key Features:
Automatic: You don't need to do anything. The script finds and draws the level on its own every week.
Forward-Looking: The line extends to the right indefinitely, allowing you to see how future price action interacts with this key level.
Self-Cleaning: To keep your chart uncluttered, the script automatically deletes the previous week's line when it draws the new one.
Lightweight: It performs a single, simple task, so it doesn't slow down your chart.
Purpose in Trading:
Traders use this kind of indicator to track significant weekly price points. The high of a late-week session like Thursday is often considered an important liquidity level. A break above this line can signal bullish strength or a "liquidity sweep," making it a valuable point of interest for making trading decisions on Friday and into the following week.

Agni cpr IndicatorsMulti tf cpr
camarilla
pdh+r1 colour coding
sma ema
tomorrow cpr
Apr 7
Release Notes
some features
Apr 22
Release Notes
Added n some features
Apr 23
Release Notes
line editing

Agni crypto MAGICAL Indicatorsvery useful for crypto and indian market
can use dynamic fib
cpr 360,720 W,M,D
EMA

半神MACD究极指标[Speculation Lab]// 加入我们的 Telegram 群组,与其他交易员一起讨论此脚本的使用方法和策略优化建议( t.me/+iZZx-_OY9YM5MmJl ) (微信群组:toujixiaozhushou)
//Join our Telegram group to discuss the usage of this script and share strategy optimization tips with other traders.( t.me/+iZZx-_OY9YM5MmJl )
//本脚本源自此前的仅限邀请指标,已对部分功能进行简化,以便公开使用。所有代码均为本人原创开发。
//This script is derived from my invite-only indicator, with simplified features for public use. All code is original and developed by @SpeculationLab.
📌 **免责声明**
- 本指标仅供**教育和信息参考**,不构成任何投资建议。
- 本指标不应被视为**买卖任何金融工具的要约、招揽或推荐**。
- 交易涉及**重大风险**,过去的表现**不能保证未来收益**。
- 指标开发者和发布者**不对任何交易损失、财务损害或因使用本指标而产生的任何后果负责**。
- 使用者应自行进行**充分的市场调研和风险评估**,并在做出投资决策前咨询**持牌金融专业人士**。
- **使用本指标即代表您已知晓并接受,所有交易和投资行为由您自行承担责任**。
📌 **Disclaimer:**
- This indicator is provided for **educational and informational purposes only** and should not be considered financial advice.
- It does not constitute **an offer, solicitation, or recommendation** to buy or sell any financial instruments.
- Trading in financial markets involves **significant risk**, and past performance does **not guarantee future results**.
- The developer and publisher **do not assume any responsibility** for trading losses, financial damages, or any consequences resulting from the use of this indicator.
- Users should conduct their own due diligence and consult a **licensed financial professional** before making any investment decisions.
- By using this indicator, you acknowledge and accept that you are solely responsible for your trading and investment activities.
📌 **免責事項**
- 本インジケーターは**教育および情報提供のみを目的としており**、投資アドバイスを提供するものではありません。
- 本インジケーターは**金融商品の売買を推奨または勧誘するものではありません**。
- 取引には**重大なリスク**が伴い、過去のパフォーマンスは**将来の成果を保証するものではありません**。
- 開発者および提供者は、**本インジケーターの使用による取引損失、財務的損害、またはその他の結果について一切の責任を負いません**。
- ユーザーは、**投資判断を行う前に十分な市場調査とリスク評価を行い、必要に応じて** **ライセンスを持つ金融専門家に相談してください**。
- **本インジケーターを使用することにより、すべての取引および投資活動について自己責任であることを理解し、同意したものとみなされます。**

Cumulative Volume Delta with MAfor higher timeframes , i use 9 or 11 ema , and 5 seconds on 1 day. moving average of the cvd not the raw volume . i use it with the impulse macd and find momentum trades or selloffs when moving averages cross .

CVD with Dual MAprefered settings.
Cvd 5 seconds on 1 minute timeframe . this indicator also has moving averages . i prefer the 21 or 30 ema and the 90 or 120 ema for the other. smaller timeframe means you can see more cvd vs using 1 minute on 1 minute . the middle line acts as a definitive decision for a short because if price is also below vwap and is approaching the middle line it is more likely to go down, use the ma crosses to signal some buying momentum rising and they are the ema of the CVD not total raw volume . i use this also on 15 m but with the single cvd moving average . which is separate indicator because of some syntax error idk bro had to make a separate one for higher timeframe.

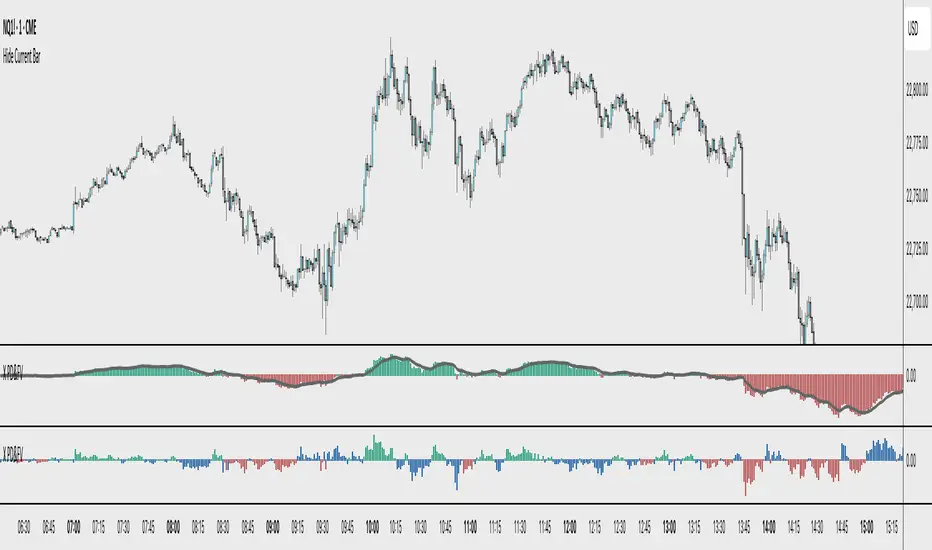
X PD&FVVisualizes the price's premium or discount relative to a moving average benchmark, highlighting mean-reversion and trend-continuation opportunities. While the underlying math is simple, the application is nuanced and can enhance decision-making in both trending and ranging market conditions.
Core Logic:
This tool calculates a custom **spread value**, defined as the distance between the current price and a chosen exponential moving average (EMA). Specifically:
When the current price is **above** the EMA, the spread is calculated as `low - EMA`.
When the price is **below** the EMA, the spread is calculated as `high - EMA`.
This approach creates a dynamic spread that reflects deviation from the EMA, with histogram bars:
Green when the spread is positive (suggesting a price premium),
Red when the spread is negative (suggesting a discount).
A secondary EMA (default 9-period) is applied to the spread itself, plotted as a smoother line over the histogram. This "EMA of spread" line can be interpreted as a moving reference level for detecting directional shifts in momentum.
Interpretation:
Zero Line = Fair Value: The horizontal zero axis represents equilibrium relative to the moving average. Movement toward or away from this line signals potential shifts in market bias.
Trend Following Use: In trending markets, traders can:
Buy when the spread dips below its EMA (discount within uptrend),
Sell when the spread rises above its EMA (premium within downtrend).
Mean Reversion Use: A return to the zero line (fair value) often acts as an **inflection point**, which traders can monitor for either:
Trend continuation (bounce away from zero), or
Reversal (cross through zero).
Customization:
EMA length (default 50) is adjustable to fit different timeframes or asset volatility.
Opening Candle Indicator V3
Details of this release:
1. Add an alert with two conditions:
- Price breaks the highest candlestick opening and closing above it.
- Price breaks the VWAP indicator value.
2. Integrate the VWAP indicator and the 200 EMA with the main indicator.
3. Display buy and sell signals based on specific conditions related to the VWAP breakout.
4. Increase target lines to five.
5. Most importantly, I added custom windows in the settings to apply the indicator to other markets based on adding the opening and closing times for any market with a daily opening and closing time.
Important note: The second buy signal, which comes after a sell signal appears, is based on two conditions: a close above the high of the previous sell signal and a close above VWAP
Warning - Buy or sell signals are only warning signals and the user is responsible for evaluating and studying this signal.
تفاصيل هذا الإصدار:
1-أضفت تنبيه يحتوي على شرطين
-إختراق السعر الأعلى لشمعة الإفتتاح والإغلاق فوقها.
-إختراق السعر لقيمة مؤشر vwap.
2-دمج مؤشر vwap والمتوسط الأسي 200 مع المؤشرالرئيسي
3- إظهار إشارات الشراء والبيع بشروط معينة مرتبطة بإختراق vwap
4-زيادة خطوط الأهداف إلى خمس.
5- وهي الأهم أضفت نوافذ مخصصة في الاعدادت لتطبيق المؤشر على الأسواق الأخرى بناء على إضافة وقت الإفتتاح والإغلاق لأي سوق له وقت إفتتاح ووقت إغلاق يومي.
ملاحظة مهمة:إشارة الشراء الثانية والتي تأتي بعد ظهور إشارة بيع وضعت بناء على شرطين وهما الاغلاق فوق الاعلى لإشارة البيع السابقة والاغلاق فوق مؤشر VWAP
تحذير-إشارات الشراء أو البيع ليست إلا إشارات تحذيرية والمستخدم هو المسئول عن تقييم ودراسة هذه الإشارة

Impulsive Candle Bar Coloring✅ Detects impulsive candles
✅ Colors the candle bars (green for bullish, red for bearish).
🔍 What You'll See:
Candles with large body above ATR and above average volume:
🟢 Green candles = bullish impulsive
🔴 Red candles = bearish impulsive

ORB Indicator (NYSE Session)NYSE ORB indicator that flags the opening and time-invalidation point for any potential trade setups.


StratNinjaTableStratNinjaTable – Multi-Timeframe The Strat Candle Pattern Table
This Pine Script indicator provides traders with a dynamic table overlay on the chart that displays The Strat candle patterns across multiple selectable timeframes. The table includes:
The candle pattern according to The Strat method (1, 2UP, 2DOWN, 3) for each chosen timeframe
Direction arrows showing bullish (▲), bearish (▼), or neutral (■) candle direction
Real-time countdown timer showing remaining time until the current candle closes, adapting automatically to daily, weekly, monthly, and longer timeframes
User inputs for selecting which timeframes to display and positioning of the table on the chart
The current ticker symbol and chart timeframe displayed prominently
The script is developed using Pine Script version 6 and is inspired by the work of shayy110, who contributed foundational code for The Strat methodology in TradingView.

9 EMA & 15 EMA Crossover Arrows//@version=5
indicator("9 EMA & 15 EMA Crossover Arrows", overlay=true)
// EMA calculations
ema9 = ta.ema(close, 9)
ema15 = ta.ema(close, 15)
// Detect crossovers (on previous candle)
bullishCross = ta.crossover(ema9 , ema15 )
bearishCross = ta.crossunder(ema9 , ema15 )
// Plot arrows on previous candle
plotshape(bullishCross, title="Bullish Cross", location=location.belowbar, color=color.green, style=shape.arrowup, size=size.small, offset=-1)
plotshape(bearishCross, title="Bearish Cross", location=location.abovebar, color=color.red, style=shape.arrowdown, size=size.small, offset=-1)
// Plot EMAs (optional for visual)
plot(ema9, color=color.green, title="9 EMA")
plot(ema15, color=color.orange, title="15 EMA")

20% Rally consecutive GREEN Candle20% + Rally will be marked automatically
as per strategy find buy sell zone


[T] FVG Candles with Distance PriorityThis script will mark out historical FVG candles that are closest to where price is currently.
It will draw a box around the candle body at high/low and midpoint (CE) and extend the boxes right to current price.
The distance priority setting will mark historical FVGs closest to where price is currently at; for the max defined number of boxes.
The levels do not have an option to be marked as mitigated - as this indicator is intended for HTF charts, where these levels are considered "permanent" support and resistance levels.

terils indicatorsVWAP
Yesterday’s High and Low
Today’s High and Low
EMAs (20, 50, 100, 200)
VWAP
Yesterday’s High and Low
Today’s High and Low
EMAs (20, 50, 100, 200)

VWAP + HL + EMAsVWAP
Yesterday’s High and Low
Today’s High and Low
EMAs (20, 50, 100, 200)
VWAP
Yesterday’s High and Low
Today’s High and Low
EMAs (20, 50, 100, 200)

My script//@version=5
indicator("NQ Fib + True Open Strategy ", overlay=true, max_lines_count=500)
// === Inputs ===
fibLevel1 = input.float(0.79, "79% Fib Level", minval=0, maxval=1, step=0.01)
fibLevel2 = input.float(0.85, "85% Fib Level", minval=0, maxval=1, step=0.01)
trueOpenTime = input.session("0930-1000", "True Open Time (EST)")
useVolumeFilter = input(true, "Use Volume Filter")
minVolumeRatio = input.float(1.5, "Volume Spike Ratio", minval=1, step=0.1)
trendLength = input.int(5, "Trend Leg Length", minval=1)
// === Trend Detection ===
upTrend = ta.highest(high, trendLength) > ta.highest(high, trendLength) and
ta.lowest(low, trendLength) > ta.lowest(low, trendLength)
downTrend = ta.lowest(low, trendLength) < ta.lowest(low, trendLength) and
ta.highest(high, trendLength) < ta.highest(high, trendLength)
// === Fibonacci Levels ===
swingHigh = ta.highest(high, 10)
swingLow = ta.lowest(low, 10)
priceRange = swingHigh - swingLow
fib79 = swingLow + priceRange * fibLevel1
fib85 = swingLow + priceRange * fibLevel2
// === True Open Price ===
isTrueOpenTime = time(timeframe.period, trueOpenTime)
var float trueOpenPrice = na
if isTrueOpenTime
trueOpenPrice := open
// === Volume Filter ===
volumeAvg = ta.sma(volume, 20)
validVolume = not useVolumeFilter or (volume >= volumeAvg * minVolumeRatio)
// === Entry Conditions ===
nearFib79 = math.abs(close - fib79) <= ta.atr(14) * 0.25
nearFib85 = math.abs(close - fib85) <= ta.atr(14) * 0.25
nearOpenPrice = not na(trueOpenPrice) and math.abs(close - trueOpenPrice) <= ta.atr(14) * 0.25
buySignal = upTrend and (nearFib79 or nearFib85) and nearOpenPrice and validVolume
sellSignal = downTrend and (nearFib79 or nearFib85) and nearOpenPrice and validVolume
// === Plots ===
plot(fib79, "79% Fib", color.new(color.blue, 0), linewidth=1)
plot(fib85, "85% Fib", color.new(color.purple, 0), linewidth=1)
plot(trueOpenPrice, "True Open Price", color.new(color.orange, 0), linewidth=2)
plotshape(buySignal, "Buy", shape.triangleup, location.belowbar, color.new(color.green, 0), size=size.small)
plotshape(sellSignal, "Sell", shape.triangledown, location.abovebar, color.new(color.red, 0), size=size.small)

MetaSigmaMetaSigma is a cutting-edge indicator designed for traders who thrive on contrarian strategies. Built on the core principle of mean reversion, MetaSigma identifies statistically significant price extremes and signals potential turning points before the market corrects itself.

Accurate Weekly Liquidity Zones + Daily LinesDraws vertical lines for each day of the week
Monday in a unique color
Other days in gray
Marks Buy-Side Liquidity (BSL) — highest high of the last completed week
Marks Sell-Side Liquidity (SSL) — lowest low of the last completed week
Extends BSL/SSL as horizontal lines into the current week

Sonic R + Regression + Supertrend sonic R , polynomial regession , super trend . i love you , i love you
