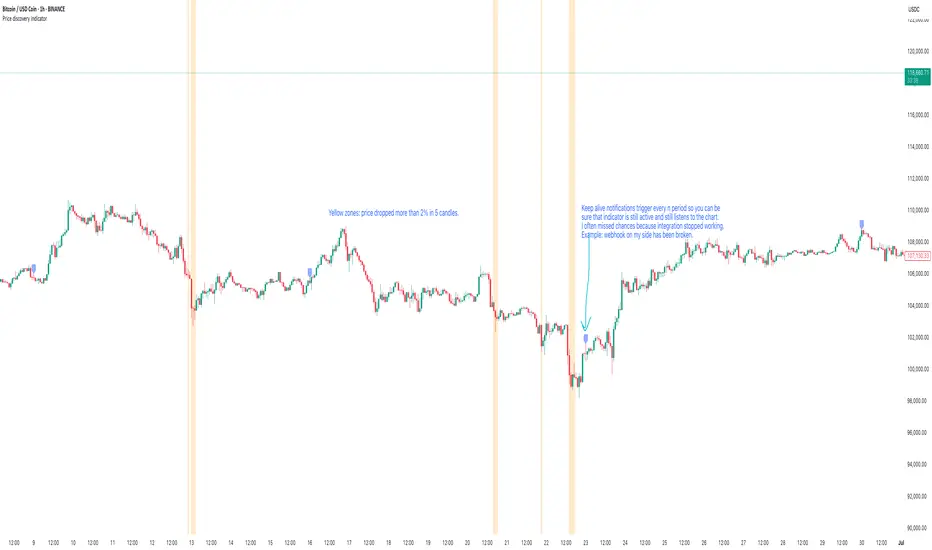
Price discovery indicatorGives an ability to show places where price drops more than n percent in x candles. Use cases: see dips of btc, get a notification when a stablecoin goes crazy, validate that webhook integration works as expected using keep alive messages.
Features included:
- Price dip alerts. Create an alert that sends a notification every time price dips more than expected (yellow zone at the chart).
- Percentage drop threshold. Define how many percents price should drop to trigger an alert and to show a yellow zone.
- Candles length threshold. Define within how many candles this drop should happen. If price drops in 2% within 10 candles, but this option is 5 - the alert will not be triggered because price dropped not as fast as expected.
- Templates of messages on price dip and price recovery. Set your message that should be triggered with alert.
- Keep alive feature. Set to trigger keep alive alerts every period. Can be helpful if you don't check charts often - this feature will trigger alert every period with "hey, the integration is alive" message. I use it to validate on weekly basis that tradingview triggers my alerts (example: you created an alert with expiration date and forgot to recreate it), that webhook integration receives these alerts, that the integration sends these alerts to telegram. Example: I expect to see this message every monday's morning, otherwise something is broken and I have to check what is wrong with my alerting system.
Candlestick analysis
Impulse Alert - Demand (Buy) [Fixed]🔵 Impulse Alert – Demand (Buy)
This indicator is designed to detect high-probability Demand Zones based on impulsive bullish price action, helping traders get alerted only when it matters most.
🧠 Core Logic:
Scans the chart for 2 consecutive bullish impulsive candles with significant range (body size)
Also captures single large bullish impulse candles that often mark institutional buying
Marks the origin of the move as a potential Demand Zone
Sends alerts when such bullish setups form, allowing you to monitor charts passively
⚙️ Features:
✅ Alerts on impulsive move formations
✅ Detects both 2-candle and single-candle impulses
✅ Custom zone detection logic based on pip size and momentum
✅ Cleaner & smarter: removes distractions and avoids false signals
📌 Best Used For:
Smart Money / Supply & Demand traders
Identifying potential institutional buy zones
Executing trades with HTF confluence
Traders who want to get alerted without screen-watching
🔁 Suggested Strategy:
Set HTF directional bias (H1, H4, D1)
Use this indicator on LTF (1M–15M) for impulsive bullish entries
Wait for price to return to the marked zone for low-risk entries
💡 Pro Tip: Combine with your Supply Zone (Sell) indicator to track both sides of market structure and increase R:R
👤 Created by: Rohit Jadhav | YT/Insta/X - @GrowthByTrading
📬 Want updates, enhancements, or personal versions? Leave feedback or reach out through profile!
Impulse Alert - Supply (Sell) [Fixed]🟥 Supply Zone (Sell) – Institutional Order Block Detector
This custom indicator automatically detects valid Supply Zones (Sell Zones) based on Smart Money Concepts and institutional trading behavior.
🔍 How It Works:
Identifies strong bearish impulsive moves after price forms a potential Order Block
Valid supply zones are plotted after:
A valid rally–base–drop or drop–base–drop structure
A shift in structure or clear imbalance is detected
The zone is created from the last bullish candle before a strong bearish engulfing move
Zones remain on chart until price revisits and reacts
📊 Use Case:
Ideal for traders using Smart Money Concepts (SMC), Supply & Demand, or ICT-inspired strategies
Perfect for scalping, day trading, or swing setups
Designed for confluence with HTF bias and LTF execution
⚙️ Features:
Supply Zone auto-plotting
Customizable zone color and opacity
Alerts when price returns to the zone (retest entry opportunity)
🧠 Tip for Best Use:
Use in confluence with:
HTF Supply zones (manual or other indicator)
Market Structure breaks
Fair Value Gaps or Imbalance zones
Strong impulsive moves from HTF to LTF
🔁 Future Additions (Coming Soon):
Demand Zone detection
Zone strength rating system
Refined zone filters (volume, candle size, etc.)
Alerts for mitigation or invalidation
📌 Created by: Rohit Jadhav | Real-time market trader | YT/Insta - @GrowthByTrading
💬 Feedback? Drop a comment or connect via profile for updates and tutorials!

Average Daily Range in TicksPurpose: The ADR Ticks Indicator calculates and displays the average daily price range of a financial instrument, expressed in ticks, over a user-specified number of days. It provides traders with a measure of average daily volatility, which can be used for position sizing, setting stop-loss/take-profit levels, or assessing market activity.
Calculation: Computes the average daily range by taking the difference between the daily high and low prices, averaging this range over a customizable number of days, and converting the result into ticks (using the instrument's minimum tick size).
Customization: Includes a user input to adjust the number of days for the average calculation and a toggle to show/hide the ADR Ticks value in the table.
Risk Management: Helps traders estimate typical daily price movement to set appropriate stop-loss or take-profit levels.
Market Analysis: Offers insight into average daily volatility, useful for day traders or swing traders assessing whether a market is trending or ranging.
Technical Notes:
The indicator uses barstate.islast to update the table only on the last bar, reducing computational load and preventing overlap.
The script handles different chart timeframes by pulling daily data via request.security, making it robust across various instruments and timeframes.

MA20/EMA200 Crossover Alert# MA20/EMA200 Crossover Alert with Telegram Integration
**Description:**
This indicator identifies key trend reversals by detecting when the 20-period Simple Moving Average (MA20) crosses the 200-period Exponential Moving Average (EMA200). These crossovers are widely recognized as significant signals for medium to long-term trend changes.
**Key Features:**
- Real-time detection of MA20/EMA200 crossovers on any timeframe (optimized for 1H)
- Visual signals with up/down triangles at crossover points
- Background color highlights for easy identification
- Built-in alert system with JSON-formatted messages for Telegram webhook integration
- Clean, customizable interface with adjustable MA/EMA periods
**Signals:**
- 🟢 **Bullish Signal**: MA20 crosses above EMA200 (potential uptrend beginning)
- 🔴 **Bearish Signal**: MA20 crosses below EMA200 (potential downtrend beginning)
**Alert Integration:**
The indicator includes pre-formatted alert messages designed for direct integration with Telegram bots via webhooks. Each alert contains:
- Symbol and exchange information
- Current price at crossover
- Signal type (BULLISH/BEARISH)
- Descriptive message
**Best Use Cases:**
- Trend following strategies
- Position entry/exit timing
- Multi-timeframe analysis
- Automated trading system triggers
**Note:** This indicator works best on liquid markets and higher timeframes (1H, 4H, 1D) to reduce false signals. Always combine with other analysis methods for confirmation.
**Tags:** ma, ema, moving average, crossover, trend, telegram, alert, webhook, trading, signal

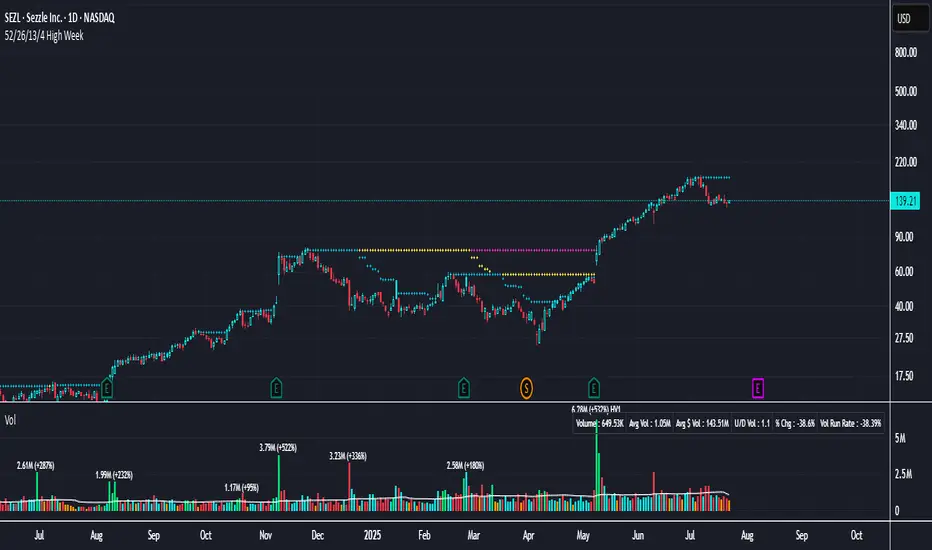
52/26/13/4 High WeekThis is a tool to identify the 52-week high of a candlestick for use in breakout strategies. It can be used in conjunction with Pocket Pivot and EMA or Volume.
It is ideal for studying price behavior and trend following.
CVD Divergence + Volume HMA RSI MACD StrategyHow the script works:
The script calculates the HMA for trend direction. The HMA (shown in orange) is used as a filter: long trades are taken only if price is above the HMA, and short trades when below.
The CVD is computed by cumulatively adding volume on up bars and subtracting volume on down bars.
Pivot routines (with the input "Pivot Length") detect swing lows/highs for both price and CVD. A bullish divergence is flagged when the price makes a lower low while the CVD makes a higher low. Similarly, a bearish divergence is flagged when the price makes a higher high while the CVD makes a lower high.
Trading is triggered when the divergence condition also agrees with the HMA filter.
Feel free to further adjust the parameters or add risk‐management/exit rules as needed for your trading style.

Candele Heikin Ashi Calculate Heikin Ashi Body (HKAB) and SMA Delta and send to the Graph the Heikin Ashi Body value if SMA Delta and HKAB are positive

ATR: Тело % + Диапазоны и АномалииEssentially, this combined indicator is a powerful tool for:
Analyzing candlestick anatomy: Quickly understanding how much of a candlestick’s overall range is in its body, indicating the strength of buying or selling pressure versus uncertainty.
Volatility estimates: Understanding the typical pip range of bars, adjusted for the tick size of the instrument.
Identifying anomalies: Highlighting unusually small or large bar ranges that may signal changes in market momentum or significant events.
Average range filtering: Providing a clearer picture of average market volatility by excluding extreme outliers from the calculation.
This comprehensive approach can help traders make more informed decisions by gaining a deeper understanding of the nuances of price action and market volatility.

庄家入场基础指标//@version=5
indicator("庄家入场基础指标", overlay=true)
length = input.int(20, "低点周期")
volMultiplier = input.float(1.5, "成交量放大倍数")
lowestLow = ta.lowest(low, length)
avgVol = ta.sma(volume, length)
volumeSignal = volume > avgVol * volMultiplier
priceSignal = low <= lowestLow
entrySignal = priceSignal and volumeSignal
plotshape(entrySignal, title="庄家入场", location=location.belowbar, color=color.green, style=shape.labelup, text="庄", size=size.small)

SessionsSession 10-12 12-16 1630-1830
Including HOD/LOD for different sessions.
Session 10:00 - 12: 00
Session 12:00 - 16:00
Session 16:30 - 18:30

EMA200 HUD + ATR + Live WickThis indicator displays:
• EMA200 deviation in USD and %
• ATR (Average True Range) and ATR multiples
• Live wick % (up/down) with alerts if wick > 2%

EMA Buy/SellBuy /Sell using EMA Crossover.
this gives early signal foy both buying and selling and one can use this to take the trades

9:30 AM Candle MarkerEach day at 9:30 AM, on the 15-minute chart, you’ll see a red vertical line appear exactly on that candle. This makes it super easy to:
Track reactions to market open (if using US stocks).
Anchor your strategy to a consistent time point.
Build routines around a known time.

JMR vwap inside barThis indicator will add vwap and according to your chart time frame and also will mark inside bar candles.

Breakout Detector (5-min)//@version=5
indicator("Breakout Detector (5-min)", overlay=true)
// Define breakout range
length = input.int(20, minval=1, title="Lookback Period")
bullColor = color.green
bearColor = color.red
// Calculate highest high and lowest low of lookback period
highestHigh = ta.highest(high, length)
lowestLow = ta.lowest(low, length)
// Detect breakout
bullBreakout = close > highestHigh
bearBreakout = close < lowestLow
// Plot breakout signals
plotshape(bullBreakout, title="Bullish Breakout", location=location.abovebar, color=bullColor, style=shape.triangleup, size=size.small)
plotshape(bearBreakout, title="Bearish Breakout", location=location.belowbar, color=bearColor, style=shape.triangledown, size=size.small)
// Optional: Background color for breakout bars
bgcolor(bullBreakout ? color.new(bullColor, 85) : na)
bgcolor(bearBreakout ? color.new(bearColor, 85) : na)

Live Candle ±10 Points (Last 2 Bars Only)Autocalculates 10 points plus or minus on the previous 2 candles. Simple for quick reference on break even points or TP/SL areas if you're working on a fixed point strategy.

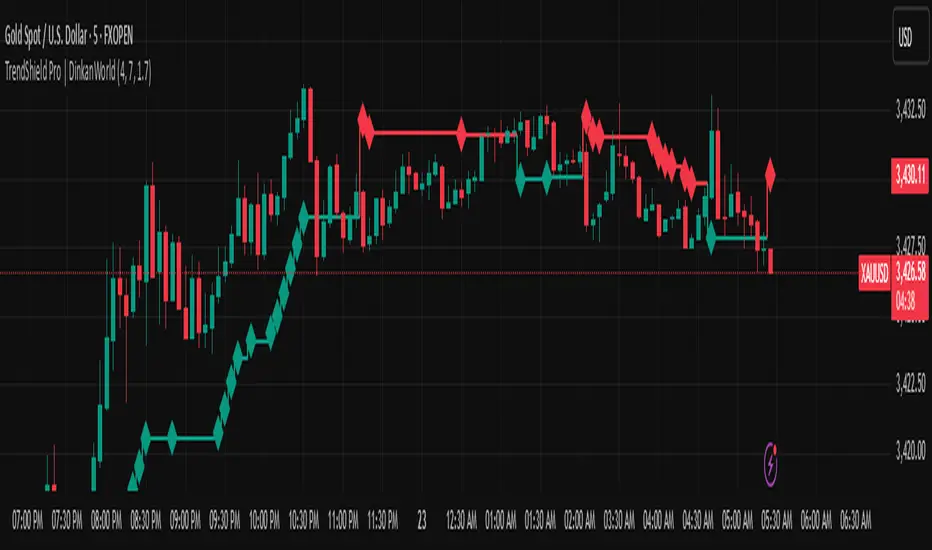
TrendShield Pro | DinkanWorldTrendShield Pro is a powerful price action tool that combines momentum-based trend detection with an ATR-powered trailing stop system. Built using EMA and ATR logic, this indicator helps traders identify real trends, manage dynamic stop-loss levels, and react faster to momentum shifts — all with visual clarity.
🔍 Key Features:
✅ Momentum + Price Action Based Trend Detection
✅ Dynamic ATR Trailing Stop Line
✅ Real-Time Reversal Arrows and Diamond Alerts
✅ Optimized CandleTrack color theme (Green = Demand, Red = Supply)
✅ Fully customizable inputs
🧠 Why Use It?
Capture trends early with momentum-driven logic
Use trailing stops for exit strategy or re-entry zones
Stay on the right side of the market with visual confirmation
⚙️ Inputs:
EMA Period (for directional bias)
ATR Period (for volatility-based trailing stops)
Factor (stop distance control)
⚠️ Disclaimer:
This indicator is for educational and informational purposes only and should not be considered financial advice. Trading involves risk, and past performance does not guarantee future results. Always do your own research and consult with a licensed financial advisor before making any trading decisions. The creator of this script is not responsible for any financial losses incurred through the use of this tool.
CandleTrack Pro | Pure Price Action Trend Detection CandleTrack Pro | Pure Price Action Trend Detection with Smart Candle Coloring
📝 Description:
CandleTrack Pro is a clean, lightweight trend-detection tool that uses only candle structure and ATR-based logic to determine market direction — no indicators, no overlays, just pure price action.
🔍 Features:
✅ Smart Candle-Based Trend Detection
Uses dynamic ATR thresholds to identify trend shifts with precision.
✅ Doji Protection Logic
Automatically filters indecision candles to avoid whipsaws and false signals.
✅ Dynamic Bull/Bear Color Coding
Bullish candles are colored green, bearish candles are colored red — see the trend instantly.
✅ No Noise, No Lag
No moving averages, no smoothing — just real-time decision-making power based on price itself.
📈 Ideal For:
Price action purists
Scalpers and intraday traders
Swing traders looking for clear visual bias
─────────────────────────────────────────────────────────────
Disclaimer:
This indicator is provided for educational and informational purposes only and should not be considered as financial or investment advice. The tool is designed to assist with technical analysis, but it does not guarantee any specific results or outcomes. All trading and investment decisions are made at your own risk. Past performance is not indicative of future results. Always do your own research and consult with a qualified financial advisor before making any trading decisions. The author accepts no liability for any losses or damages resulting from the use of this script. By using this indicator, you acknowledge and accept these terms.
───────────────────────────────────────────────────

NY Liquidity Reversal - Debug Mode70 percent 1 rate strategy, no red folder news, trades from only 730 to noon, 20 EMA plus voluntarily breakout, 1 and one entry per direction per session per asset

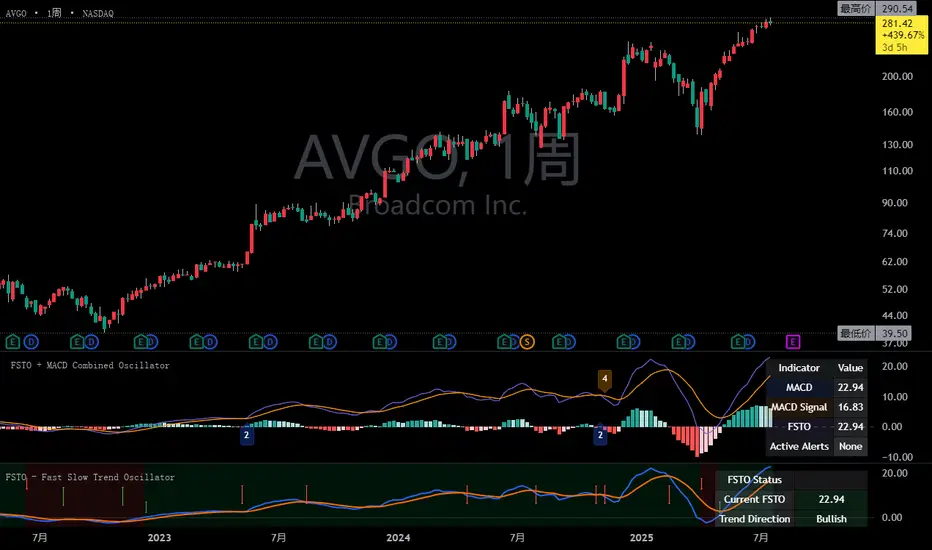
FSTO + MACD Combined OscillatorFSTO + MACD Combined Oscillator with Advanced Alerts
Introduction
The FSTO + MACD Combined Oscillator is a powerful technical analysis tool that synergizes two proven momentum indicators to deliver high-confidence trading signals. By combining the Moving Average Convergence Divergence (MACD) with the Fast Slow Trend Oscillator (FSTO), this indicator provides unique insights into market momentum, trend direction, and potential reversal points.
Key Features
1. Dual Indicator Integration
MACD Component:
Fast EMA (user-configurable period)
Slow EMA (user-configurable period)
Signal line with customizable smoothing
Histogram showing momentum strength
FSTO Component:
Short-term EMA (price-based)
Long-term EMA (price-based)
Signal line with adjustable period
Zero-line crossover detection
2. Advanced Alert System
Four specialized alert conditions that trigger only when both indicators confirm momentum shifts:
Bullish Reversal Alert
FSTO crosses above zero + MACD transitions from falling to rising
Strong trend reversal signal
Bullish Momentum Alert
FSTO crosses above signal line + MACD transitions from falling to rising
Confirmation of bullish momentum
Bearish Reversal Alert
FSTO crosses below zero + MACD transitions from rising to falling
Strong trend reversal signal
Bearish Momentum Alert
FSTO crosses below signal line + MACD transitions from rising to falling
Confirmation of bearish momentum
3. Visual Indicators
Color-coded plots:
MACD line (blue)
MACD signal line (orange)
FSTO line (purple)
FSTO signal line (amber)
Histogram:
Green: Strengthening bullish momentum
Light green: Weakening bullish momentum
Red: Strengthening bearish momentum
Light red: Weakening bearish momentum
Alert markers:
Numbered labels (1-4) at chart extremes
Color-coded for quick identification
4. Information Panel
Real-time display of:
Current MACD and FSTO values
Trend direction (bullish/bearish)
Momentum status (rising/falling)
Active alerts with color coding
How It Works
The indicator calculates two parallel momentum measurements:
MACD = EMA(close, fast_length) - EMA(close, slow_length)
FSTO = EMA(close, short_period) - EMA(close, long_period)
The true power emerges when these indicators confirm each other's signals:
MACD detects momentum shifts in price derivatives
FSTO identifies trend changes in price itself
Combined signals filter out false positives
Trading Applications
1. Trend Identification
Bullish Trend: FSTO > 0 and MACD > signal line
Bearish Trend: FSTO < 0 and MACD < signal line
2. High-Probability Entries
Long Entry: Alert 1 or 2 triggers
Short Entry: Alert 3 or 4 triggers
3. Exit Signals
MACD histogram color change (green to light green)
FSTO crossing signal line against trend direction
4. Risk Management
Stop placement below recent swing low (bullish)
Stop placement above recent swing high (bearish)
Position sizing based on histogram strength
Recommended Settings
Market MACD Fast MACD Slow FSTO Short FSTO Long
Stocks 12 26 12 26
Cryptocurrency 10 20 10 20
Forex 8 17 8 17
Commodities 14 28 14 28
Benefits
Synergistic Signals: Combines price-based and derivative-based momentum
Reduced False Signals: Requires confirmation from both indicators
Customizable Alerts: Enable/disable specific alert types
Visual Clarity: Color-coded elements for quick interpretation
Multi-Timeframe: Works on all timeframes from 1-minute to monthly
How to Use
Add indicator to TradingView chart
Configure periods based on market and timeframe
Enable desired alerts in settings
Set up notifications through TradingView alert system
Combine with price action analysis for best results
The MACD + FSTO Combined Oscillator provides professional traders with a sophisticated yet intuitive tool for identifying high-probability trade setups across all financial markets. Its unique alert system ensures you never miss critical momentum shifts confirmed by dual-indicator analysis.
FSTO - Fast Slow Trend OscillatorFSTO Indicator: Fast Slow Trend Oscillator
Introduction
The FSTO (Fast Slow Trend Oscillator) is a powerful momentum indicator designed to identify trend direction, strength, and potential reversal points in financial markets. Based on the relationship between short-term and long-term exponential moving averages (EMAs), FSTO provides clear visual signals and actionable alerts to help traders make informed decisions.
Key Features
1. Dual-Line Visualization
FSTO Line: The difference between short-term and long-term EMAs
Signal Line: Smoothed version of the FSTO line for confirmation
2. Comprehensive Trend Analysis
Zero Line: Clearly marks the boundary between bullish and bearish territory
Color Zones:
Green area: Positive momentum (bullish)
Red area: Negative momentum (bearish)
3. Intelligent Alert System
Zero Line Cross Alerts: Signals when trend direction changes
Signal Line Cross Alerts: Identifies entry and exit points
Visual Markers: Triangle indicators highlight important cross events
4. Information Panel
Real-time display of:
Current FSTO value
Trend direction (Bullish/Bearish)
Momentum strength (Strengthening/Weakening)
How It Works
FSTO calculates the difference between two EMAs:
复制
FSTO Line = EMA(close, shortPeriod) - EMA(close, longPeriod)
Signal Line = EMA(FSTO, signalPeriod)
The indicator then:
Identifies when FSTO crosses above/below zero (trend change)
Detects when FSTO crosses above/below its signal line (entry/exit signals)
Visualizes momentum strength through color zones
Provides real-time alerts for key events
Recommended Settings
Market Short EMA Long EMA Signal Line
Stocks 12 26 9
Cryptocurrency 8 21 5
Forex 10 30 7
Commodities 14 28 8
Trading Signals
Bullish Trend: FSTO > 0
Bearish Trend: FSTO < 0
Buy Signal: FSTO crosses above signal line
Sell Signal: FSTO crosses below signal line
Strong Buy: Bullish cross below zero line
Strong Sell: Bearish cross above zero line
How to Use
Add the indicator to your TradingView chart
Configure EMA periods based on your trading style
Set up alerts for key events:
Zero line crosses (trend changes)
Signal line crosses (entry/exit points)
Combine with other indicators for confirmation
Use information panel for quick market assessment
Benefits
Clear visualization of trend direction
Early detection of momentum shifts
Customizable parameters for different markets
Actionable alerts for timely trading decisions
Comprehensive information panel for quick analysis
The FSTO indicator is an essential tool for traders seeking to identify trend direction, momentum strength, and potential reversal points across all timeframes and market conditions.

Marwatian TraderHello! I’m Muhammad Nauman Khan, the developer behind this binary‑trading indicator. Below is a detailed description of its purpose, underlying methodology and key features:
1. Overview
This indicator is designed specifically for Fixed‑Time Binary Trading. By analyzing incoming price data in real time, it generates a prediction—“Up” or “Down”—for the very next candle. You can apply it to any timeframe (from 1 min to 30 min), or focus on whichever timeframe yields the highest accuracy for your strategy.
2. Core Prediction Engine
To forecast the next candle’s direction, we combine multiple analytical “tools” into a unified confidence model.
3. Risk Warning
No indicator can guarantee 100 % accuracy. Always combine signals with sound money‑management rules—risk only a small percentage of your capital per trade, and never trade more than you can afford to lose.
