CAPE / Shiller PE RatioThe CAPE (Cyclically Adjusted Price-to-Earnings) or Shiller PE ratio is a popular valuation measure used by investors to assess whether a stock or index is over or undervalued relative to its historical earnings. Unlike the traditional P/E ratio, the CAPE ratio smooths earnings over ten years, adjusting for inflation and providing a more stable and long-term view of valuation.
This indicator lets you quickly calculate and visualize the CAPE ratio for any stock on TradingView, helping you make informed decisions about the sustainability of current price levels. With its clear presentation and intuitive setup, you can compare historical CAPE levels and identify potential opportunities for long-term investments or avoid overvalued markets.
Advantages of the CAPE Ratio:
Long-Term Focus : Smooth earnings over ten years, reducing the impact of short-term volatility.
Inflation-Adjusted : Provides a more precise, inflation-adjusted valuation measure over time.
Historical Comparison : Allows for benchmarking against long-term historical averages.
Market Sentiment Indicator : Can highlight overvalued or undervalued markets for long-term investors.
Reduces Noise : Filters out short-term earnings fluctuations, offering a more stable view.
Disadvantages of the CAPE Ratio:
Ignores Recent Earnings : Misses short-term earnings changes, which can affect current valuations.
Outdated Data : Relies on old earnings data that may not reflect recent company performance.
Less Effective for Growth Stocks : May undervalue high-growth stocks focused on future earnings.
Sector Limitations : Works best for broad markets, less so for fast-changing industries.
Debated Predictive Power : It’s unreliable for timing short-term market movements.
In short, the CAPE ratio is excellent for long-term valuation but has limitations for short-term or growth-focused investing.
Disclaimer
Please remember that past performance may not be indicative of future results.
Due to various factors, including changing market conditions, the strategy may no longer perform as well as in historical backtesting.
This post and the script don’t provide any financial advice.
CAPE

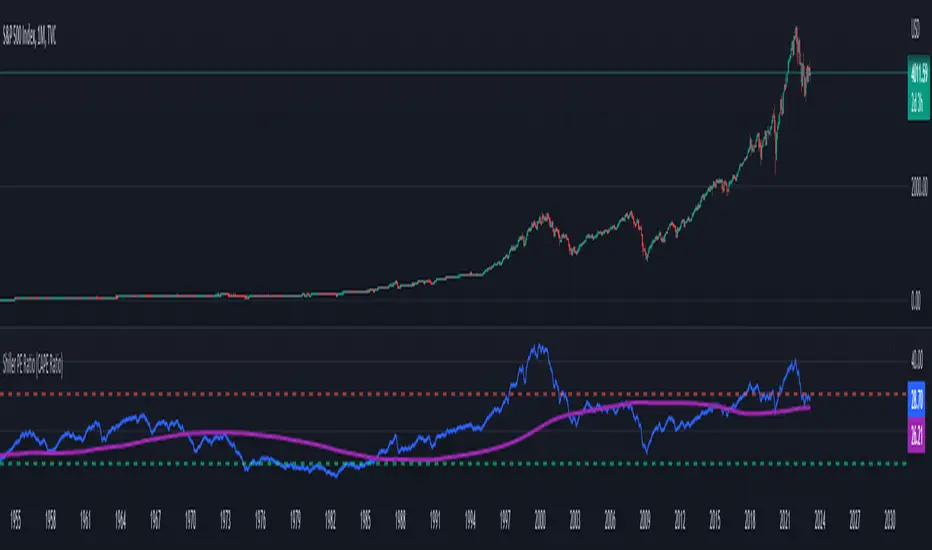
Shiller PE Ratio (CAPE Ratio) [WhaleCrew]Our Implementation of the famous Shiller PE Ratio (aka C yclically A djusted P rice-to- E arnings Ratio) a long-term valuation indicator for the S&P 500.
Calculation: Share price divided by 10 - year average, inflation - adjusted earnings
The indicator works on the M and 12M timeframe and has a built-in moving average that supports an upper and lower bollinger band.
SPX Excess CAPE YieldHere we are looking at the Excess CAPE yield for the SPX500 over the last 100+ years
"A higher CAPE meant a lower subsequent 10-year return, and vice versa. The R-squared was a phenomenally high 0.9 — the CAPE on its own was enough to explain 90% of stocks’ subsequent performance over a decade. The standard deviation was 1.37% — in other words, two-thirds of the time the prediction was within 1.37 percentage points of the eventual outcome: this over a quarter-century that included an equity bubble, a credit bubble, two epic bear markets, and a decade-long bull market."
assets.bwbx.io
In December of 2020 Dr. Robert Shiller the Yale Nobel Laurate suggested that an improvement on CAPE could be made by taking its inverse (the CAPE earnings yield) and subtracting the us10 year treasury yield.
"His model plainly suggests that stocks will do badly over the next 10 years, and that bonds will do even worse. This was the way Shiller put it in a research piece for Barclays Plc in October, (which can be found on SSRN Below):
In summary, investors expect a certain return in equities as compensation for investing in a riskier asset class, and as interest rates have declined, the relative expected return for equities has increased dramatically. We believe this may quantitatively help to explain investors current preference for equities over bonds, and as such the quick recoveries we are observing (with the exception of the UK), whilst still in the midst of a pandemic. In the US in particular, we are once again observing stretched valuations and high CAPE ratios compared to history."
Sources:
papers.ssrn.com
www.bloomberg.com
The standard trading view disclaimer applies to this post -- please consult your own investment advisor before making investment decisions. This post is for observation only and has no warranty etc. www.tradingview.com
Best,
JM
