ZYTX GKDDThe ZYTX High-Sell Low-Buy Indicator Strategy is a trend-following indicator that integrates multiple indicator resonances. It demonstrates the perfect performance of an automated trading robot, truly achieving the high-sell low-buy strategy in trading.
Chart patterns

ZYTX SuperTrend V1ZYTX SuperTrend V1 Indicator
Multi-strategy intelligent rebalancing with >95% win rate
Enables 24/7 automated trading

ZYTX CCI SuperTrendZYTX CCI SuperTrend
The definitive integration of CCI and SuperTrend trend-following indicators, delivering exemplary performance in automated trading bots.

ADX GatekeeperADX Gatekeeper is an original strategy that combines three classic filters to improve trend-following accuracy and avoid choppy markets.
Combines RSI, OBV, and ADX filters to catch stronger trends and avoid sideways markets. RSI confirms momentum extremes, OBV confirms volume flow, and ADX filters low-trend conditions. Fully configurable for different market conditions.
RSI Filter: Avoids overbought/oversold traps by requiring RSI < 35 for longs and > 70 for shorts.
OBV Filter: Confirms directional volume with positive OBV changes for longs and negative for shorts.
ADX Filter: Filters out low-volatility sideways conditions by requiring ADX above a configurable threshold (default 45).
The combined conditions aim to identify stronger trend moves while avoiding choppy markets. All filters can be toggled on or off for flexibility.
Default risk: 10% of equity per trade. Users can adjust this.
Ideal for trend traders looking to filter noise and improve entry quality.

High Win Rate XAUUSD Strategy (EMA21 + RSI + Volume MA20)Buy Conditions:
Price above EMA 21
EMA 21 is rising
RSI > 55 and RSI increasing
Close is above EMA 21
Current candle is green (close > open)
Volume > MA20 of volume
Price below EMA 21
EMA 21 is falling
RSI < 45 and RSI decreasing
Close is below EMA 21
Current candle is red (close < open)
Volume > MA20 of volume

NASDAQ Liquidity Breaker Bot1. Define session time (7:20 PM – 7:40 PM BD time / 9:20–9:40 AM EST)
2. Detect 15M swing high/low zones
3. On 1M chart: Detect strong bullish/bearish break
4. Identify breaker candle zone
5. Trigger entry based on break + retest logic
6. Set SL and TP logic (dynamic if needed)
7. Plot everything visually (entries, exits, zones)

PC UpdatedThis indicator identifies a high-probability breakout setup using a simple but powerful 3-candle formation. It works on lower timeframes (like 5m) and is ideal for scalping or short-term intraday setups.

GOLD 4H - 355 EMA + Supertrendwhen the price is above the 355 EMA look for along BUY when the price is bellow 355 you look for a short SELL

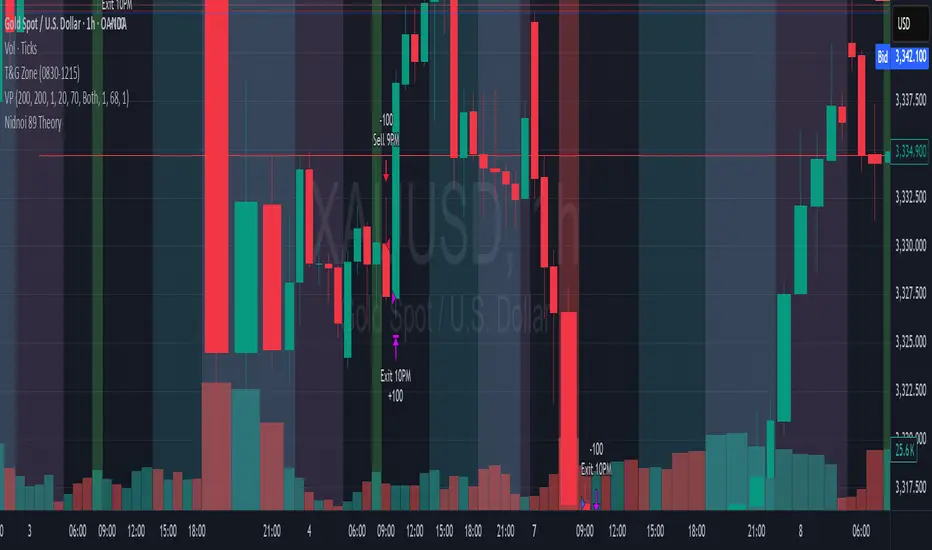
Nidnoi 89 TheoryNidnoi Morning Trading style
// This strategy is based on a reversal logic applied to the 8AM candle (Bangkok Time, UTC+7).
// The logic is:
// - If the 8AM candle is bullish (green), it indicates potential exhaustion — enter a SELL at the 9AM open.
// - If the 8AM candle is bearish (red), it suggests a possible bounce — enter a BUY at the 9AM open.
// All trades are closed at the 10AM open, limiting exposure to 1 hour.
//
// This strategy is designed for XAUUSD on a 1-hour chart and aligns with short-term intraday reversal patterns.
// The actual time used in code (UTC+7) is 9PM for the 8AM candle, and 10PM for the exit at 10AM.
//
// Highlights are shown on the 8AM candle for visual confirmation.
// Make sure your chart is set to 1H timeframe and uses XAUUSD.
GOLD DR Long with diamond & TP2 Exit האינדיקטור מזהה נקודת כניסה אידיאלית ל־LONG, פותח פוזיציה, קובע יעד רווח אוטומטי, מגן עם סטופלוס חכם, ומבצע מיצוע רק כשהתנאים בשלים – הכל קורה אוטומטית, בזמן אמת, על הגרף.
The indicator identifies an ideal LONG entry, opens a position, sets an automatic take-profit target, protects with a smart stop-loss, and averages in only when conditions are right – all fully automated, in real time, right on the chart.

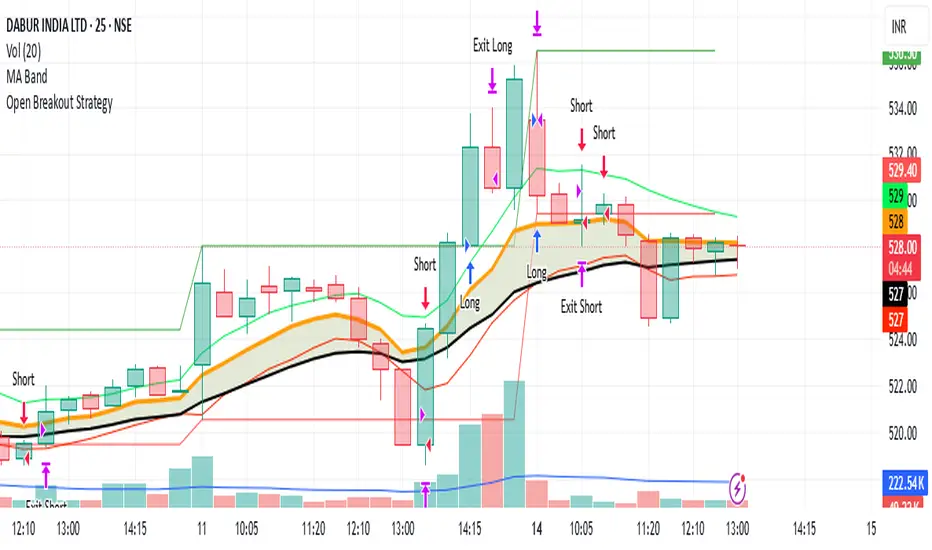
Open Breakout Strategyfirst 5min candle
SL is 0.25% TP is 2.25%
If breks low it is hsort
If breaks hi then it is long
MACD EMA + Time FilterStrategy Description: MACD EMA + Time Filter
This strategy combines MACD momentum, EMA trend filtering, and an optional time-based session filter (GMT+7) to generate high-probability trading signals. It is designed for intraday or short-term trading on small timeframes, and allows both Buy and Sell setups with fixed Risk-Reward (RR) control.
✅ Key Components:
EMA Filter: Uses a 21-period Exponential Moving Average (EMA) to determine the trend direction.
MACD Confirmation: Entries are confirmed using MACD crossover signals with customizable fast, slow, and signal periods.
Time Filter: Trades are only taken during a defined session (e.g., 19:00–22:00 GMT+7), ideal for high-liquidity trading hours.
RR Management: Entry signals include automatic Stop Loss (SL) and Take Profit (TP) levels, based on a pip buffer and RR multiplier.
Custom Options:
Enable/disable Buy or Sell signals
Show/hide SL/TP labels
Optionally display EMA on chart

Divergence Strategy [Trendoscope®]🎲 Overview
The Divergence Strategy is a sophisticated TradingView strategy that enhances the Divergence Screener by adding automated trade signal generation, risk management, and trade visualization. It leverages the screener’s robust divergence detection to identify bullish, bearish, regular, and hidden divergences, then executes trades with precise entry, stop-loss, and take-profit levels. Designed for traders seeking automated trading solutions, this strategy offers customizable trade parameters and visual feedback to optimize performance across various markets and timeframes.
For core divergence detection features, including oscillator options, trend detection methods, zigzag pivot analysis, and visualization, refer to the Divergence Screener documentation. This description focuses on the strategy-specific enhancements for automated trading and risk management.
🎲 Strategy Features
🎯Automated Trade Signal Generation
Trade Direction Control : Restrict trades to long-only or short-only to align with market bias or strategy goals, preventing conflicting orders.
Divergence Type Selection : Choose to trade regular divergences (bullish/bearish), hidden divergences, or both, targeting reversals or trend continuations.
Entry Type Options :
Cautious : Enters conservatively at pivot points and exits quickly to minimize risk exposure.
Confident : Enters aggressively at the latest price and holds longer to capture larger moves.
Mixed : Combines conservative entries with delayed exits for a balanced approach.
Market vs. Stop Orders: Opt for market orders for instant execution or stop orders for precise price entry.
🎯 Enhanced Risk Management
Risk/Reward Ratio : Define a risk-reward ratio (default: 2.0) to set profit targets relative to stop-loss levels, ensuring consistent trade sizing.
Bracket Orders : Trades include entry, stop-loss, and take-profit levels calculated from divergence pivot points, tailored to the entry type and risk-reward settings.
Stop-Loss Placement : Stops are strategically set (e.g., at recent pivot or last price point) based on entry type, balancing risk and trade validity.
Order Cancellation : Optionally cancel pending orders when a divergence is broken (e.g., price moves past the pivot in the wrong direction), reducing invalid trades. This feature is toggleable for flexibility.
🎯 Trade Visualization
Target and Stop Boxes : Displays take-profit (lime) and stop-loss (orange) levels as boxes on the price chart, extending 10 bars forward for clear visibility.
Dynamic Trade Updates : Trade visualizations are added, updated, or removed as trades are executed, canceled, or invalidated, ensuring accurate feedback.
Overlay Integration : Trade levels overlay the price chart, complementing the screener’s oscillator-based divergence lines and labels.
🎯 Strategy Default Configuration
Capital and Sizing : Set initial capital (default: $1,000,000) and position size (default: 20% of equity) for realistic backtesting.
Pyramiding : Allows up to 4 concurrent trades, enabling multiple divergence-based entries in trending markets.
Commission and Margin : Accounts for commission (default: 0.01%) and margin (100% for long/short) to reflect trading costs.
Performance Optimization : Processes up to 5,000 bars dynamically, balancing historical analysis and real-time execution.
🎲 Inputs and Configuration
🎯Trade Settings
Direction : Select Long or Short (default: Long).
Divergence : Trade Regular, Hidden, or Both divergence types (default: Both).
Entry/Exit Type : Choose Cautious, Confident, or Mixed (default: Cautious).
Risk/Reward : Set the risk-reward ratio for profit targets (default: 2.0).
Use Market Order : Enable market orders for immediate entry (default: false, uses limit orders).
Cancel On Break : Cancel pending orders when divergence is broken (default: true).
🎯Inherited Settings
The strategy inherits all inputs from the Divergence Screener, including:
Oscillator Settings : Oscillator type (e.g., RSI, CCI), length, and external oscillator option.
Trend Settings : Trend detection method (Zigzag, MA Difference, External), MA type, and length.
Zigzag Settings : Zigzag length (fixed repaint = true).
🎲 Entry/Exit Types for Divergence Scenarios
The Divergence Strategy offers three Entry/Exit Type options—Cautious, Confident, and Mixed—which determine how trades are entered and exited based on divergence pivot points. This section explains how these settings apply to different divergence scenarios, with placeholders for screenshots to illustrate each case.
The divergence pattern forms after 3 pivots. The stop and entry levels are formed on one of these levels based on Entry/Exit types.
🎯Bullish Divergence (Reversal)
A bullish divergence occurs when price forms a lower low, but the oscillator forms a higher low, signaling a potential upward reversal.
💎 Cautious:
Entry : At the pivot high point for a conservative entry.
Exit : Stop-loss at the last pivot point (previous low that is higher than the current pivot low); take-profit at risk-reward ratio. Canceled if price breaks below the pivot (if Cancel On Break is enabled).
Behavior : Enters after confirmation and exits quickly to limit downside risk.
💎Confident:
Entry : At the last pivot low, (previous low which is higher than the current pivot low) for an aggressive entry.
Exit : Stop-loss at recent pivot low, which is the lowest point; take-profit at risk-reward ratio. Canceled if price breaks below the pivot. (lazy exit)
Behavior : Enters early to capture trend continuation, holding longer for gains.
💎Mixed:
Entry : At the pivot high point (conservative).
Exit : Stop-loss at the recent pivot point that has resulted in lower low (lazy exit). Canceled if price breaks below the pivot.
Behavior : Balances entry caution with extended holding for trend continuation.
🎯Bearish Divergence (Reversal)
A bearish divergence occurs when price forms a higher high, but the oscillator forms a lower high, indicating a potential downward reversal.
💎Cautious:
Entry : At the pivot low point (lower high) for a conservative short entry.
Exit : Stop-loss at the previous pivot high point (previous high); take-profit at risk-reward ratio. Canceled if price breaks above the pivot (if Cancel On Break is enabled).
Behavior : Enters conservatively and exits quickly to minimize risk.
💎Confident:
Entry : At the last price point (previous high) for an aggressive short entry.
Exit : Stop-loss at the pivot point; take-profit at risk-reward ratio. Canceled if price breaks above the pivot.
Behavior : Enters early to maximize trend continuation, holding longer.
💎Mixed:
Entry : At the previous piot high point (conservative).
Exit : Stop-loss at the last price point (delayed exit). Canceled if price breaks above the pivot.
Behavior : Combines conservative entry with extended holding for downtrend gains.
🎯Bullish Hidden Divergence (Continuation)
A bullish hidden divergence occurs when price forms a higher low, but the oscillator forms a lower low, suggesting uptrend continuation. In case of Hidden bullish divergence, b]Entry is always on the previous pivot high (unless it is a market order)
💎Cautious:
Exit : Stop-loss at the recent pivot low point (higher than previous pivot low); take-profit at risk-reward ratio. Canceled if price breaks below the pivot (if Cancel On Break is enabled).
Behavior : Enters after confirmation and exits quickly to limit downside risk.
💎Confident:
Exit : Stop-loss at previous pivot low, which is the lowest point; take-profit at risk-reward ratio. Canceled if price breaks below the pivot. (lazy exit)
Behavior : Enters early to capture trend continuation, holding longer for gains.
🎯Bearish Hidden Divergence (Continuation)
A bearish hidden divergence occurs when price forms a lower high, but the oscillator forms a higher high, suggesting downtrend continuation. In case of Hidden Bearish divergence, b]Entry is always on the previous pivot low (unless it is a market order)
💎Cautious:
Exit : Stop-loss at the latest pivot high point (which is a lower high); take-profit at risk-reward ratio. Canceled if price breaks above the pivot (if Cancel On Break is enabled).
Behavior : Enters conservatively and exits quickly to minimize risk.
💎Confident/Mixed:
Exit : Stop-loss at the previous pivot high point; take-profit at risk-reward ratio. Canceled if price breaks above the pivot.
Behavior : Uses the late exit point to hold longer.
🎲 Usage Instructions
🎯Add to Chart:
Add the Divergence Strategy to your TradingView chart.
The oscillator and divergence signals appear in a separate pane, with trade levels (target/stop boxes) overlaid on the price chart.
🎯Configure Settings:
Adjust trade settings (direction, divergence type, entry type, risk-reward, market orders, cancel on break).
Modify inherited Divergence Screener settings (oscillator, trend method, zigzag length) as needed.
Enable/disable alerts for divergence notifications.
🎯Interpret Signals:
Long Trades: Triggered on bullish or bullish hidden divergences (if allowed), shown with green/lime lines and labels.
Short Trades: Triggered on bearish or bearish hidden divergences (if allowed), shown with red/orange lines and labels.
Monitor lime (target) and orange (stop) boxes for trade levels.
Review strategy performance metrics (e.g., profit/loss, win rate) in the strategy tester.
🎯Backtest and Optimize:
Use TradingView’s strategy tester to evaluate performance on historical data.
Fine-tune risk-reward, entry type, position sizing, and cancellation settings to suit your market and timeframe.
For questions, suggestions, or support, contact Trendoscope via TradingView or official support channels. Stay tuned for updates and enhancements to the Divergence Strategy!

SMA Pullback Strategy with ADX Filter
This is WIP tested strategy for nearly 2 years data(limitation of my essential Plan. This involves combination of various SMAs(9-200) on various timeframes and Haltrend(by Everget Sir) along integration with custom various slope calculation and ADX Calculation defined by Mentor Mr Gautam Mazumdar (X- @gautam_icma). Based on all conditions the buy and sell Alerts are to be generated intended with reducing trades(recommended use on daily charts) with maximizing Profit). Users Feedback are welcome. Making this Indicator public for the benefit of small and medium rated TradingView users in line with TradingView philosophy of helping small Traders.

SMA Pullback Strategy with ADX FilterThis is tested strategy for nearly 2 years data(limitation of my essential Plan. This involves combination of various SMAs(9-200) on various timeframes along with HalfTrend(Trend Following Indicator by Everget Sir) integrated with custom various slope calclulation and ADX Calculation defined by Mentor Mr Gautam Mazumdar (X- @gautam_icma). Based on all conditions the buy and sell Alerts are generated intended with reducing trades(recommended use on daily charts) with maximizing Profit). Users Feedback are welcome. Making this Indicator public for the benefit of small and medium rated TradingView users in line with TradingView philosophy of helping small Traders.

Variance and Moving Averages StrategyThe Variance and Moving Averages Strategy is a long-only trend-following system that combines volatility filtering with classic moving-average signals. It computes 5-, 15-, and 30-period simple moving averages (MA5, MA15, MA30) to identify a clear uptrend (MA5 > MA15 > MA30) and only enters when recent price variance (measured over the past 30 bars as the variance of (high–low)/close) is very low—avoiding choppy or noisy conditions. Once in a position, it employs a dual exit: a trend-based stop-loss (closing when MA5 falls below MA30) and a volatility-based take-profit (exiting when variance spikes above a high threshold), thus “buying low-volatility breakouts” and “selling on trend reversal or volatility expansion.”

5-Indicator Swing StrategyCustom 5-Indicator Swing Strategy for 4H Chart
---
Key Features:
1. Price Uptrend Detection
Uses 50-period EMA as trend filter
Only takes long positions when price is above EMA
2. RSI Momentum Confirmation
RSI must be above 40 and rising (3-bar confirmation)
Includes overbought exit at RSI > 70
3. MACD Bullish Crossover
Detects when MACD line crosses above signal line
Uses standard 12/26/9 settings (customizable)
4. Volume Spike Detection
Identifies volume spikes 1.5x above 20-period average
Confirms breakout strength
5. Fibonacci Retracement Levels
Calculates dynamic Fibonacci levels from recent swing high/low
Enters when price is near 38.2% to 61.8% support levels
Additional Features:
Risk Management: Stop Loss: 2 x ATR below entry price / Take Profit: 3 x ATR above entry price
ATR Length: 14 periods
Visual Indicators: Clear entry/exit signals with shapes
Information Table: Real-time status of all 5 conditions
Multi-Panel Display: RSI, MACD, and Volume in separate panels
Customizable Parameters: All inputs can be adjusted
Alert System: Built-in alerts for entry and exit signals

Black-Scholes + Smart Money StrategyAn AI Test script.
The Black-Scholes option pricing model to extract institutional sentiment and implied volatility signals, empowering Smart Money-style entries.

BTCUSD Strategy %TP/%SL + Leverage with AlertsFuture segment alerts on BUY and SELL - Entry/Exit Levels Alerts for BTCUSD updated on 12/07/2025

Meta Bot ENGLISH⚙️ Meta Bot – A Smart System for Custom Bot Creation
Meta Bot is more than just a trading bot – it's a full system for creating customized bots with advanced capabilities, allowing you to build your own unique strategy from thousands of possible combinations of indicators, trends, and entry confirmations.
The bot runs on the TradingView platform and gives you full control over timing, logic, and execution – result-driven and adaptable to any trading style.
🕒 Full Control Over Trading Sessions
The system allows you to define up to 3 sessions per day, select specific days, set start/end times, and automatically block trades outside defined hours.
You can also set profit/loss limits per day, week, or session, as well as limit the number of trades to maintain full control over your performance.
📊 Precision Matching to Your Trading Style
Choose up to 2 core market trends from a variety of options:
True Day/Week Open
Higher Time Frame Sequences
SMT Analysis
Defined Session High/Low
Each trend can be fully customized – including time frame, candle count, open points, and more – to fit any market or trading method.
🧠 Modular Indicator System
Build your entry logic using up to 4 different indicators per direction, with full customization available for each one:
RSI, MACD, STOCHASTIC, VWAP
Volume, MA Ribbon, Bollinger Bands
CHOCH, RSI Divergence, Precision Candle, AMD
You can adjust thresholds, extremes, validation ranges, and more based on your trading preferences and the nature of each indicator.
🎯 Advanced Entry Confirmations
- Market Order – instant execution
Limit Order by ticks
Inside Bar – pattern-based entry
FVG – full control with 3 entry types
Trade Reversal – execute opposite trades based on confirmations
🛡 Precise Exit Conditions
- Stop loss by ticks or market structure (Swing High/Low)
- Take profit by RR ratio, fixed ticks, or pivot levels
- Control over candle structure for identifying valid exit points
🧩 Flexible System to Build Unlimited Bot Variants
Thanks to its modular structure, Meta Bot isn’t just a single bot – it’s a **platform for building your own bots**.
With unlimited combinations of trends, indicators, entry/exit conditions, time filters, and sessions – you can fine-tune every strategy, compare versions, and develop a system that fits your exact needs.
✅ Built for All Trader Levels – Including Evaluation Accounts
Meta Bot is fully compatible with funded account programs (like Apex, FTMO, and others), with built-in risk controls, trading hour limitations, and trade count restrictions.
Its user-friendly interface makes it suitable for beginners, while offering advanced logic control for experienced traders.
✅ What You Get:
Modular system with control over every component
Battle-tested logic for changing market conditions
Maximum flexibility with high execution precision
Easy-to-use interface with intuitive configuration

My strategyThe Combination 1 strategy is a precision-based breakout and retest setup designed for the EUR/USD 2-minute chart, operating during the Asia and London sessions (UTC-4). It identifies a unique consolidation zone where price, the 20-period SMA, and the 200-period SMA all align within a tight 2-pip range, signaling potential buildup. Once price breaks 10 to 15 pips above this consolidation area, the strategy waits for a retest—specifically, a wick that touches the zone, followed by a bullish close. This confirms buyer strength and triggers a BUY alert, with the take profit set at the breakout high and the stop loss at the recent swing low. This strategy filters for clean trends and disciplined breakouts, minimizing noise and maximizing precision.

Fibonacci Spectrum + Regression Channel + ConfirmationsA versatile multi-strategy tool for technical traders using Fibonacci levels, regression channels, and dynamic confirmations.
📘 Overview
This TradingView strategy script helps traders detect high-probability breakouts, reversals, and trend continuations using:
🔢 Fibonacci retracement zones
📉 Regression channels (local & multi-timeframe)
✅ Multiple confirmations (Volume, RSI, MACD, Candlestick)
🔄 Preset strategy modes (Trend-follow, Mean-reversion, Breakout, Custom)
📊 Visual dashboard for real-time analysis
🔔 Alerts for breakout and breakdown signals
🛠️ Inputs & Configuration
🎛️ Preset Modes
Choose from 4 trading modes:
Custom — manually enable/disable confirmations
Trend-follow — emphasizes RSI & MACD alignment
Mean-reversion — tight channels, ignores volume
Breakout — aggressive setup, tighter fib lookback & wider bands
🔧 Changing preset automatically adjusts parameters like regression length, fib lookback, and confirmation rules.
🔢 Fibonacci Settings
Fib Lookback: Number of bars to calculate the high/low range.
Fib Ratios A-E: Defines retracement levels (0.236 to 0.786 by default).
Zones are shaded for clarity:
🟧 0.236–0.382
🟨 0.382–0.5
🟩 0.5–0.618
🟦 0.618–0.786
📉 Regression Channel
Reg Channel Length: Period used for linear regression.
StdDev Multiplier: Defines channel width.
Multi-Timeframe Support: Choose a higher timeframe (like 1h) to overlay broader trends.
✅ Confirmations (toggle ON/OFF or preset controlled)
Volume: Must be above its 20-bar average.
RSI: Must be above 50 and rising (or below 50 and falling for shorts).
MACD: Line must cross above Signal (bull) or below (bear).
Candlestick Pattern: Looks for Bullish or Bearish Engulfing candles.
📅 Backtest Settings
Enable/disable strategy entries and exits for simulation.
Entries:
Long when price breaks above Fib 0.618 with all confirmations met
Short when price breaks below Fib 0.382 with all bearish confirmations
Exits:
Long exits when price breaks below Fib 0.382
Short exits when price breaks above Fib 0.618
🔍 How to Use the Strategy
🔹 Step 1: Choose a Preset
Pick one of the four Preset Modes:
Want to follow a trend? Select Trend-follow
Expect a price bounce? Try Mean-reversion
Expect volatility? Use Breakout
Prefer full control? Use Custom
🔹 Step 2: Enable Confirmations (if in Custom mode)
Activate/deactivate:
Volume
RSI
MACD
Candlestick Patterns
These filters increase signal quality.
🔹 Step 3: Watch for Signals
Look for:
💠 "READY" labels (potential breakout or breakdown)
Color-coded Fibonacci zones and channel bounds
📈 Entry/Exit signals (when backtesting is enabled)
🔹 Step 4: Use the Dashboard
Located in the top-right, the table shows:
Indicator values
Trend direction (Up/Down)
Status (Bull/Bear, High/Low, Above/Below)
Closest Fibonacci level and candlestick patterns
Colors:
🟢 Green = Bullish or Positive
🔴 Red = Bearish or Negative
🟡 Yellow = Close to a key Fib level
🔔 Alerts (Included)
You can set alerts on the following conditions:
Pre-Breakout — all bullish confirmations + Fib 0.618 cross
Pre-Breakdown — all bearish confirmations + Fib 0.382 break
Position Opened — any strategy entry (for backtest tracking)
To activate:
Right-click the chart → Add Alert
Select this strategy and the condition (e.g., “Pre-Breakout Signal”)
📊 Example Use Cases
🟢 Breakout Trader
Set to Breakout
Watch for “READY” label above Fib 0.618
Confirm with strong volume & bullish MACD
Alert triggers → enter trade
🔴 Mean Reversion Trader
Set to Mean-reversion
Price hits lower channel + Fib 0.382
Weak volume, but RSI rebounds → consider long
⚖️ Trend Follower
Set to Trend-follow
RSI, MACD, and price all moving up above midline
Enter on Fib 0.618 bounce
🧪 Tips & Notes
Combine with multi-timeframe analysis by enabling the MTF Channel
Tweak Fib ratios if you're using alternative levels (e.g., 0.886)
Use strategy.percent_of_equity for dynamic position sizing in backtests
Set proper timeframes (e.g., 15m, 1h) based on your trading style
Not financial advice at all. Strategy still WIP, i mainly think the indicator is ready.
