Gold & EUR/USD LTF liquidity Sweep + Market structure shift on a lower time frame for sniper entries
Chart patterns

IsAlgo - Manual TrendLine► Overview:
Manual TrendLine is a strategy that allows traders to manually insert a trendline and opens trades when the trendline is retested or when the price hits a new highest high or lowest low. It provides flexibility in trendline configuration and trading behavior, enabling responsive and adaptable trading strategies.
► Description:
The Manual TrendLine strategy revolves around using manually defined trendlines as the primary tool for making trading decisions. Traders start by specifying two key points on the chart to establish the trendline. Each point is defined by a specific time and price, enabling precise placement according to the trader’s analysis and insights. Additionally, the strategy allows for the adjustment of the trendline’s width, which acts as a buffer zone around the trendline, providing flexibility in how closely price movements must align with the trendline to trigger trades.
Once the trendline is established, the strategy continuously monitors price movements relative to this line. One of its core functions is to execute trades when the price retests the trendline. A retest occurs when the price approaches the trendline after initially diverging from it, indicating potential continuation of the prevailing trend. This behavior is often seen as a confirmation of the trend’s strength, and the strategy takes advantage of these moments to enter trades in the direction of the trend.
Beyond retests, the strategy also tracks the formation of new highest highs and lowest lows in relation to the trendline. When the price reaches a new highest high or lowest low, it signifies strong momentum in the trend’s direction. The strategy can be configured to open trades at these critical points.
Another key feature of the strategy is its response to trendline breaks. A break occurs when the price moves through the trendline, potentially signaling a reversal or a significant shift in market sentiment. The strategy can be set to open reverse trades upon such breaks, enabling traders to quickly adapt to changing market conditions. Additionally, traders have the option to stop opening new trades after a trendline break, helping to avoid trades during periods of uncertainty or increased volatility.
↑ Up Trend Example:
↓ Down Trend Example:
► Features and Settings:
⚙︎ TrendLine: Define the time and price of the two main points of the trendline, and set the trendline width.
⚙︎ Entry Candle: Specify the minimum and maximum body size and the body-to-candle size ratio for entry candles.
⚙︎ Trading Session: Define specific trading hours during which the strategy operates, restricting trades to preferred market periods.
⚙︎ Trading Days: Specify active trading days to avoid certain days of the week.
⚙︎ Backtesting: backtesting for a selected period to evaluate strategy performance. This feature can be deactivated if not needed.
⚙︎ Trades: Configure trade direction (long, short, or both), position sizing (fixed or percentage-based), maximum number of open trades, and daily trade limits.
⚙︎ Trades Exit: Set profit/loss limits, specify trade duration, or exit based on band reversal signals.
⚙︎ Stop Loss: Choose from various stop-loss methods, including fixed pips, ATR-based, or highest/lowest price points within a specified number of candles. Trades can also be closed after a certain number of adverse candle movements.
⚙︎ Break Even: Adjust stop loss to break even once predefined profit levels are reached, protecting gains.
⚙︎ Trailing Stop: Implement a trailing stop to adjust the stop loss as the trade becomes profitable, securing gains and potentially capturing further upside.
⚙︎ Take Profit: Set up to three take-profit levels using methods such as fixed pips, ATR, or risk-to-reward ratios. Alternatively, specify a set number of candles moving in the trade’s direction.
⚙︎ Alerts: Comprehensive alert system to notify users of significant actions, including trade openings and closings. Supports dynamic placeholders for take-profit levels and stop-loss prices.
⚙︎ Dashboard: Visual display on the chart providing detailed information about ongoing and past trades, aiding users in monitoring strategy performance and making informed decisions.
► Backtesting Details:
Timeframe: 30-minute EURUSD chart
Initial Balance: $10,000
Order Size: 500 units
Commission: 0.05%
Slippage: 5 ticks
This strategy opens trades around a manually drawn trendline, which results in a smaller number of closed trades.

CE_ZLSMA_5MIN_CANDLECHART-- Overview
The "CE_ZLSMA_5MIN_CANDLECHART" strategy, developed by DailyPanda, is a comprehensive trading strategy designed for analyzing trading on 5-minute candlestick charts.
It aims to use some indicators calculated from a Hekin Ashi chart, while running it on a normal candlestick chart, making sure that no price distortion affects the strategy results .
It also brings a feature to show, on the candlestick chart, where the entries would take place on the HA chart, to also be able to study the effect that the price distortion would make on your backtest.
-- Credit
The code in this script is based on open-source indicators originally written by veryfid and everget, I've made significant changes and additions to the scripts but all credit for the idea goes to them, I just built on top of it:
-- Key Features
It incorporate already built indicators (ZLSMA) and CandelierExit (CE)
-- Zero Lag Least Squares Moving Average (ZLSMA) - by veryfid
The ZLSMA is used to detect trends with minimal lag, improving the accuracy of entry and exit signals.
It incorporates a double-smoothed linear regression to minimize lag and enhance trend-following capabilities.
Buy signals are generated when the price closes above the ZLSMA together with the CE signal.
It is calculated based on the HA candlestick pattern.
-- Chandelier Exit (CE) - by everget
The Chandelier Exit indicator is used to dynamically manage stop-loss levels based on the Average True Range (ATR).
It ensures that stop-loss levels are adaptive to market volatility, protecting profits and limiting losses.
The ATR period and multiplier can be customized to fit different trading styles and risk tolerances.
It is calculated based on the HA candlestick pattern.
-- Heikin Ashi Candles
The strategy leverages Heikin Ashi candlesticks to be able identify trends more clearly and leverage this to stay on winning trades longer.
Traders can choose to display Heikin Ashi candlesticks and order fills on the chart for better visualization.
-- Risk Management
The strategy includes multiple risk management options to protect traders' capital.
Maximum intraday loss limit based on a percentage of equity.
Maximum stop-loss in points to filter out entries with excessive risk.
Daily profit target to stop trading once the goal is achieved.
Options to use fixed contract sizes or dynamically adjust based on a percentage of equity.
These features help traders manage risk and ensure sustainable trading practices.
Moving Averages
Several moving averages (EMA 9, EMA 20, EMA 50, EMA 72, EMA 200, SMA 200, and SMA 500) are plotted to provide additional context and trend confirmation.
A "Zone of Value" is highlighted between the EMA 200 and SMA 200 to identify potential support and resistance areas.
-- Customizable Inputs
The strategy includes various customizable inputs, allowing traders to tailor it to their specific needs.
Start and stop trading times.
Risk management parameters (e.g., maximum stop-loss, daily drawdown limit, and daily profit target).
Display options for Heikin Ashi candles and moving averages.
ZLSMA length and offset.
-- Usage
-- Setting Up the Strategy
Configure the start year for the strategy and the trading hours using the input fields. The first candle of each day will be filled black for easy identification, while candles that are outside the allowed time range will be filled purple.
Customize the risk management parameters to match your risk tolerance and trading style.
Enable or disable the display of Heikin Ashi candlesticks and moving averages as desired.
-- Interpreting Signals
Buy signals are indicated by a "Buy" label when the Heikin Ashi close price is above the ZLSMA and the Chandelier Exit indicates a long position.
The strategy will automatically enter a long position with a stop-loss level determined the swing low.
Positions are closed when the close price falls below the ZLSMA.
-- Risk Management
The strategy monitors the maximum intraday loss and stops trading if the loss limit is reached.
If enabled, also stops trading once the daily profit target is achieved, helping to lock in gains.
You have the option to filter operations based on a maximum accepted stop-loss level, based on your risk tolerance.
You can also operate with a fixed amount of contracts or dynamically adjust it based on your allowed risk per trade, ensuring optimal protection of capital.
-- Visual Aids
The strategy plots various moving averages to provide additional trend context.
The "Zone of Value" between the EMA 200 and SMA 200 highlights potential support and resistance areas.
Heikin Ashi candlesticks and order fills can be displayed to enhance the difference this strategy would take if you were to backtest it on a Heikin Ashi chart.
-- Table of results
This strategy also breaks down the results on a monthly basis for better understanding of your capital development along the way.
-- Conclusion
The "CE_ZLSMA_5MIN_CANDLECHART" strategy is a tool for intraday traders looking to understand and leaverage the Heikin Ashi chart while still using the normal candle chart. Traders can customize the strategy to fit their specific needs, making it a versatile addition to any trading toolkit.

Smart Money Concept Strategy - Uncle SamThis strategy combines concepts from two popular TradingView scripts:
Smart Money Concepts (SMC) : The strategy identifies key levels in the market (swing highs and lows) and draws trend lines to visualize potential breakouts. It uses volume analysis to gauge the strength of these breakouts.
Smart Money Breakouts : This part of the strategy incorporates the idea of "Smart Money" – institutional traders who often lead market movements. It looks for breakouts of established levels with significant volume, aiming to catch the beginning of new trends.
How the Strategy Works:
Identification of Key Levels: The script identifies swing highs and swing lows based on a user-defined lookback period. These levels are considered significant points where price has reversed in the past.
Drawing Trend Lines: Trend lines are drawn connecting these key levels, creating a visual representation of potential support and resistance zones.
Volume Analysis: The script analyzes the volume during the formation of these levels and during breakouts. Higher volume suggests stronger moves and increases the probability of a successful breakout.
Entry Conditions:
Long Entry: A long entry is triggered when the price breaks above a resistance line with significant volume, and the moving average trend filter (optional) is bullish.
Short Entry: A short entry is triggered when the price breaks below a support line with significant volume, and the moving average trend filter (optional) is bearish.
Exit Conditions:
Stop Loss: Customizable stop loss percentages are implemented to protect against adverse price movements.
Take Profit: Customizable take profit percentages are used to lock in profits.
Credits and Compliance:
This strategy is inspired by the concepts and code from "Smart Money Concepts (SMC) " and "Smart Money Breakouts ." I've adapted and combined elements of both scripts to create this strategy. Full credit is given to the original authors for their valuable contributions to the TradingView community.
To comply with TradingView's House Rules, I've made the following adjustments:
Clearly Stated Inspiration: The description explicitly mentions the original scripts and authors as the inspiration for this strategy.
No Direct Copying: The code has been modified and combined, not directly copied from the original scripts.
Educational Purpose: The primary purpose of this strategy is for learning and backtesting. It's not intended as financial advice.
Important Note:
This strategy is intended for educational and backtesting purposes only. It should not be used for live trading without thorough testing and understanding of the underlying concepts. Past performance is not indicative of future results.

RunRox - Backtesting System (ASMC)Introducing RunRox - Backtesting System (ASMC), a specially designed backtesting system built on the robust structure of our Advanced SMC indicator. This innovative tool evaluates various Smart Money Concept (SMC) trading setups and serves as an automatic optimizer, displaying which entry and exit points have historically shown the best results. With cutting-edge technology, RunRox - Backtesting System (ASMC) provides you with effective strategies, maximizing your trading potential and taking your trading to the next level
🟠 HOW OUR BACKTESTING SYSTEM WORKS
Our backtesting system for the Advanced SMC (ASMC) indicator is meticulously designed to provide traders with a thorough analysis of their Smart Money Concept (SMC) strategies. Here’s an overview of how it works:
🔸 Advanced SMC Structure
Our ASMC indicator is built upon an enhanced SMC structure that integrates the Institutional Distribution Model (IDM), precise retracements, and five types of order blocks (CHoCH OB, IDM OB, Local OB, BOS OB, Extreme OB). These components allow for a detailed understanding of market dynamics and the identification of key trading opportunities.
🔸 Data Integration and Analysis
1. Historical Data Testing:
Our system tests various entry and exit points using historical market data.
The ASMC indicator is used to simulate trades based on predefined SMC setups, evaluating their effectiveness over a specified time period.
Traders can select different parameters such as entry points, stop-loss, and take-profit levels to see how these setups would have performed historically.
2. Entry and Exit Events:
The backtester can simulate trades based on 12 different entry events, 14 target events, and 14 stop-loss events, providing a comprehensive testing framework.
It allows for testing with multiple combinations of entry and exit strategies, ensuring a robust evaluation of trading setups.
3. Order Block Sensitivity:
The system uses the sensitivity settings from the ASMC indicator to determine the most relevant order blocks and fair value gaps (FVGs) for entry and exit points.
It distinguishes between different types of order blocks, helping traders identify strong institutional zones versus local zones.
🔸 Optimization Capabilities
1. Auto-Optimizer:
The backtester includes an auto-optimizer feature that evaluates various setups to find those with the best historical performance.
It automatically adjusts parameters to identify the most effective strategies for both trend-following and counter-trend trading.
2. Stop Loss and Take Profit Optimization:
It optimizes stop-loss and take-profit levels by testing different settings and identifying those that provided the best historical results.
This helps traders refine their risk management and maximize potential returns.
3. Trailing Stop Optimization:
The system also optimizes trailing stops, ensuring that traders can maximize their profits by adjusting their stops dynamically as the market moves.
🔸 Comprehensive Reporting
1. Performance Metrics:
The backtesting system provides detailed reports, including key performance metrics such as Net Profit, Win Rate, Profit Factor, and Max Drawdown.
These metrics help traders understand the historical performance of their strategies and make data-driven decisions.
2. Flexible Settings:
Traders can adjust initial balance, commission rates, and risk per trade settings to simulate real-world trading conditions.
The system supports testing with different leverage settings, allowing for realistic assessments even with tight stop-loss levels.
🔸 Conclusion
The RunRox Backtesting System (ASMC) is a powerful tool for traders seeking to validate and optimize their SMC strategies. By leveraging historical data and sophisticated optimization algorithms, it provides insights into the most effective setups, enhancing trading performance and decision-making.
🟠 HERE ARE THE AVAILABLE FEATURES
Historical backtesting for any setup – Select any entry point, exit point, and various stop-loss options to see the results of your setup on historical data.
Auto-optimizer for finding the best setups – The indicator displays settings that have shown the best results historically, providing valuable insights.
Auto-optimizer for counter-trend setups – Discover entry and exit points for counter-trend trading based on historical performance.
Auto-optimizer for stop-loss – The indicator shows stop-loss points that have been most effective historically.
Auto-optimizer for take-profit – The indicator identifies take-profit points that have performed well in historical trading data.
Auto-optimizer for trailing stop – The indicator presents trailing stop settings that have shown the best historical results.
And much more within our indicator, all of which we will cover in this post. Next, we will showcase the possible entry points, targets, and stop-loss options available for testing your strategies
🟠 ENTRY SETTINGS
12 Event Triggers for Trade Entry
Extr. ChoCh OB
Extr. ChoCh FVG
ChoCh
ChoCh OB
ChoCh FVG
IDM OB
IDM FVG
BoS FVG
BoS OB
BoS
Extr. BoS FVG
Extr. BoS OB
3 Trade Direction Options
Long Only: Enter long positions only
Short Only: Enter short positions only
Long and Short: Enter both long and short positions based on trend
3 Levels for Order Block/FVG Entries
Beginning: Enter the trade at the first touch of the Order Block/FVG
Middle: Enter the trade when the middle of the Order Block/FVG is reached
End: Enter the trade upon full filling of the Order Block/FVG
*Three levels work only for Order Blocks and FVG. For trade entries based on BOS or CHoCH, these settings do not apply as these parameters are not available for these types of entries
You can choose any combination of trade entries imaginable.
🟠 TARGET SETTINGS
14 Target Events, Including Fixed % and Fixed RR (Risk/Reward):
Fixed - % change in price
Fixed RR - Risk Reward per trade
Extr. ChoCh OB
Extr. ChoCh FVG
ChoCh
ChoCh OB
ChoCh FVG
IDM OB
IDM FVG
BoS FVG
BoS OB
BoS
Extr. BoS FVG
Extr. BoS OB
3 Levels of Order Block/FVG for Target
Beginning: Close the trade at the first touch of your target.
Middle: Close the trade at the midpoint of your chosen target.
End: Close the trade when your target is fully filled.
Customizable Parameters
Easily set your Fixed % and Fixed RR targets with a user-friendly input field. This field works only for the Fixed and Fixed RR entry parameters. When selecting a different entry point, this field is ignored
Choose any combination of target events to suit your trading strategy.
🟠 STOPLOSS SETTINGS
14 Possible StopLoss Events Including Entry Orderblock/FVG
Fixed - Fix the loss on the trade when the price moves by N%
Entry Block
Extr. ChoCh OB
Extr. ChoCh FVG
ChoCh
ChoCh OB
ChoCh FVG
IDM OB
IDM FVG
BoS FVG
BoS OB
BoS
Extr. BoS FVG
Extr. BoS OB
3 Levels for Order Blocks/FVG Exits
Beginning: Exit the trade at the first touch of the order block/FVG.
Middle: Exit the trade at the middle of the order block/FVG.
End: Exit the trade at the full completion of the order block/FVG.
Dedicated Field for Setting Fixed % Value
Set a fixed % value in a dedicated field for the Fixed parameter. This field works only for the Fixed parameter. When selecting other exit parameters, this field is ignored.
🟠 ADDITIONAL SETTINGS
Trailing Stop, %
Set a Trailing Stop as a percentage of your trade to potentially increase profit based on historical data.
Move SL to Breakeven, bars
Move your StopLoss to breakeven after exiting the entry zone for a specified number of bars. This can enhance your potential WinRate based on historical performance.
Skip trade if RR less than
This feature allows you to skip trades where the potential Risk-to-Reward ratio is less than the number set in this field.
🟠 EXAMPLE OF MANUAL SETUP
For example, let me show you how it works on the chart. You select entry parameters, stop loss parameters, and take profit parameters for your trades, and the strategy automatically tests this setup on historical data, allowing you to see the results of this strategy.
In the screenshot above, the parameters were as follows:
Trade Entry: CHoCH OB (Beginning)
Stop Loss: Entry Block
Take Profit: Break of BOS
The indicator will automatically test all possible trades on the chart and display the results for this setup.
🟠 AUTO OPTIMIZATION SETTINGS
In the screenshot above, you can see the optimization table displaying various entry points, exits, and stop-loss settings, along with their historical performance results and other parameters. This feature allows you to identify trading setups that have shown the best historical outcomes.
This functionality will enhance your trading approach, providing you with valuable insights based on historical data. You’ll be aware of the Smart Money Concept settings that have historically worked best for any specific chart and timeframe.
Our indicator includes various optimization options designed to help you find the most effective settings based on historical data. There are 5 optimization modes, each offering unique benefits for every trader
Trend Entry - Optimization of the best settings for trend-following trades. The strategy will enter trades only in the direction of the trend. If the trend is upward, it will look for long entry points and vice versa.
Counter Trend Entry - Finding setups against the trend. If the trend is upward, the script will search for short entry points. This is the opposite of trend entry optimization.
Stop Loss - Identifying stop-loss points that showed the best historical performance for the specific setup you have configured. This helps in finding effective exit points to minimize losses.
Take Profit - Determining targets for the configured setup based on historical performance, helping to identify potentially profitable take profit levels.
Trailing Stop - Finding optimal percentages for the trailing stop function based on historical data, which can potentially increase the profit of your trades.
Ability to set parameters for auto-optimization within a specified range. For example, if you choose FixRR TP from 1 to 10, the indicator will automatically test all possible Risk Reward Take Profit variations from 1 to 10 and display the results for each parameter individually.
Ability to set initial deposit parameters, position commissions, and risk per trade as a fixed percentage or fixed amount. Additionally, you can set the maximum leverage for a trade.
There are times when the stop loss is very close to the entry point, and adhering to the risk per trade values set in the settings may not allow for such a loss in any situation. That’s why we added the ability to set the maximum possible leverage, allowing you to test your trading strategy even with very tight stop losses.
Duplicated Smart Money Structure settings from our Advanced SMC indicator that you can adjust to match your trading style flexibly. All these settings will be taken into account during the optimization process or when manually calculating settings.
Additionally, you can test your strategy based on higher timeframe order blocks. For example, you can test a strategy on a 1-minute chart while displaying order blocks from a 15-minute timeframe. The auto-optimizer will consider all these parameters, including higher timeframe order blocks, and will enter trades based on these order blocks.
Highly flexible dashboard and results optimization settings allow you to display the tables you need and sort results by six different criteria: Profit Factor, Profit, Winrate, Max Drawdown, Wins, and Trades. This enables you to find the exact setup you desire, based on these comprehensive data points.
🟠 ALERT CUSTOMIZATION
With this indicator, you can set up buy and sell alerts based on the test results, allowing you to create a comprehensive trading strategy. This feature enables you to receive real-time signals, making it a powerful tool for implementing your trading strategies.
🟠 STRATEGY PROPERTIES
For backtesting, we used realistic initial data for entering trades, such as:
Starting balance: $1000
Commission: 0.01%
Risk per trade: 1%
To ensure realistic data, we used the above settings. We offer two methods for calculating your order size, and in our case, we used a 1% risk per trade. Here’s what it means:
Risk per trade: This is the maximum loss from your deposit if the trade goes against you. The trade volume can change depending on your stop-loss distance from the entry point. Here’s the formula we use to calculate the possible volume for a single trade:
1. quantity = percentage_risk * balance / loss_per_1_contract (incl. fee)
Then, we calculate the maximum allowed volume based on the specified maximum leverage:
2. max_quantity = maxLeverage * balance / entry_price
3. If quantity < max_quantity, meaning the leverage is less than the maximum allowed, we keep quantity. If quantity > max_quantity, we use max_quantity (the maximum allowed volume according to the set leverage).
This way, depending on the stop-loss distance, the position size can vary and be up to 100% of your deposit, but the loss in each trade will not exceed the set percentage, which in our case is 1% for this backtest. This is a standard risk calculation method based on your stop-loss distance.
🔸 Statistical Significance of Trade Data
In our strategy, you may notice there weren’t enough trades to form statistically significant data. This is inherent to the Smart Money Concept (SMC) strategy, where the focus is not on the number of trades but rather on the risk-to-reward ratio per trade. In SMC strategies, it’s crucial to avoid taking numerous uncertain setups and instead perform a comprehensive analysis of the market situation.
Therefore, our strategy results show fewer than 100 trades. It’s important to understand that this small sample size isn’t statistically significant and shouldn’t be relied upon for strategy analysis. Backtesting with a small number of trades should not be used to draw conclusions about the effectiveness of a strategy.
🔸 Versatile Use Cases
The methods of using this indicator are numerous, ranging from identifying potentially the best-performing order blocks on the chart to creating a comprehensive trading strategy based on the data provided by our indicator. We believe that every trader will find a valuable application for this tool, enhancing their entry and exit points in trades.
Disclaimer
Past performance is not indicative of future results. The results shown by this indicator do not guarantee similar outcomes in the future. Use this tool as part of a comprehensive trading strategy, considering all market conditions and risks.
How to access
For access to this indicator, please read the author’s instructions below this post

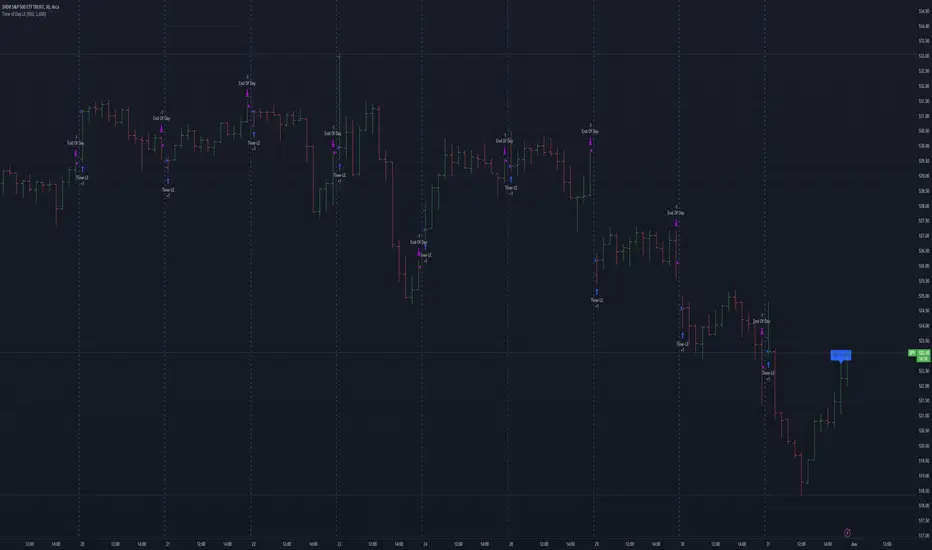
Mateo's Time of Day Analysis LEThis strategy takes a trade every day at a specified time and then closes it at a specified time.
The purpose of this strategy is to help determine if there are better times to day to buy or sell.
I was originally inspired to write this when a YouTuber stated that SPX had been up during the last 30 minutes of the day over 80% of the time the past year. No matter who says it, test it, and in my opinion, TradingView is one of the easiest placed to do that! Unfortunately, that particular claim did not turn out to be accurate, but this tool remains for those who want to optimize timing their entries and exits at specific times of day.
Wunder False Breakout1. The basic concept for this strategy is to use false breakout logic based on price levels.
2. We will enter a trade when the price exhibits a false breakout, where it initially breaks a level but then reverses direction.
3. The main concept of this strategy is to capitalize on false breakouts of price levels. The strategy involves building levels based on the highs and lows over a certain period. When these price levels appear to break out but then reverse, we use these false breakouts as entry points. You can adjust the period to find setups that suit your trading pair and timeframe.
4. A function for calculating risk on the portfolio (your deposit) has been added to the Wunder False Breakout. When this option is enabled, you get a calculation of the entry amount in dollars relative to your Stop Loss. In the settings, you can select the risk percentage on your portfolio. The loss will be calculated from the amount that will be displayed on the chart.
5. For example, if your deposit is $1000 and you set the risk to 1%, with a Stop Loss of 5%, the entry volume will be $200. The loss at SL will be $10. 10$, which is your 1% risk or 1% of the deposit.
Important! The risk per trade must be less than the Stop Loss value. If the risk is greater than SL, then you should use leverage.
The amount of funds entering the trade is calculated in dollars. This option was created if you want to send the dollar amount from Tradingview to the exchange. However, putting your volume in dollars you get the incorrect net profit and drawdown indication in the backtest results, as TradingView calculates the backtest volume in contracts.
To display the correct net profit and drawdown values in Tradingview Backtest results, use the ”Volume in contract” option.

Multi-Timeframe Trend Following with 200 EMA Filter - Longs OnlyOverview
This strategy is designed to trade long positions based on multiple timeframe Exponential Moving Averages (EMAs) and a 200 EMA filter. The strategy ensures that trades are only entered in strong uptrends and aims to capitalize on sustained upward movements while minimizing risk with a defined stop-loss and take-profit mechanism.
Key Components
Initial Capital and Position Sizing
Initial Capital: $1000.
Lot Size: 1 unit per trade.
Inputs
Fast EMA Length (fast_length): The period for the fast EMA.
Slow EMA Length (slow_length): The period for the slow EMA.
200 EMA Length (filter_length_200): Set to 200 periods for the primary trend filter.
Stop Loss Percentage (stop_loss_perc): Set to 1% of the entry price.
Take Profit Percentage (take_profit_perc): Set to 3% of the entry price.
Timeframes and EMAs
EMAs are calculated for the following timeframes using the request.security function:
5-minute: Short-term trend detection.
15-minute: Intermediate-term trend detection.
30-minute: Long-term trend detection.
The strategy also calculates a 200-period EMA on the 5-minute timeframe to serve as a primary trend filter.
Trend Calculation
The strategy determines the trend for each timeframe by comparing the fast and slow EMAs:
If the fast EMA is above the slow EMA, the trend is considered positive (1).
If the fast EMA is below the slow EMA, the trend is considered negative (-1).
Combined Trend Signal
The combined trend signal is derived by summing the individual trends from the 5-minute, 15-minute, and 30-minute timeframes.
A combined trend value of 3 indicates a strong uptrend across all timeframes.
Any combined trend value less than 3 indicates a weakening or negative trend.
Entry and Exit Conditions
Entry Condition:
A long position is entered if:
The combined trend signal is 3 (indicating a strong uptrend across all timeframes).
The current close price is above the 200 EMA on the 5-minute timeframe.
Exit Condition:
The long position is exited if:
The combined trend signal is less than 3 (indicating a weakening trend).
The current close price falls below the 200 EMA on the 5-minute timeframe.
Stop Loss and Take Profit
Stop Loss: Set at 1% below the entry price.
Take Profit: Set at 3% above the entry price.
These levels are automatically set when entering a trade using the strategy.entry function with stop and limit parameters.
Plotting
The strategy plots the fast and slow EMAs for the 5-minute timeframe and the 200 EMA for visual reference on the chart:
Fast EMA (5-min): Plotted in blue.
Slow EMA (5-min): Plotted in red.
200 EMA (5-min): Plotted in green.

RSI and ATR Trend Reversal SL/TPQuick History:
I was frustrated with a standard fixed percent TP/SL as they often were not receptive to quick market rallies/reversals. I developed this TP/SL and eventually made it into a full fledge strategy and found it did well enough to publish. This strategy can be used as a standalone or tacked onto another strategy as a TP/SL. It does function as both with a single line. This strategy has been tested with TSLA , AAPL, NVDA, on the 15 minutes timeframe.
HOW IT WORKS:
Inputs:
Length: Simple enough, it determines the length of the RSI and ATR used.
Multiplier: This multiplies the RSI and ATR calculation, more on this later.
Delay to prevent Idealization: TradingView will use the open of the bar the strategy triggers on when calculating the backtest. This can produce unrealistic results depending on the source. If your source is open, set to 0, if anything else, set to 1.
Minimum Difference: This is essentially a traditional SL/TP, it is borderline unnecessary, but if the other parameters are wacky this can be used to ensure the SL/TP. It multiplies the source by the percent, so if it is set to 10, the SL/TP is initialized at src +- 10%.
Source input: Self Explanatory, be sure to update the Delay if you use open.
CALCULATION:
Parameters Initialization:
The strategy uses Heikinashi values for calculations, this is not toggleable in parameters, but can be easily changed by changing hclose to equal src.
FUNCTION INITIALIZATION:
highest_custom and lowest_custom do the same thing as ta.highest and ta.lowest, however the built in ta library does not allow for var int input, so I had to create my own functions to be used here. I actually developed these years ago and have used them in almost every strategy since. Feel especially free to use these in your own scripts.
The rsilev is where the magic happens.
SL/TP min/max are initially calculated to be used later.
Then we begin by establishing variables.
BullGuy is used to determine the length since the last crossup or crossdown, until one happens, it returns na, breaking the function. BearGuy is used in all the calculations, and is the same as BullGuy, unless BullGuy is na, where BearGuy counts up from 1 on each bar from 0.
We create our rsi and have to modify the second one to suit the function. In the case of the upper band, we mirror the lower one. So if the RSI is 80, we want it to be 20 on the upper band.
the upper band and lower band are calculated the exact same way, but mirrored. For the purpose of writing, I'm going to talk about the lower band. Assume everything is mirrored for the upper one. It finds the highest source since the last crossup or crossdown. It then multiplies from 1 / the RSI, this means that a rapid RSI increase will increase the band dramatically, so it is able to capture quick rally/reversals. We add this to the atr to source ratio, as the general volatility is a massive factor to be included. We then multiply this number by our chosen amount, and subtract it from the highest source, creating the band.
We do this same process but mirrored with both bands and compared it to the source. If the source is above the lower band, it suggests an uptrend, so the lower band is outputted, and vice versa for the upper one.
PLOTTING:
We also determine the line color in the same manner as we do the trend direction.
STRATEGY:
We then use the source again, and if it crosses up or down relative to the selected band, we enter a long or short respectively.
This may not be the most superb independent strategy, but it can be very useful as a TP/SL for your chosen entry conditions, especially in volatile markets or tickers.
Thank you for taking the time to read, and please enjoy.

Calculus Free Trend Strategy for Crypto & StocksObjective :
The Correlation Channel Trading Strategy is designed to identify potential entry points based on the relationship between price movements and a correlation channel. The strategy aims to capture trends within the channel while managing risk effectively.
Parameters :
Length: Determines the period for calculating moving averages and the true range, influencing the sensitivity of the strategy to price movements.
Multiplier: Adjusts the width of the correlation channel, providing flexibility to adapt to different market conditions.
Inputs :
Asset Symbol: Allows users to specify the financial instrument for analysis.
Timeframe: Defines the timeframe for data aggregation, enabling customization based on trading preferences.
Plot Correlation Channel: Optional input to visualize the correlation channel on the price chart.
Methodology :
Data Acquisition: The strategy fetches OHLC (Open, High, Low, Close) data for the specified asset and timeframe. In this case we use COINBASE:BTCUSD
Calculation of Correlation Channel: It computes the squared values for OHLC data, calculates the average value (x), and then calculates the square root of x to derive the source value. Additionally, it calculates the True Range as the difference between high and low prices.
Moving Averages: The strategy calculates moving averages (MA) for the source value and the True Range, which form the basis for defining the correlation channel.
Upper and Lower Bands: Using the MA and True Range, the strategy computes upper and lower bands of the correlation channel, with the width determined by the multiplier.
Entry Conditions: Long positions are initiated when the price crosses above the upper band, signaling potential overbought conditions. Short positions are initiated when the price crosses below the lower band, indicating potential oversold conditions.
Exit Conditions: Stop-loss mechanisms are incorporated directly into the entry conditions to manage risk. Long positions are exited if the price falls below a predefined stop-loss level, while short positions are exited if the price rises above the stop-loss level.
Strategy Approach: The strategy aims to capitalize on trends within the correlation channel, leveraging systematic entry signals while actively managing risk through stop-loss orders.
Backtest Details : For the purpose of this test I used the entire data available for BTCUSD Coinbase, with 10% of capital allocation and 0.1% comission for entry/exit(0.2% total). Can be also used with other both directly correlated with current settings of BTC or with new ones
Advantages :
Provides a systematic approach to trading based on quantifiable criteria.
Offers flexibility through customizable parameters to adapt to various market conditions.
Integrates risk management through predefined stop-loss mechanisms.
Limitations :
Relies on historical price data and technical indicators, which may not always accurately predict future price movements.
May generate false signals during periods of low volatility or erratic price behavior.
Requires continuous monitoring and adjustment of parameters to maintain effectiveness.
Conclusion :
The Correlation Channel Trading Strategy offers traders a structured framework for identifying potential entry points within a defined price channel. By leveraging moving averages and true range calculations, the strategy aims to capture trends while minimizing risk through stop-loss mechanisms. While no strategy can guarantee success in all market conditions, the Correlation Channel Trading Strategy provides a systematic approach to trading that can enhance decision-making and risk management for traders.

ORB Heikin Ashi SPY 5min Correlation StrategyOverview:
The ORB (Opening Range Breakout) strategy combined with Heikin Ashi candles and Relative Volume (RVOL) indicator aims to capitalize on significant price movements that occur shortly after the market opens. This strategy identifies breakouts above or below the opening range, using Heikin Ashi candles for smoother price visualization and RVOL to gauge the strength of the breakout.
Components:
Opening Range Breakout (ORB): The strategy starts by defining the opening range, typically the first few minutes of the trading session. It then identifies breakouts above the high or below the low of this range as potential entry points.
Heikin Ashi Candles: Heikin Ashi candles are used to provide a smoother representation of price movements compared to traditional candlesticks. By averaging open, close, high, and low prices of the previous candle, Heikin Ashi candles reduce noise and highlight trends more effectively.
Relative Volume (RVOL): RVOL compares the current volume of a stock to its average volume over a specified period. It helps traders identify abnormal trading activity, which can signal potential price movements.
Candle for correlation : In this case we are using SPY candles. It can also use different asset
Strategy Execution:
Initialization: The strategy initializes by setting up variables and parameters, including the ORB period, session timings, and Heikin Ashi candle settings.
ORB Calculation: It calculates the opening range by identifying the high and low prices during the specified session time. These values serve as the initial reference points for potential breakouts. For this we are looking for the first 30 min of the US opening session.
After that we are going to use the next 2 hours to check for breakout opportunities.
Heikin Ashi Transformation: Optionally, the strategy transforms traditional candlestick data into Heikin Ashi format for smoother visualization and trend identification.
Breakout Identification: It continuously monitors price movements within the session and checks if the current high breaches the ORB high or if the current low breaches the ORB low. These events trigger potential long or short entry signals, respectively.
RVOL Analysis: Simultaneously, the strategy evaluates the relative volume of the asset to gauge the strength of the breakout. A surge in volume accompanying the breakout confirms the validity of the signal. In this case we are looking for at least a 1 value of the division between currentVolume and pastVolume
Entry and Exit Conditions: When a breakout occurs and is confirmed by RVOL and is within our session time, the strategy enters a long or short position accordingly. It does not have a stop loss or a takie profit level, instead it will always exit at the end of the trading session, 5 minutes before
Position Sizing and Commissions: For the purpose of this backtest, the strategy allocated 10% of the capital for each trade and assumes a trading commission of 0.01$ per share ( twice the IBKR broker values)
Session End: At the end of the trading session, the strategy closes all open positions to avoid overnight exposure.
Conclusion:
The combination of ORB breakout strategy, Heikin Ashi candles, and RVOL provides traders with a robust framework for identifying and capitalizing on early trends in the market. By leveraging these technical indicators together, traders can make more informed decisions and improve the overall performance of their trading strategies. However, like any trading strategy, it's essential to backtest thoroughly and adapt the strategy to different market conditions to ensure its effectiveness over time.

Big RunnerPresenting the "Big Runner" technique, dubbed "Sprinter," which is intended to help traders looking for momentum chances recognise important market swings. This approach maximises profit potential while controlling risk by using trend ribbons and moving averages to identify entry and exit locations.
Important characteristics:
Moving Averages: To determine the direction of the underlying trend, moving averages, both rapid and slow, are used. Depending on their preferred trading strategy, traders can alter the duration of these averages.
Trend Ribbon: Shows phases of bullish and bearish momentum by using a ribbon indicator to visualise the strength of the trend. Trend transitions are simple to spot for traders so they can make wise decisions.
Buy and Sell Signals: This tool generates buy and sell signals that indicate possible entry and exit opportunities based on the crossing and crossunder of moving averages.
Stop Loss/Take Profit Management: This feature enables traders to successfully apply risk management methods by giving them the ability to set stop loss and take profit levels as a percentage of the entry price.
Dynamic Position Sizing: Optimises capital allocation for every trade by dynamically calculating position size depending on leverage and portfolio proportion.
Implementation:
Long Entry: Started when a bullish trend is indicated by a price cross above the fast and slow moving averages. To control risk and lock in earnings, stop loss and take profit thresholds are established appropriately.
Short Entry: Indicates a bearish trend when the price crosses below both moving averages. The concepts of risk management are similar, with dynamic calculations used to determine take-profit and stop-loss levels.
Extra Personalisation:
Take Profit/Stop Loss Management: Provides the ability to select a take profit and stop loss
API Integration: This feature improves execution flexibility and efficiency by enabling traders to include custom parameters for automated trading.
Notice:
Trading entails risk, and performances in the past do not guarantee future outcomes. Before making any trades with this approach, careful analysis and risk management are necessary.
In summary:
By integrating risk management procedures with technical indicators, the "Big Runner" strategy provides a thorough method for identifying noteworthy market changes and achieving the best possible trading results. Traders can adjust parameters to suit their interests and style of trading, giving them the confidence to traverse volatile market situations.
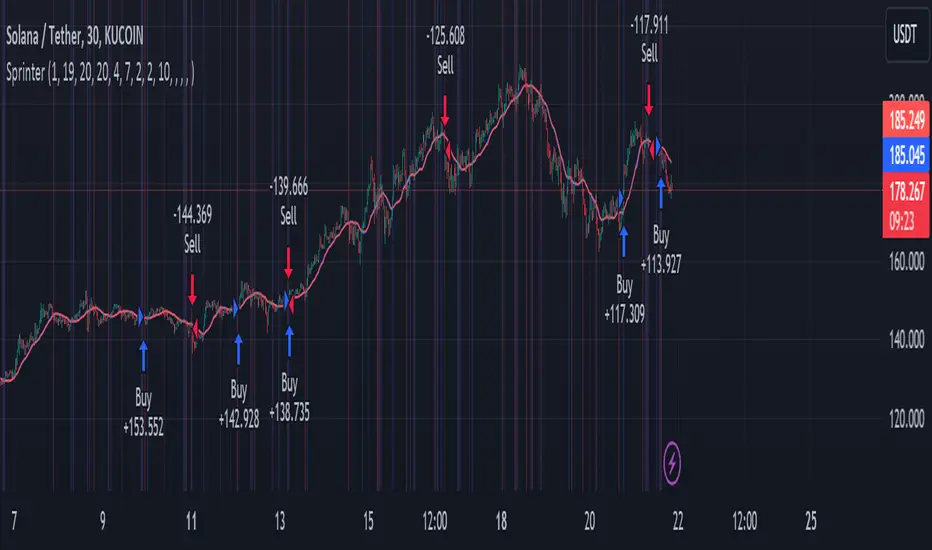
Self Optimizing ROC [Starbots]Self Optimizing Rate of Change (ROC) Strategy. (non-repainting)
Script constantly tests 15 different ROC parameter combinations for maximum profitability and trades based on the best performing combination.
You will notice that signal lines switch after a bar close sometimes, this is when the strategy optimizes to the better combination and change plots, strategy is dynamic.
---------------------------------------------------------------------------------------------------------
The Rate-of-Change (ROC) indicator, which is also referred to as Momentum, is a pure momentum oscillator that measures the percent change in price from one period to the next. The ROC calculation compares the current price with the price “n” periods ago. The plot forms an oscillator that fluctuates above and below the zero line as the rate of change moves from positive to negative. As a momentum oscillator, ROC signals include centerline crossovers, divergences, and overbought-oversold readings.
ROC = (Close - Close n periods ago) / (Close n periods ago) * 100
-----------------------------------------------------------------------------------------------------------
The logic of self - optimizing:
This script is always backtesting 15 different combinations of ROC settings in the background and saves the net. profit gained for every single one of them, then strategy selects and use the best performing combination of settings currently available for you to trade.
It's recalculating on every bar close - if one of the parameters starts performing better than others - have a higher net profit gain (it's literally like running 15 backtests with different settings in the background) strategy switches to that parameter and continues trading like that until one of the other indicator parameters starts performing better again and switches to that settings.
We are optimizing our strategy based on 15 different 'lengths' or also called 'periods' of ROC.
Inputs (ROC period) : (you don't need to change them, you have a nice wide variety of periods)
🔴Roc (default=9) = 5
🟢Roc2 = 6
🔵Roc3 = 7
🟡Roc4 = 8
🟣Roc5 = 9
🟠Roc6 = 10
🔴Roc7 = 11
🟢Roc8 = 12
🔵Roc9 = 13
🟡Roc10 = 14
🟣Roc11 = 15
🟠Roc12 = 16
🟡Roc13 = 17
🟣Roc14 = 18
🟠Roc15 = 20
Backtester in the background works like this:
backtest ROC1 => save net. profit
backtest ROC2 => save net. profit ;
backtest ROC3 => save net. profit ;
..........
..........
backtest ROC15 => save net. profit ;
=>
It will backtest 15 different ROC parameters and save their profits.
Your strategy then trades based on the best performing (highest net.profit) ROC Setting currently available. It will check the calculations and backtest them on every new bar close - it's like running 15 strategies at time, and manually selecting the best performing one.
________________________________________________________________________
If you wish to use it as INDICATOR - turn on 'Recalculate after every tick' in Properties tab to have this script updating constantly and use it as a normal Indicator tool for manual trading.
-- Noise Filter - This will punish the tiny trades made by certain parameters and give more advantage to big average trades. It's basically normal fee calculation, it will deduct 0.xx % fee from every trade when optimizing. You usually want it to have the same number as your fees on exchange. Large number will choose big long swing trades, small number will prioritize small scalping trades.
-- Turn on ROC Combination Profits and spot the worst/best performing combination. You can change periods to get the best performance after checking this table stats.
-- Backtesting Range - backtest within your desired time window. Example: 'from 01 / 01 /2020 to 01 / 01 /2023'.
-- Optimizing range - you can decrease the amount of bars/data for optimizing script. This way you can keep it up to date to more recent market by selecting optimizing range to optimize it just from the recent 3-6months of data for example. Strategy before this selected range will normally trade (backtest) based on the first ROC period ( 'Roc(default=9)' Input) parameter in your menu if you have Optimizing Range turned on.
**** I recommend 'Optimizing Range' to be turned off, use max amount of available bars in your history for optimization script.
-- Strategy is trading on the bar close without repaint. You can trade Long-Sell or Long- Short. Alerts available, insert webhook messages.
-- Turn on Profit Calendar for better overview of how your strategy performs monthly/annualy
-- Recommended ROC periods: from 5 to 24.
-- Recommended Sources : close, hlc3, hlcc4
-- Recommended Chart Timeframe : 4h +
-- Notes window : add your custom comments here or save your webhook messages inside here
-- Trading Session: in a session, you have to specify the time range for every day. It will trade only within this window and close trades when it's out. Session from 9am to 5pm will look like that: 0900-1700 or 7am to 4:30pm 0700-1630. After the colon, you can specify days of the week for your trading session. 1234567 trading all days, 23456 – Monday to Friday ('1 is Sunday here'). 0000-0000:1234567 by default will trade every day nonstop. 00.00am to 00.00pm and 1234567 every day of the week for example - Cryptocurrencies.
This script is simple to use for any trader as it saves a lot of time for searching good parameters on your own. It's self-optimizing and adjusting to the markets on the go.

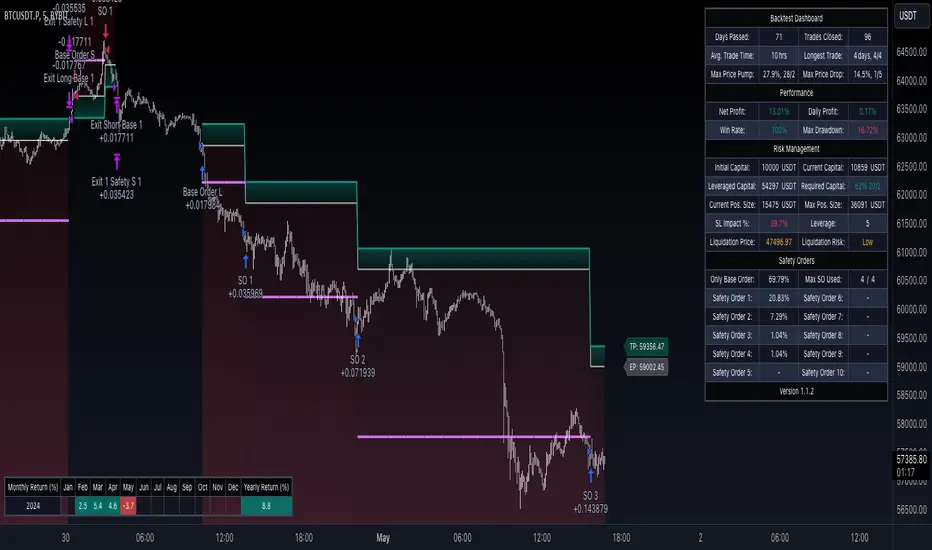
CryptoGraph Dynamic DCAA system to backtest and automate comprehensive trading strategies
═════════════════════════════════════════════════════════════════════════
🟣 Supporting Your Trades
CryptoGraph Dynamic DCA serves as a comprehensive tool on TradingView, designed to refine your approach to cryptocurrency trading. It utilises dynamic dollar-cost averaging (DCA), based on external indicator sources, to provide structured market entry and exit strategies. Suitable for both short-term trading and long-term portfolio management, CryptoGraph Dynamic DCA can offer a methodical way to support your trading decisions.
The tool offers an intuitive interface with inputs for strategy customisation, visualised preferences, and bot alert configurations. It can assist traders seeking precision, adaptability, and control in their trading activities. In the example on the chart above, we use the CryptoGraph Entry Builder (part of CryptoGraph Dynamic DCA package) as an external source for our initial entry (base order) and our safety orders, as well as an external source for our second take profit, which can be configured to be signal based.
🟣 Features
External Entry/Exit sources: The strategy is designed to assist with accurate market entries and exits by utilising signals from external indicators. It offers the flexibility to tailor your trading approach, providing an opportunity to leverage the analytical capabilities of various indicators available on TradingView.
Strategic Direction Control: Configure your strategy to go long, short, or both, adapting to market trends and your trading style.
Leverage Customisation: Tailor your leverage settings for isolated or cross margin to align with your risk tolerance, a liquidation estimation level is plotted on the chart, based on your input settings.
Diverse Entry Points: Utilise base orders and safety orders to diversify your entry points, reducing risk and enhancing potential returns.
Tailored Order Size: Fine-tune your order sizes using margin percentages or fixed contract sizes to fit your strategy’s requirements.
Profit Taking & Loss Prevention: Set take profit levels and stop losses with percentage or ATR-based parameters to secure profits and minimise losses. Options for moving the stop loss to entry after Take Profit 1, with an adjustable buffer, give you control over your risk management.
Max Safety Orders Count: Determine the maximum number of safety orders to manage risk effectively.
Price Deviation for DCA Orders: Specify the minimum price deviation percentage to trigger DCA orders, ensuring strategic order placement.
DCA Size Method: Choose from scaling or fixed-size DCA orders to align with your capital allocation strategy.
Visualisation & Alerts: Analyse your strategy’s performance with a backtest results table and configure bot alerts for automated trading. Auto configuration methods are integrated for multiple automated trading platforms.
🟣 Features Impression
🟣 Usage Guide
1. Strategy Configuration:
Select the appropriate cryptocurrency pair and exchange that corresponds to your trading preferences.
Choose your desired chart timeframe to align with your trading strategy’s temporal scope.
Ensure that you’re utilising the regular candle type for consistent and reliable data interpretation.
Pick an external entry source to trigger your trades based on predefined indicators or conditions.
Determine your take profit and stop loss levels to manage risks and secure earnings effectively.
Configure your DCA (Dollar-Cost Averaging) settings, including safety orders and the scaling method, to enhance entry points and manage investment distribution.
Always consult the tooltips next to each strategy input, to better understand their functions.
2. Backtest and Analysis:
Run backtests with your configured parameters to assess the strategy’s potential performance.
Review the backtest results and statistics tables to understand the strategy’s effectiveness, risk profile, and profitability.
3. Automated Trading Platform Integration:
Connect the strategy to a compatible automated trading platform to enable real-time execution of trades.
Within the trading platform, ensure the proper API setup of the bot’s configuration to align with the signals from the tool.
4. Alert Configuration in TradingView:
Set up the alert conditions in the TradingView tool to match your strategy triggers for entry, exit, take profit, and stop loss.
Configure the connection parameters within the tool to communicate effectively with your chosen automated trading platform
Activate the alerts, ensuring they are set to trigger actions such as order placement, adjustments, or closures as per your strategy’s logic.
5. Capital Management:
Confirm that your initial capital and order size are logically set, keeping in mind that the sum of all deals, especially when using pyramiding with safety orders, should not exceed your initial capital to avoid overexposure.
🟣 Trade Example
A clear example of a trade. Base order entry, safety order 1 fills, take profit 1 hits at 1%, the remainder of the position runs until the exit signal fires.
🟣 Warning
This tool has been developed to support your trading analysis, yet it’s important to acknowledge the inherent risks associated with trading. It is advisable to perform thorough research, assess your risk tolerance, and utilise this tool as one element of an overall trading strategy. Ensure that you only trade with capital that you are prepared to risk. In addition, due to the complexity of the tool, bugs may be found. Please alert us whenever you think you have found a bug in the system.
The Flash-Strategy with Minervini Stage Analysis QualifierThe Flash-Strategy (Momentum-RSI, EMA-crossover, ATR) with Minervini Stage Analysis Qualifier
Introduction
Welcome to a comprehensive guide on a cutting-edge trading strategy I've developed, designed for the modern trader seeking an edge in today's dynamic markets. This strategy, which I've honed through my years of experience in the trading arena, stands out for its unique blend of technical analysis and market intuition, tailored specifically for use on the TradingView platform.
As a trader with a deep passion for the financial markets, my journey began several years ago, driven by a relentless pursuit of a trading methodology that is both effective and adaptable. My background in trading spans various market conditions and asset classes, providing me with a rich tapestry of experiences from which to draw. This strategy is the culmination of that journey, embodying the lessons learned and insights gained along the way.
The cornerstone of this strategy lies in its ability to generate precise long signals in a Stage 2 uptrend and equally accurate short signals in a Stage 4 downtrend. This approach is rooted in the principles of trend following and momentum trading, harnessing the power of key indicators such as the Momentum-RSI, EMA Crossover, and Average True Range (ATR). What sets this strategy apart is its meticulous design, which allows it to adapt to the ever-changing market conditions, providing traders with a robust tool for navigating both bullish and bearish scenarios.
This strategy was born out of a desire to create a trading system that is not only highly effective in identifying potential trade setups but also straightforward enough to be implemented by traders of varying skill levels. It's a reflection of my belief that successful trading hinges on clarity, precision, and disciplined execution. Whether you are a seasoned trader or just beginning your journey, this guide aims to provide you with a comprehensive understanding of how to harness the full potential of this strategy in your trading endeavors.
In the following sections, we will delve deeper into the mechanics of the strategy, its implementation, and how to make the most out of its features. Join me as we explore the nuances of a strategy that is designed to elevate your trading to the next level.
Stage-Specific Signal Generation
A distinctive feature of this trading strategy is its focus on generating long signals exclusively during Stage 2 uptrends and short signals during Stage 4 downtrends. This approach is based on the widely recognized market cycle theory, which divides the market into four stages: Stage 1 (accumulation), Stage 2 (uptrend), Stage 3 (distribution), and Stage 4 (downtrend). By aligning the signal generation with these specific stages, the strategy aims to capitalize on the most dynamic and clear-cut market movements, thereby enhancing the potential for profitable trades.
1. Long Signals in Stage 2 Uptrends
• Characteristics of Stage 2: Stage 2 is characterized by a strong uptrend, where prices are consistently rising. This stage typically follows a period of accumulation (Stage 1) and is marked by increased investor interest and bullish sentiment in the market.
• Criteria for Long Signal Generation: Long signals are generated during this stage when the technical indicators align with the characteristics of a Stage 2 uptrend.
• Rationale for Stage-Specific Signals: By focusing on Stage 2 for long trades, the strategy seeks to enter positions during the phase of strong upward momentum, thus riding the wave of rising prices and investor optimism. This stage-specific approach minimizes exposure to less predictable market phases, like the consolidation in Stage 1 or the indecision in Stage 3.
2. Short Signals in Stage 4 Downtrends
• Characteristics of Stage 4: Stage 4 is identified by a pronounced downtrend, with declining prices indicating prevailing bearish sentiment. This stage typically follows the distribution phase (Stage 3) and is characterized by increasing selling pressure.
• Criteria for Short Signal Generation: Short signals are generated in this stage when the indicators reflect a strong bearish trend.
• Rationale for Stage-Specific Signals: Targeting Stage 4 for shorting capitalizes on the market's downward momentum. This tactic aligns with the natural market cycle, allowing traders to exploit the downward price movements effectively. By doing so, the strategy avoids the potential pitfalls of shorting during the early or late stages of the market cycle, where trends are less defined and more susceptible to reversals.
In conclusion, the strategy’s emphasis on stage-specific signal generation is a testament to its sophisticated understanding of market dynamics. By tailoring the long and short signals to Stages 2 and 4, respectively, it leverages the most compelling phases of the market cycle, offering traders a clear and structured approach to aligning their trades with dominant market trends.
Strategy Overview
At the heart of this trading strategy is a philosophy centered around capturing market momentum and trend efficiency. The core objective is to identify and capitalize on clear uptrends and downtrends, thereby allowing traders to position themselves in sync with the market's prevailing direction. This approach is grounded in the belief that aligning trades with these dominant market forces can lead to more consistent and profitable outcomes.
The strategy is built on three foundational components, each playing a critical role in the decision-making process:
1. Momentum-RSI (Relative Strength Index): The Momentum-RSI is a pivotal element of this strategy. It's an enhanced version of the traditional RSI, fine-tuned to better capture the strength and velocity of market trends. By measuring the speed and change of price movements, the Momentum-RSI provides invaluable insights into whether a market is potentially overbought or oversold, suggesting possible entry and exit points. This indicator is especially effective in filtering out noise and focusing on substantial market moves.
2. EMA (Exponential Moving Average) Crossover: The EMA Crossover is a crucial component for trend identification. This strategy employs two EMAs with different timeframes to determine the market trend. When the shorter-term EMA crosses above the longer-term EMA, it signals an emerging uptrend, suggesting a potential long entry. Conversely, a crossover below indicates a possible downtrend, hinting at a short entry opportunity. This simple yet powerful tool is key in confirming trend directions and timing market entries.
3. ATR (Average True Range): The ATR is instrumental in assessing market volatility. This indicator helps in understanding the average range of price movements over a given period, thus providing a sense of how much a market might move on a typical day. In this strategy, the ATR is used to adjust stop-loss levels and to gauge the potential risk and reward of trades. It allows for more informed decisions by aligning trade management techniques with the current volatility conditions.
The synergy of these three components – the Momentum-RSI, EMA Crossover, and ATR – creates a robust framework for this trading strategy. By combining momentum analysis, trend identification, and volatility assessment, the strategy offers a comprehensive approach to navigating the markets. Whether it's capturing a strong trend in its early stages or identifying a potential reversal, this strategy aims to provide traders with the tools and insights needed to make well-informed, strategically sound trading decisions.
Detailed Component Analysis
The efficacy of this trading strategy hinges on the synergistic functioning of its three key components: the Momentum-RSI, EMA Crossover, and Average True Range (ATR). Each component brings a unique perspective to the strategy, contributing to a well-rounded approach to market analysis.
1. Momentum-RSI (Relative Strength Index)
• Definition and Function: The Momentum-RSI is a modified version of the classic Relative Strength Index. While the traditional RSI measures the velocity and magnitude of directional price movements, the Momentum-RSI amplifies aspects that reflect trend strength and momentum.
• Significance in Identifying Trend Strength: This indicator excels in identifying the strength behind a market's move. A high Momentum-RSI value typically indicates strong bullish momentum, suggesting the potential continuation of an uptrend. Conversely, a low Momentum-RSI value signals strong bearish momentum, possibly indicative of an ongoing downtrend.
• Application in Strategy: In this strategy, the Momentum-RSI is used to gauge the underlying strength of market trends. It helps in filtering out minor fluctuations and focusing on significant movements, providing a clearer picture of the market's true momentum.
2. EMA (Exponential Moving Average) Crossover
• Definition and Function: The EMA Crossover component utilizes two exponential moving averages of different timeframes. Unlike simple moving averages, EMAs give more weight to recent prices, making them more responsive to new information.
• Contribution to Market Direction: The interaction between the short-term and long-term EMAs is key to determining market direction. A crossover of the shorter EMA above the longer EMA is an indicator of an emerging uptrend, while a crossover below signals a developing downtrend.
• Application in Strategy: The EMA Crossover serves as a trend confirmation tool. It provides a clear, visual representation of the market's direction, aiding in the decision-making process for entering long or short positions. This component ensures that trades are aligned with the prevailing market trend, a crucial factor for the success of the strategy.
3. ATR (Average True Range)
• Definition and Function: The ATR is an indicator that measures market volatility by calculating the average range between the high and low prices over a specified period.
• Role in Assessing Market Volatility: The ATR provides insights into the typical market movement within a given timeframe, offering a measure of the market's volatility. Higher ATR values indicate increased volatility, while lower values suggest a calmer market environment.
• Application in Strategy: Within this strategy, the ATR is instrumental in tailoring risk management techniques, particularly in setting stop-loss levels. By accounting for the market's volatility, the ATR ensures that stop-loss orders are placed at levels that are neither too tight (risking premature exits) nor too loose (exposing to excessive risk).
In summary, the combination of Momentum-RSI, EMA Crossover, and ATR in this trading strategy provides a comprehensive toolkit for market analysis. The Momentum-RSI identifies the strength of market trends, the EMA Crossover confirms the market direction, and the ATR guides in risk management by assessing volatility. Together, these components form the backbone of a strategy designed to navigate the complexities of the financial markets effectively.
1. Signal Generation Process
• Combining Indicators: The strategy operates by synthesizing signals from the Momentum-RSI, EMA Crossover, and ATR indicators. Each indicator serves a specific purpose: the Momentum-RSI gauges trend momentum, the EMA Crossover identifies the trend direction, and the ATR assesses the market’s volatility.
• Criteria for Signal Validation: For a signal to be considered valid, it must meet specific criteria set by each of the three indicators. This multi-layered approach ensures that signals are not only based on one aspect of market behavior but are a result of a comprehensive analysis.
2. Conditions for Long Positions
• Uptrend Confirmation: A long position signal is generated when the shorter-term EMA crosses above the longer-term EMA, indicating an uptrend.
• Momentum-RSI Alignment: Alongside the EMA crossover, the Momentum-RSI should indicate strong bullish momentum. This is typically represented by the Momentum-RSI being at a high level, confirming the strength of the uptrend.
• ATR Consideration: The ATR is used to fine-tune the entry point and set an appropriate stop-loss level. In a low volatility scenario, as indicated by the ATR, the stop-loss can be set tighter, closer to the entry point.
3. Conditions for Short Positions
• Downtrend Confirmation: Conversely, a short position signal is indicated when the shorter-term EMA crosses below the longer-term EMA, signaling a downtrend.
• Momentum-RSI Confirmation: The Momentum-RSI should reflect strong bearish momentum, usually seen when the Momentum-RSI is at a low level. This confirms the bearish strength of the market.
• ATR Application: The ATR again plays a role in determining the stop-loss level for the short position. Higher volatility, as indicated by a higher ATR, would warrant a wider stop-loss to accommodate larger market swings.
By adhering to these mechanics, the strategy aims to ensure that each trade is entered with a high probability of success, aligning with the market’s current momentum and trend. The integration of these indicators allows for a holistic market analysis, providing traders with clear and actionable signals for both entering and exiting trades.
Customizable Parameters in the Strategy
Flexibility and adaptability are key features of this trading strategy, achieved through a range of customizable parameters. These parameters allow traders to tailor the strategy to their individual trading style, risk tolerance, and specific market conditions. By adjusting these parameters, users can fine-tune the strategy to optimize its performance and align it with their unique trading objectives. Below are the primary parameters that can be customized within the strategy:
1. Momentum-RSI Settings
• Period: The lookback period for the Momentum-RSI can be adjusted. A shorter period makes the indicator more sensitive to recent price changes, while a longer period smoothens the RSI line, offering a broader view of the momentum.
• Overbought/Oversold Thresholds: Users can set their own overbought and oversold levels, which can help in identifying extreme market conditions more precisely according to their trading approach.
2. EMA Crossover Settings
• Timeframes for EMAs: The strategy uses two EMAs with different timeframes. Traders can modify these timeframes, choosing shorter periods for a more responsive approach or longer periods for a more conservative one.
• Source Data: The choice of price data (close, open, high, low) used in calculating the EMAs can be varied depending on the trader’s preference.
3. ATR Settings
• Lookback Period: Adjusting the lookback period for the ATR impacts how the indicator measures volatility. A longer period may provide a more stable but less responsive measure, while a shorter period offers quicker but potentially more erratic readings.
• Multiplier for Stop-Loss Calculation: This parameter allows traders to set how aggressively or conservatively they want their stop-loss to be in relation to the ATR value.
Here are the standard settings:

[Opening Range Breakout] S&R Strategy with Backtest (TSO) S&R Strategy with Backtest (TSO)
===========================================================================
===========================================================================
This indicator serves as a comprehensive full-cycle trading system, providing alerts at each stage of the trade, from opening to closure. The algorithm initiates by calculating the Opening/Pre-Market Price Range, waiting for a breakout to generate signals, and establishing TP (Take Profit and SL (Stop Loss) levels. The Opening/Pre-Market range, known for its robust support and resistance levels, is a key element. To filter out false breakouts and capture valid ones, the indicator incorporates a Smart Breakout feature, requiring confirmation through an initial breakout, a confirmation bounce, and a subsequent confirmation breakout. The indicator offers a variety of automated approaches for TP (Take-Profit) and SL (Stop-Loss) settings. These include leveraging opening range levels, both the most recent and historical S&R (Support and Resistance) levels, and an ATR (Average True Range) trailing stop-loss. This diverse set of tools ensure flexibility in tailoring TP (Take-Profit) and SL (Stop-Loss) parameters to different market conditions, contributing to a more adaptive and robust trading system. Additionally, a series of signal analysis tools, including candle bar analysis, divergence, and volume, enhance the precision of trading signals.
* Works with popular timeframes: 1M, 3M, 5M, 15M, 30M, 45M, 1H.
* Works best with Indices, Stocks, and Commodities, since there is pre-market price movement, which is used to obtain support and resistance price range.
* Every action of the trade is calculated on a confirmed closed candle bar state (barstate.isconfirmed), so the indicator will never repaint.
==============================================================
Indicator visual examples with various instruments:
---------------------------------------------------------------------------
Strategy Config: ORB_AAPL(NASDAQ)_15M
Example of Signal Cleanup confirmations via SMA and ATR. Take-Profit is calculated per optimal S&R (resistance) most recent levels.
---------------------------------------------------------------------------
Strategy Config: ORB_AMD(NASDAQ)_5M
Example of optimal S&R (resistance) level from previous day for Take-Profit 1 target, which gets hit.
---------------------------------------------------------------------------
Strategy Config: ORB_META(NASDAQ)_5M
Example of dynamic SL (Stop-Loss), which reduces the risk by moving to the new support level, which is at the same time is below the current price. Also Signal Cleanup confirmations via SMA, ATR and VWAP
---------------------------------------------------------------------------
Strategy Config: ORB_MSFT(NASDAQ)_15M
Example of automated ATR Trail Stop-Loss activation at no optimal S&R (support) feature.
---------------------------------------------------------------------------
Strategy Config: ORB_NFLX(NASDAQ)_3M
Example of a skipped LONG trade due to no optimal S&R (support) for Stop-Loss (can be seen per chart that it would be a loss trade). On another side, a SHORT SMA Confirmed trade hits all 3 profit targets.
---------------------------------------------------------------------------
Strategy Config: ORB_NVDA(NASDAQ)_15M
Example of no optimal support for SHORT Take-Profit targets, with ATR Trail Stop-Loss.
---------------------------------------------------------------------------
Strategy Config: ORB_SPY(AMEX)_15M
Example of several signal confirmations at the same time (SMA, VWAP, EWO) and S&R-TP-Entry-SL SL (Stop-Loss) system, which at trade open sets SL (Stop-Loss) per optimal S&R (since this is a LONG trade - support) and then moves to Entry at first take-profit.
===========================================================================
Trading open/close/TP/SL labels, plots and colors explanations:
---------------------------------------------------------------------------
>>> Opening/Pre-Market range: White dashed lines show opening range/pre-market levels with dotted white line extend along the Trading Schedule (if Trading Schedule is turned off - it will extend until next day).
>>> Smart Breakout: 1) Initial Breakout: "init_Brekout" | 2) Confirmation Bounce: "conf_Bounce" | 3) Confirmation Breakout: "conf_Breakout" (additional lables on chart can be hidden with only Confirmation Breakout shown).
>>> Additional S&R (Support and Resistance) lines: yellow - support, blue - resistance (can be hidden).
>>>>> LONG open: green "house" looking arrow below candle bar.
>>>>> SHORT open: red "house" looking arrow above candle bar.
>>>>> LONG/SHORT take-profit target: green/red circles (multi-profit > TP2/3/4/5 smaller circles).
>>>>> LONG/SHORT stop-loss target: green/red + crosses.
>>>>> LONG/SHORT take-profit hits: green/red diamonds.
>>>>> LONG/SHORT stop-loss hits: green/red X-crosses.
>>>>> LONG/SHORT EOD (End of Day | Intraday style) close (profitable trade): green/red squares.
>>>>> LONG/SHORT EOD (End of Day | Intraday style) close (loss trade): green/red PLUS(+)-crosses.
===========================================================================
STATS TABLE ///////////////////////////////////////////////////////////////
---------------------------------------------------------------------------
>>> Trading STATS table on the chart showing current trade direction, Last TP (Take-Profit) Taken, Current Trade PL (profit/loss in price difference from trade open to the very current state).
---------------------------------------------------------------------------
CUSTOM TRADING DATE RANGE /////////////////////////////////////////////////
---------------------------------------------------------------------------
>>>>> This feature can be used to manually set indicator trading range from and to a specific date and time. NOTE: This is not intended for a very long date range backtesting, utilize TradingView Strategy Tester for that.
* Use TradingView “Strategy Tester” to see Backtesting results
NOTE: If Strategy Tester does not show any results with Date Ranged fully unchecked, there may be an issue where a script opens a trade, but there is not enough TradingView power to set the Take-Profit and Stop-Loss and somehow an open trade gets stuck and never closes, so there are “no trades present”. In such case - manually check “Start”/“End” dates or use “Deep Backtesting” feature!
---------------------------------------------------------------------------
INTRADAY/TRADING SCHEDULE | ET (EASTERN TIMEZONE) ////////////////////////
---------------------------------------------------------------------------
>>> Trading Schedule - On/Off: This is where an Intraday Session or any custom session can be turned on and then scheduled.
>>>>> Trading Schedule - Time: Trade open Signals/Alerts time zone Hours. | NOTE: US Market Active Hours: 09:30 - 16:00 ET / Power Hour: 15:00 - 16:00 ET)
>>> Trading Schedule - EOD(End of Day) Close - On/Off: Close trade if still open by certain hour (set below).
>>>>> Trading Schedule - EOD(End of Day) Close - Hour (ET): US trading session closes at 4PM ET > 16:00.
Here is when the trade will close with EOD(End of Day) Close/Trading Cut Off Hour set to 16, which is end of US trading session:
1/3/5min > will close at 15:55pm ET
15min > will close at 15:45pm ET
30min > will close at 15:30pm ET
45min > will close at 15:45pm ET
60min > will close at 16:00pm ET
Here is when the trade will close with EOD(End of Day) Close/Trading Cut Off Hour set to 15, which is 1 hour before the end of US trading session (right before power hour starts):
1/3/5min > will close at 14:55pm ET
15min > will close at 14:45pm ET
30min > will close at 14:30pm ET
45min > will close at 14:45pm ET
60min > will close at 15:00pm ET
---------------------------------------------------------------------------
TRADE SIGNAL CONFIGURATION ////////////////////////////////////////////////
---------------------------------------------------------------------------
>>> Opening Range - Time Period (ET): Opening/Pre-Market Range time, which by default is set to US Session Pre-Market Range, can be customized to any time range as there are different market hours around the world and this setting can be customized to any time. Pre-Market Time/Price Range Hours(ET) | Pre-Market EU/Asia Hours: 4:00-9:30 ET | Pre-Market US (NY) Hours: 7:00-9:30 ET | Post-Market US Hours: 16:00-19:00 ET | First US Market Hour: 9:30-10:30 ET | Power Hour: 15:00-16:00)
>>> Opening Range - Levels Structure: determines how the price range is calculated, based on the highest/lowest price zones or based on the candle body bar.
>>> Opening Range - Breakout System: "Simple": bar close price has to simply break the opening range level | "Smart": After initial breakout (which is basically 'Simple' Breakout), a price come back is expected to the opening range level, a bounce, then a confirmation breakout with price closing ahead of the initial breakout.
>>>>> Opening Range - Smart Breakout: # of bars until Initial Breakout becomes invalid
>>>>> Opening Range - Smart Breakout: Bounce Settings, "Cross-Return" - LONG: Price has to cross down the initial breakout S&R, but never close below it; SHORT: Price has to cross up the initial breakout S&R, but then close above it; ||| "Cross-Close-Return" - LONG: At least 1 candle has to close below initial breakout S&R; SHORT: At least 1 candle has to close above initial breakout S&R.
>>>>> Alerts - Opening Range - Smart Breakout: Confirmation Bounce Alert. Trigger an alert at confirmation bounce. This is for live trading (especially scalping) Smart Breakout approach - to get ready to open the trade in the correct direction.
---------------------------------------------------------------------------
TAKE-PROFIT/STOP-LOSS CONFIGURATION ///////////////////////////////////////
---------------------------------------------------------------------------
>>> TP (Take-Profit) and SL (Stop-Loss): S&R Search - Left Bars: This setting is for calculating optimal S&R (Support and Resistance) levels (in combination with below - Right Bars) for S&R (Support and Resistance) TP (Take-Profit) levels calculations. NOTE: if at any point - there will be no available S&R (Support & Resistance) found for SL (Stop-Loss, 'S&R-Dynamic-SL' or 'S&R-Static-SL' setting, since both settings search for optimal SL (Stop-Loss) at trade open) or TP (Take-Profit, at any setting, since at trade open, an optimal TP (Take-Profit) level is searched) > SL (Stop-Loss) will automatically switch to trailing ATR-Trailing-SL and the trade will continue to run until it either hits ATR-Trailing-SL (Stop-Loss) or closes at EOD (End of Day).
>>> TP (Take-Profit) and SL (Stop-Loss): S&R Search - Right Bars: This setting is for calculating optimal S&R (Support and Resistance) levels (in combination with above - Left Bars) for S&R (Support and Resistance) TP (Take-Profit) levels calculations. NOTE: if at any point - there will be no available S&R (Support & Resistance) found for SL (Stop-Loss, 'S&R-Dynamic-SL' or 'S&R-Static-SL' setting, since both settings search for optimal SL (Stop-Loss) at trade open) or TP (Take-Profit, at any setting, since at trade open, an optimal TP (Take-Profit) level is searched) > SL (Stop-Loss) will automatically switch to trailing ATR-Trailing-SL and the trade will continue to run until it either hits ATR-Trailing-SL (Stop-Loss) or closes at EOD (End of Day).
>>> TP (Take-Profit) and SL (Stop-Loss): S&R Search - Custom Resolution: This is a custom timeframe setting specifically for S&R Search, it disregards current chart timeframe. This is great to use for scalping, for example: with main chart set to 1min and the custom timeframe set to 3min or 5min - there will be stronger support/resistance levels with more detailed price action.
>>> TP (Take-Profit) and SL (Stop-Loss): # of Bars (5000 max) to search back for optimal Support and Resistance levels: This is how many candles will be searched backwards for previous S&Rs (Support and Resistance) to find the optimal levels for TP (Take-Profit) and SL (Stop-Loss). NOTE: If SL (Stop-Loss) System is set to 'ATR-Trailing-SL' - this setting is only relevant for searching TP (Take-Profit) levels.
>>> TP (Take-Profit) and SL (Stop-Loss): At Trade Open - No S&R (Support and Resistance) found behavior: 'Skip Trade': If at trade open there are no S&R (Support and Resistance) levels for TP1 (Take-Profit 1) or SL (Stop-Loss) - trade is skipped. 'Open/ATR-Trailing-SL': If at trade open there are no S&R (Support and Resistance) levels for TP1 (Take-Profit 1) or SL (Stop-Loss), the trade will still be open with SL (Stop-Loss) set to 'ATR-Trailing-SL'.
>>> TP (Take-Profit) System: Pre-Market-Range-TP: All TP (Take-Profit) targets are calculated at trade open using the distance between Support and Resistance per Opening Pre-market Range and then divided by TP (Take-Profit) Divider, which can be set below; S&R-Current-Optimal-TP1: TP1 (Take-Profit) level is set per currently available S&R (Support & Resistance), if none available - historical S&R (Support & Resistance) levels will be searched, remaining TP (Take-Profit) targets (if selected, up to 5 # of TPs) are searched through most recent closest historical S&R (Support & Resistance) levels; S&R-Historic-Optimal-TP1: TP1 (Take-Profit) level is set per historically most recent closest available S&R (Support & Resistance) to the Entry price, remaining TP (Take-Profit) targets (if selected, up to 5 # of TPs) are searched through historical S&R (Support & Resistance) levels as well.
>>> TP (Take-Profit, Pre-Market-Range-TP) Divider #: This is for 'Pre-Market-Range-TP' setting only, where TP (Take-Profit) level is the distance between top/bottom levels of the opening range. It can be reduced by the divider #. (1 - full distance; 2 - 1/2 distance; 3 - 1/3 distance; etc.
>>> TP (Take-Profit) # of targets: It is wise to divide the trade into several profit targets. With this setting - up to 5 TP (Take-Profit) targets can be approached. The trade will be equally divided up by the selected # of TP (Take-Profit) targets.
>>> TP (Take-Profit) target(s) Consumed: Signal Bar consuming Take-Profits - trade signal bar is big enough to 'consume'/close ahead of the first TP setting > the signal can either be skipped, or all Take-Profit targets pushed ahead by average bar size).
>>> TP (Take-Profit) Offset - On/Off: This is a feature where TP (Take-Profit) target will be considered taken even if the price never crosses the target(s), but comes close enough (based on the offset amount). Set the offset amount below.
>>>>> TP (Take-Profit) Offset - Amount: Some Examples: (for SPY 0.1 would be $0.10 offset - if TP1 is $400 and price hits $399.90 > TP1 considered taken/signal shown/alert) | NOTE: For EURUSD, it is very different and if wrong will show TP1 immediately at trade open, typical good offset for EURUSD is: 0.0005 | Similar for BTCUSD, for example: 10 - $10 offset, if TP is $15,000 > $14,990.
>>> SL (Stop-Loss) System: 'Pre-Market-Range-SL': SL (Stop-Loss) is set to the opposite market range level from trade direction; 'S&R-Static-SL': SL (Stop-Loss) is set at trade open per optimal most recent S&R level and remains there until trade closes; 'S&R-Dynamic-SL': SL (Stop-Loss) is set at a trade open per optimal S&R (Support and Resistance) level from the most recent AND historical S&Rs (Support and Resistance), with every bar closed it will check if there are new S&Rs (Support and Resistance) levels, if these levels appear closer to the current price then current level - it will move SL (Stop-Loss) to that level, therefore reducing the risk; 'ATR-Trailing-SL': SL (Stop-Loss) is trail-following the ATR (Average True Range) line, NOTE: If at signal trigger, ATR will be against the trade direction - trade open signal will be skipped; 'S&R-TP-Entry-SL': SL (Stop-Loss) initially is set per S&R, then moves to Entry price at the very first TP (Take-Profit) hit and remains there until trade closes; 'S&R-TP-Trail-SL': SL (Stop-Loss) initially is set per S&R, then moves to Entry at TP1 (Take-Profit 1) hit, then keeps trailing per previously taken profit targets (TP2 taken, SL moves to TP1 | TP3 taken, SL moves to TP2 | TP4 taken, SL moves to TP3). NOTE: 'ATR-Trailing-SL' will not switch automatically if 'S&R-Dynamic-SL', S&R-TP-Entry-SL', 'S&R-TP-Trail-SL' system is selected, as already the most optimal SL (Stop-Loss) level is calculated - it will switch automatically only with 'S&R-Static-SL' system.
>>> SL (Stop-Loss) - On/Off: Without SL (Stop-Loss), unless EOD (End of Day) Close is turned on - there will be no SL (Stop-Loss) at all!
---------------------------------------------------------------------------
SIGNAL ANALYSIS AND CLEANUP ///////////////////////////////////////////////
---------------------------------------------------------------------------
>>> Signal Cleanup - Bar Color: Include Bar Color (bullish/bearish) confirmation, LONG signal will only be opened if signal bar is green/bullish, SHORT if red/bearish.
>>> Signal Cleanup - Bar Directional Structure: Skip opposite bar structure types signals (For example: bearish green hammer).
>>> Signal Cleanup - Bar Doji Skip: Skip doji (indecisive) candles signals.
>>> Signal Cleanup - EWO (Elliott Wave Oscillator): Include EWO (Elliott Wave Oscillator), LONG will only be opened if EWO is bullish / SHORT if EWO is bearish.
>>> Signal Cleanup - VWAP (Volume-Weighted Average Price): Include VWAP (Volume-Weighted Average Price), LONG will only be opened if price is above VWAP / SHORT if price is below VWAP.
>>> Signal Cleanup - MA (Moving Average) Confirmation: Include MA (Moving Average), LONG will only be opened if MA is bullish / SHORT if MA is bearish.
>>> Signal Cleanup - ATR (Average True Range): Include ATR (Average True Range) confirmation, LONG will only be opened if ATR is bullish / SHORT if ATR is bearish.
>>> Signal Cleanup - Divergence(RSI + MACD): Include Divergence (RSI + MACD ) confirmation, LONG will only be opened if Divergence is bullish / SHORT if Divergence is bearish.
>>> Signal Cleanup - Volume % Strength: Include Volume strength/percentage confirmation, LONG/SHORT will only be opened with strong Volume matching the signal direction | By default, strong Volume percentage is set to 150% and weak to 50%.
>>> Signal Cleanup - Volume Above Average: Include Volume Above Moving Average (Volume closing bar closes above volume moving average) confirmation, LONG/SHORT will only be opened with Volume above average - Volume closed bar color must match the closed price color (bullish/bearish direction) + Volume bar must be closed above volume MA line).
---------------------------------------------------------------------------
===========================================================================
||||||||||||||||||||||||||||||||||| *** ||||||||||||||||||||||||||||||||||| *** |||||||||||||||||||||||||||||||||||
||||||||||||||||||||||||||||||||||| *** ||||||||||||||||||||||||||||||||||| *** |||||||||||||||||||||||||||||||||||
TP System - VERY IMPORTANT INFO!
-------------------------------------------------------------------------------------------------------------------
"TP PERCENTAGE" - amount by which current trade/position needs to be reduced/partially closed/sold.
-------------------------------------------------------------------------------------------------------------------
TP System: Dynamic
"TP PERCENTAGE" - will always be the same amount (trade/position size divided by the # of take-profit(TP) targets) and percentage to be closed will always be of the ORIGINAL trade/position.
-------------------------------------------------------------------------------------------------------------------
TP System: Static
"TP PERCENTAGE" - will always be the same amount IF take-profit(TP) targets are hit 1-by-1 (TP1 > TP2 > TP3 > TP4 > TP5), otherwise it will vary and unless it is a 1st take-profit(TP1), the REMAINING trade/position size will always be smaller than original and therefore the percentage to be closed will always be of the REMAINING trade/position and NOT the original one!
-------------------------------------------------------------------------------------------------------------------
"TP PERCENTAGE" CheatSheet (these are the only percentages you may see)
-----------------------------------------------------------------------
TP PERCENTAGE---Close/Sell Amount-------------Example (trade size: 50 stocks)
20%-------------trade size * 0.2--------------50 * 0.2 = 10 stocks
25%-------------trade size * 0.25-------------50 * 0.25 = 12.5(~13) stocks
34%-------------trade size * 0.34-------------50 * 0.34 = 17 stocks
40%-------------trade size * 0.4--------------50 * 0.4 = 20 stocks
50%-------------trade size * 0.5--------------50 * 0.5 = 25 stocks
60%-------------trade size * 0.6--------------50 * 0.6 = 30 stocks
66%-------------trade size * 0.66-------------50 * 0.66 = 33 stocks
75%-------------trade size * 0.75-------------50 * 0.75 = 37.5(~38) stocks
80%-------------trade size * 0.8--------------50 * 0.8 = 40 stocks
100%------------trade size--------------------50 = 50 stocks
-----------------------------------------------------------------------
If for any reason a portion of the current/remaining trade closed at such occurrence was slightly wrong, it is not an issue. Such occurrences are rare and with slight difference in partial TP closed is not significant to overall performance of our algorithms.
||||||||||||||||||||||||||||||||||| *** ||||||||||||||||||||||||||||||||||| *** |||||||||||||||||||||||||||||||||||
||||||||||||||||||||||||||||||||||| *** ||||||||||||||||||||||||||||||||||| *** |||||||||||||||||||||||||||||||||||
===========================================================================
Alert Settings (you don’t have to touch this section unless you will be using TradingView alerts through a Webhook to use with trading bot)
---------------------------------------------------------------------------
Here is how a LONG OPEN alert looks like.
NOTE: Each label , , etc. is customizable, you can change the text of it within indicator Input settings.
ALERT >>>>>>>>>>>>>>>>>>>>>>>>>>>>>>>>>>>>>>>>>>>>>>>
COIN: BTCUSD
TIMEFRAME: 15M
LONG: OPEN
ENTRY: 20000
TP1: 20500
TP2: 21000
TP3: 21500
TP4: 22500
TP5: 23500
SL: 19000
Leverage: 0
---------------------------------------------------------------------------
Here is how a TP1 alert will look with 5 TPs breakdown of the trade.
NOTE1: Next to TP1 taken it will show at which price it was triggered.
NOTE2: Next to "TP Percentage" it shows how much of the CURRENT/ACTIVE/REMAINING trade needs to be closed.
NOTE2: If TP2/3/4/5 comes before TP1 - the alert will tell you exactly how many percent of the trade needs to be closed!
ALERT >>>>>>>>>>>>>>>>>>>>>>>>>>>>>>>>>>>>>>>>>>>>>>>
COIN: BTCUSD
TIMEFRAME: 15M
LONG: TP1
TP1: 20500
TP Percentage: 20%
---------------------------------------------------------------------------
Here is how an alert will look for LONG - STOP-LOSS.
ALERT >>>>>>>>>>>>>>>>>>>>>>>>>>>>>>>>>>>>>>>>>>>>>>>
COIN: BTCUSD
TIMEFRAME: 15M
ENTRY: 20000
LONG: SL
SL: 19000
---------------------------------------------------------------------------
Here is how an alert will look for LONG - EOD (End of Day) In Profit close.
ALERT >>>>>>>>>>>>>>>>>>>>>>>>>>>>>>>>>>>>>>>>>>>>>>>
COIN: BTCUSD
TIMEFRAME: 15M
LONG: EOD-Close (profit)
ENTRY: 20000
EOD-Close: 21900
===========================================================================
Adding Alerts in TradngView
---------------------------------------------------------------------------
-Add indicator to chart and make sure the correct strategy is configured (check Backtesting results)
-Right-click anywhere on the TradingView chart
-Click on Add alert
-Condition: Select this indicator by it’s name
-Immediately below, change it to "alert() function calls only", as other wise there will be 2 alerts for every alert!
-Expiration: Open-ended (that may require higher tier TradingView account, otherwise the alert will need to be occasionally re-triggered)
-Alert name: Whatever you desire
-Hit “Create”
-Note: If you change ANY Settings within the indicator – you must DELETE the current alert and create a new one per steps above, otherwise it will continue triggering alerts per old Settings!
===========================================================================
If you have any questions or issues with the indicator, please message me directly via TradingView.
---------------------------------------------------------------------------
Good Luck! (NOTE: Trading is very risky, past performance is not necessarily indicative of future results, so please trade responsibly!)
---------------------------------------------------------------------------
NOTE: There seems to be a strange glitch when strategy is running live, it will show "double-take" take-profits labels on the chart. This is not affecting the script logic and backtesting results, if you simply change the timeframe real quick to something else then back - it will no longer show the duplicate orders... this must be some sort of a glitch as every alert was thoroughly tested to make sure everything is working!

LuxAlgo - Backtester (OSC)The OSC Backtester is an innovative strategy script that allows users to create a wide variety of strategies using various unique oscillators.
By utilizing our 'Step' and 'Match' algorithms, users can create custom and complex strategy entries from each of the supported oscillators and included conditions, as well as any external sources, allowing users to create entries from a sequence of conditions and/or multiple matching conditions.
We included a complete alert system that will send a notification for each action taken by the strategy and we also allow users to set custom messages for each action taken by a strategy.
🔶 Features
🔹 Step & Match Algorithm
More complex entry rules can be created by using multiple conditions together, this is done thanks to the Step dropdown setting on the right of each condition.
The Step setting is directly related to the Step & Match algorithm and works in two ways:
When two or more conditions have the same step number, both conditions are evaluated. Used to test matching conditions.
When two or more conditions have different step numbers, each conditions will be evaluated in order, testing for the first step and switching to the next step once the previous one is true. When the final step is true the strategy will open a market order. Used to create sequence of conditions.
This operation is complementary, as you can create a sequence of conditions with one step consisting of two or more matching conditions as long as they have the same step number.
🔹 Fully Customizable Entries From Various Oscillators And Conditions
We allow the users to set entries using our unique HyperWave, Smart Money Flow, and their derived conditions as entries.
The Hyper Wave is a normalized adaptive oscillator aiming to reflect price trends without returning a high amount of noise.
The Smart Money Flow aims to detect trends based on market activity, by doing a comparative analysis between current volume and historical volume. A Smart Money Flow above 50 suggest market participants are bullish, else bearish. Derived from this oscillator we have Overflow indications, this indicator detects when market is overbought or oversold based on participants activity.
Other entries include proprietary reversal signals, real-time divergence detection, oscillator confluence (indicating how aligned each oscillator is), as well as entries using external sources.
🔹 Complete Alert System
Users can get alerted for any action executed by a strategy, from opening positions to closing them.
The message field in the Alert Messages setting section allows for the strategy to send a custom alert message depending on the action taken by the strategy, if no messages are set the strategy will send default messages.
🔶 Usage
Users can create a wide variety of strategies from this script, whether they are trend-following or contrarian traders.
Let's see a contrarian (revesal-based) strategy example using the following entry conditions:
Long: Hyperwave bullish divergence and oversold Hyperwave (lower than 20).
Short: Hyperwave bearish divergence and overbought Hyperwave (greater than 20).
We can also introduce take-profit and stop-loss exit conditions based on external indicators, allowing more control over exits in our strategy. For example:
Long: Hyperwave crossing over 50 while money flow is bearish.
Short: Hyperwave crossing under 50 while money flow is bullish.
Exit Long on a profit (long exit tp): Hyperwave crossing 80.
Exit Short on a profit (short exit tp): Hyperwave crossing 20.
While this strategy script can be used as a standalone, we recommend using other indicators creatively to assist with entries and exits as well as TP/SLs.
Our Step & Match algorithm can magnify interoperability, allowing for way more complete strategies through complex conditions, let's demonstrate this using the following entries:
Long: Any bullish reversal occurring after the price crosses over the lowest upper reversal zone of the Signals & Overlays™.
Short: Any bearish reversal occurring after the price crosses under the highest lower reversal zone of the Signals & Overlays™.
Long TP/SL: 5 ATR's away from the entry price.
Short TP/SL: 5 ATR's away from the entry price.
🔶 Strategy Properties (Important)
This script backtest is done on daily EURGBP, using the following backtesting properties:
Balance (default): 10 000 (default base currency)
Order Size: 10% of the equity
Comission: 3.4 pips (average spread for EURGBP)
Slippage: 3 tick
Stop Loss: 0.02 points away from entry price
We use these properties to ensure a realistic preview of the backtesting system, do note that default properties can be different for various reasons described below:
Order Size: 1 contract by default, this is to allow the strategy to run properly on most instruments such as futures.
Comission: Comission can vary depending on the market and instrument, there is no default value that might return realistic results.
We strongly recommend all users to ensure they adjust the Properties within the script settings to be in line with their accounts & trading platforms of choice to ensure results from the strategies built are realistic.
🔶 How To Access
You can see the Author's Instructions below to learn how to get access.

LuxAlgo - Backtester (PAC)The PAC Backtester is an innovative strategy script that allows users to create a wide variety of strategies derived from price action-related concepts for a data-driven approach to discretionary trading strategies.
Thanks to our 'Step' and 'Match' algorithm, users can create custom and complex strategy entries and exits from features such as market structure, order blocks, imbalances, as well as any external indicators, allowing users to create entries from a sequence of conditions and/or multiple matching conditions.
We included a complete alert system that will send a notification for each action taken by the strategy and we also allow users to set custom messages for each action taken by a strategy.
🔶 Features
🔹 Step & Match Algorithm
More complex entry rules can be created by using multiple conditions together, this is done thanks to the Step dropdown setting on the right of each condition.
The Step setting is directly related to the Step & Match algorithm and works in two ways:
When two or more conditions have the same step number, both conditions are evaluated. Used to test matching conditions.
When two or more conditions have different step numbers, each condition will be evaluated in order, testing for the first step and switching to the next step once the previous one is true. When the final step is true the strategy will open a market order. Used to create a sequence of conditions.
This operation is complementary, as you can create a sequence of conditions with one step consisting of two or more matching conditions as long as they have the same step number.
🔹 Fully Customizable Price Action Concepts As Entries
We allow the users to use market structures, order blocks, imbalances, and external sources together to set their custom entry and exit conditions.
Market structures are commonly used to determine trend direction by indicating when prices break prior swing points. Their occurrence can be used as entry conditions.
Order blocks highlight areas where institutional market participants open positions, one can use order blocks to determine confirmation entries or potential targets as we can expect there is a large amount of liquidity at these order blocks. Price entering, being within, or mitigating an order block can be used as an entry condition.
Market imbalances highlight areas where there is a disparity between supply and demand. Price entering, being within, or mitigating an imbalance can be used as an entry condition.
This system also allows the use of external sources to create entry and exit conditions, such as moving averages, bands, trailing stops...etc.
🔹 Complete Alert System
Users can get alerted for any action executed by a strategy, from opening positions to closing them.
The message field in the Alert Messages setting section allows for the strategy to send a custom alert message depending on the action taken by the strategy, if no messages are set the strategy will send default messages.
🔶 Usage
Users can create complete price action strategies from this script, let's see an example using the following entry conditions:
Long: Mitigated bearish order block occurring during the New York session after a mitigated bearish imbalance.
Short: Mitigated bullish order block occurring during the New York session after a mitigated bullish imbalance.
Take Profit: 2 points away from the entry price.
Stop Loss: 1 point away from the entry price.
We can also use features from Price Action Concepts™ to construct custom exit conditions, leading to the following strategy conditions:
Long: Bullish CHoCH and price mitigates bearish FVG.
Short: Bearish CHoCH and price mitigates bullish FVG.
Exit Long: Price mitigates bearish order block.
Exit Short: Price mitigates bullish order block.
Users can achieve a wide variety of results by using external indicators as an input source for entries and exits, combining the best from price action and technical indicators. We might for example be interested in exiting a position when the RSI oscillator is overbought or oversold.
🔶 Strategy Properties (Important)
This script backtest is done on daily EURGBP, using the following backtesting properties:
Balance (default): 10 000 (default base currency)
Order Size: 10% of the equity
Comission: 3.4 pips (average spread for EURGBP)
Slippage: 1 tick
Stop Loss: 0.01 points away from entry price
We use these properties to ensure a realistic preview of the backtesting system, do note that default properties can be different for various reasons described below:
Order Size: 1 contract by default, this is to allow the strategy to run properly on most instruments such as futures.
Comission: Comission can vary depending on the market and instrument, there is no default value that might return realistic results.
We strongly recommend all users to ensure they adjust the Properties within the script settings to be in line with their accounts & trading platforms of choice to ensure results from strategies built are realistic.
🔶 How to access
You can see the Author's Instructions below to learn how to get access.

Price Action Pattern Breakout Strategy: Wedge,Triangle,ChannelIntroducing the Price Action Pattern Breakout Strategy: Wedge,Triangle,Channel 💹🚀
The "Price Action Pattern Breakout Strategy: Wedge, Triangle, Channel" is a dynamic and automated trading strategy that excels in recognizing and capitalizing on breakout opportunities within the realm of powerful price action patterns. It is finely tuned to achieve exceptional precision in detecting three distinct pattern types: Wedge, Triangle, and Channel. This diversity equips you to confidently navigate a wide range of market scenarios and opportunities.
This strategy automates trade entries and exits upon confirmed pattern breakouts, this eliminates human errors in correctly recognizing patterns and prevents emotional decisions. This strategy is designed to work across different time frames, making it suitable for both short-term and long-term traders. Whether you're a day trader, swing trader, or investor, this strategy provides the flexibility you need to thrive in diverse market conditions.
💎 How it Works:
▶️ In this strategy, three price action patterns have been utilized, one of which is the "Wedge" pattern. The Wedge pattern has consistently demonstrated a high level of credibility, typically resulting in sharp and rapid price movements following a confirmed breakout from this pattern. This characteristic makes the Wedge pattern highly noteworthy in our strategy. The second pattern is the "Triangle" pattern, which, depending on its formation, whether ascending or descending, can indicate a strong continuation or reversal of the trend. The last pattern is the "Channel" pattern. The reason for using the Channel pattern is its versatility in various market conditions and its tendency to produce reliable results.
In the snapshot below, you can observe the types of patterns that this strategy is capable of identifying at a glance:
▶️ This strategy employs two types of targeting systems: Fixed Targets and Trailing Targets.
Fixed Targets is the default targeting system of the strategy, incorporating two primary targets: TP1 (Target Point 1) and TP2 (Target Point 2). These targets are thoughtfully adjusted in alignment with specific rules for each pattern. With Fixed Targets, you have the flexibility to designate the position size percentage for your exits at TP1 and TP2. For instance, should you opt to allocate 60% of your position size to TP1, as soon as the price triggers the first take profit level, 60% of your initial position is gracefully closed, leaving the remaining 40% to exit the trade upon reaching TP2.
Trailing Targets represent the strategy's alternative targeting system. With this system, the trailing stop becomes active once the price reaches the specified trigger point. The strategy then exits the trade based on the defined offset percentage and price retracement from the trailing limit.
▶️ This strategy relies on a single type of stop loss, determined by previous pivot points and adjusted based on the trade's direction, whether long or short, placing the stop loss above or below the prior pivot. This stop loss approach has demonstrated reliability when used alongside price action patterns.
In addition to this fixed stop loss, you can specify a percentage buffer, offering protection against potential stop hunting due to market fluctuations. This buffer helps protect your positions from sudden price swings. For example, selecting a 1% buffer means your stop loss will be positioned 1% higher or lower concerning the last pivot, depending on your trade's direction. This added layer of security ensures your trades remain resilient and less vulnerable to market volatility.
▶️ A practical feature of this strategy is the "Risk-Free" option. Once activated, it continuously monitors price movements, and as soon as the price progresses in the trade's direction and surpasses the designated Risk-Free Trigger Point in percentage, the stop loss is dynamically shifted from its initial position to the entry price, effectively making the trade "risk-free." This means that if the trade doesn't go as expected, we exit at the entry point, incurring neither profit nor loss from the trade.
Additionally, you have the flexibility to fine-tune the modified stop loss, positioning it slightly above or below the entry price through the configuration of a specified percentage. This allows for effective consideration of commission fees in your trading strategy.
▶️ Risk management is a crucial concept in trading, playing a significant role in a trader's long-term success. This strategy introduces a unique feature called "Fixed Loss Position Sizing", where upon activation, you can limit the risk exposure to a specified percentage of your capital per trade. Set your preferred risk percentage along with the intended leverage. The strategy independently considers your available capital and designated leverage, determining the position size before executing any trade.
In the case of a stop loss, your loss is limited to the specified risk percentage. For instance, with a $1000 account and a 1% risk set, the strategy adjusts each trade's size to ensure a maximum loss of $10 if the stop loss is triggered. Enabling this feature will ensure disciplined risk management, aligning potential losses precisely with your predetermined risk percentage, contingent upon your total available capital.
▶️ Another feature of this strategy is a sophisticated mechanism called "Loss Compensation". When enabled, Loss Compensation dynamically adjusts the position size after a loss, aiming to recover from previous losses in subsequent trades. This adaptive mechanism continually modifies the position size to mitigate the impact of consecutive losses until reaching a user-defined limit for consecutive loss compensations.
The feature's configurability allows users to set the maximum number of consecutive losses to compensate for and also includes an option to factor in trading fees from prior trades into the compensation calculation. Loss Compensation operates in conjunction with the 'Fixed Loss Position Sizing' setting, ensuring that once losses are sufficiently compensated, subsequent entries revert to the predefined configurations within the 'Fixed Loss Position Sizing' settings.
This advanced tool ensures a stable risk management approach by changing trade sizes dynamically according to past results during consecutive loss periods.
▶️ This strategy incorporates a feature known as the "Counter-Pattern Breakout", altering its approach to wedge, triangle, and channel pattern breakouts. Normally, the strategy relies on standard pattern signals to determine whether to enter long or short positions based on breakout directions.
For example, in an ascending channel or a rising wedge pattern, the strategy typically seeks a short position opportunity upon a confirmed breakout in the lower line, and breakouts from the upper line are disregarded by the strategy. But with this feature enabled, strategy disregards the conventional pattern signals, seizing breakouts from upper or lower lines to open corresponding positions. For instance, in the ascending channel or the rising wedge pattern example, the strategy might enter a long position if the upper line breaks or a short position if the lower line breaks.
This introduces a more adaptive and opportunistic trading style, allowing you to capitalize on price movements, irrespective of the typical signal direction indicated by the pattern.
▶️ This strategy is fully compatible with third-party trading bots, allowing for easy connectivity to popular trading platforms. By leveraging the TradingView webhook functionality, you can effortlessly link the strategy to your preferred bot and receive accurate signals for position entry and exit. The strategy provides all the necessary alert message fields, ensuring a smooth and user-friendly trading experience. With this integration, you can automate the execution of trades, saving time and effort while enjoying the benefits of this powerful strategy.
⚙️ How to Use & Configure User Settings:
To fully utilize the "Price Action Pattern Breakout Strategy: Wedge, Triangle, Channel," it's essential to consider and comprehend the following steps. They play a crucial role in enhancing its functionality and achieving its utmost potential outcomes:
1. General Strategy Settings:
Enable Dark Mode if using a dark TradingView theme for improved chart visibility.
Select the Strategy's Trade Direction: Long, Short, or Both.
Choose Pattern Recognition Accuracy: High for precise recognition but fewer positions, Low for more positions with slightly less accuracy.
Enable 'Prevent New Entry on Opposite Signal While In Position' to avoid new trades if the opposite signal occurs.
Switch to Indicator Mode if solely using the strategy as an indicator or in combination with other strategies.
2. Pattern and Pivot Configuration:
Consider configuring the Number of Patterns and Pivot Lookback Lengths. Here, you can personalize the pivot lookback lengths for wedge, triangle, and channel patterns across eight different settings on your chart. For lower time frames, consider larger lengths to reduce chart noise. Alternatively, to maintain clarity on your chart, you can disable multiple patterns with different lengths while ensuring at least one pattern remains enabled.
Note that enabling more patterns doesn't always equate to increased potential profit. Sometimes, fewer patterns result in greater profit potential, and vice versa. Experiment with lengths and the number of patterns to determine the most profitable and optimal outcome for your trading symbol and timeframe.
3. Targeting System Selection:
Choose between 'Fixed Targets' or 'Trailing Targets' for your targeting system.
'Fixed Targets' is the default setting, operational when 'Trailing Targets' are turned off.
Set the TP1 Position Size as a percentage, defining the size for TP1, and the rest exits at TP2.
Optionally activate 'Skip Entry if TP1 is Passed' to bypass entering positions if the price has exceeded TP1.
Alternatively, opt for the 'Trailing Target' for dynamic exits based on trigger points and offsets. Note that this option disables fixed targets.
4. Stop Loss Configuration:
Determine the number of candles to consider for stop loss placement based on the last pivot.
Optionally add a percentage to the stop loss to create a buffer against market fluctuations, guarding your positions from sudden price swings.
5. Risk Management Configuration:
You can activate the 'Risk-Free' feature, making your trades risk-free by moving the stop loss to the entry price upon reaching a specified trigger point.
You have the possibility to enable 'Fixed Loss Position Sizing' to limit risk to a percentage of total capital per trade, ensuring prudent risk management.
You can employ 'Use Real-Time Balance for Each Entry' to precisely calculate fixed loss position sizing according to the real-time balance for every entry.
The 'Loss Compensation' feature can be activated to automatically adjust trade sizes during consecutive losses and compensate for prior incurred losses.
Loss compensation continues adjusting trade sizes until it reaches the defined limit of consecutive losses specified in the 'Maximum Consecutive Losses To Compensate' field.
You can factor in commission fees by specifying a percentage in the 'Include Trading Fees in Compensation (%)' field, providing an option for more accurate loss compensation calculations.
You have the option to enable 'Limit Compensation to Real-Time Balance' to prevent consecutive loss compensation from exceeding your current real-time account balance.
It's important to note that for the 'Loss Compensation' feature to operate, the 'Fixed Loss Position Sizing' must be enabled.
6. Counter-Pattern Breakout Configuration:
In this section you have the option to enable the "Counter-Pattern Breakout" feature to adjust the strategy's approach to wedge, triangle, and channel pattern breakouts. Once enabled, the strategy disregards traditional pattern signals and capitalizes on breakouts from either the upper or lower lines, initiating corresponding positions accordingly.
Choose between 'Fixed Target' or 'Trailing Target' for your targeting system. If you opt for the 'Fixed Target', set a specific target point as a percentage, serving as the default target for counter-pattern breakouts. Alternatively, choose the 'Trailing Target' for dynamic exits based on trigger points and offsets. Do keep in mind that selecting the 'Trailing Target' option disables the fixed target setting.
Keep in mind that for standard, non-counter-pattern breakouts, the target point settings in their respective sections remain applicable, distinct from the settings configured for targeting within this section.
Note that the stop loss configurations are shared across standard pattern and counter-pattern breakouts and can be adjusted within the stop loss section.
7. Info Tables:
In the info tables section, you can show or hide different tables on the charts. This includes the backtest table, the current balance table displaying available funds, and a table showcasing Maximum Consecutive Wins or Losses. Choose which to display according to your preferences and specific needs.
8.Date & Time Range Filter:
Utilize the Date & Time Range filter feature to precisely select a start and end date, including time, to filter data within the chosen range.
When connecting this strategy to a trading bot for automated trades, ensure to set the start date and time to the intended initiation moment to avoid undesired outcomes as this directly affects the real-time balance calculations of the strategy.
8. Integration with Third-Party Bots:
To automate trading, leverage the strategy's compatibility with third-party trading bots. Seamlessly integrate the strategy into well-known trading platforms by using alert message fields to input commands from third-party trading bots, enabling automated trade execution for both long and short positions.
By furnishing these adjustable settings, the strategy empowers you to personalize it according to your unique requirements, thereby bolstering the adaptability and efficacy of your trading approach.
🔐 Source Code Protection:
The 'Price Action Pattern Breakout Strategy: Wedge, Triangle, Channel' source code is engineered for precision, reliability, and effectiveness. Its original and innovative design warrants protection and restricted access, preserving the strategy's exclusivity. Safeguarding the code maintains the strategy's integrity and distinctiveness, providing users with a competitive advantage in their trading endeavors.

Ironman [Decentrader]Ironman
What is it? how it does it? And how to use it:
i) Ironman is a multifaceted strategy builder, which uses coloured candles which represent certain customisable inputs being in confluence with one another and the set scenario.
ii) There are 7 customised technical indicators which can be input as a basis for the analytical review.
iii) Determine a primary indicator which dictates a bullish or bearish trend (and colour) and then optionally add up to 6 other indicators to be required to be in confluence which adds another colour to be represented.
An example might be two moving averages crossing as the main trend determination. The primary determinant is dictated as the trend being “bullish or bearish” and the added confluence adds an additional layer being “very bullish or very bearish”
iv) Users select which conditions they wish to enter and exit trades on using the Bullish / Very Bullish and Bearish / Very Bearish settings. This can be combined with other timeframes.
v) The selected inputs for each indicator will show in a table contained in the bottom right-hand corner. Active indicators within the system will be highlighted.
vi) Ironman is built to include various take profit and stop loss options such as trailing stops, and fixed percentage targets which can be included in the strategy. Different timeframes can be used to determine the stop if users wish to do so.
vii) Users can require that there is also confluence with a differing time period or choose long and short-only options which can be dictated independently or based upon filtering criteria using moving averages.
viii) Using the strategy settings, users are also able to choose backtesting periods.
ix) Position label settings allow users to show various backtesting options such as profit by position, total backtesting results and results for the active position.
x) Ironman enables users to automate trading easily using the input boxes under Alert messages which also allows connection to a third party which can conduct execution. Always make sure to thoroughly test the strategy if it is being automated.
xi) To get the best out of Ironman, build up a strategy for the timeframe and asset you are looking at and back-test outcomes as variables are layered in. Ensure to backtest over a suitable length of time.
xii) When optimising input variables, it can sometimes visually assist in having the underlying inputs on the screen via the standard indicators.
xiii) There are many boxes of information in the input variables, which explain how to use each part. Users can also add features such as a marker showing on the chart where all indicators are bullish/bearish, or where RSI is overbought / over sold.
xiv) Users can further customise the style of the tool under the style tab in the indicator settings.
Captain Backtest Model [TFO]Created by @imjesstwoone and @mickey1984, this trade model attempts to capture the expansion from the 10:00-14:00 EST 4h candle using just 3 simple steps. All of the information presented in this description has been outlined by its creators, all I did was translate it to Pine Script. All core settings of the trade model may be edited so that users can test several variations, however this description will cover its default, intended behavior using NQ 5m as an example.
Step 1 is to identify our Price Range. In this case, we are concerned with the highest high and the lowest low created from 6:00-10:00 EST.
Step 2 is to wait for either the high or low of said range to be taken out. Whichever side gets taken first determines the long/short bias for the remainder of the Trade Window (i.e. if price takes the range high, bias is long, and vice versa). Bias must be determined by 11:15 EST, otherwise no trades will be taken. This filter is intended to weed out "choppy" trading days.
Step 3 is to wait for a retracement and enter with a close through the previous candle's high (if long biased) or low (if short biased). There are a couple toggleable criteria that we use to define a retracement; one is checking for opposite close candles that indicate a pullback; another is checking if price took the previous candle's low (if long biased) or high (if short biased).
This trade model was initially tested for index futures, particularly ES and NQ, using a 5m chart, however this indicator allows us to backtest any symbol on any timeframe. Creators @imjesstwoone and @mickey1984 specified a 5 point stop loss on ES and a 25 point stop loss on NQ with their testing.
I've personally found some success in backtesting NQ 5m using a 25 point stop loss and 75 point profit target (3:1 R). Enabling the Use Fixed R:R parameter will ensure that these stops and targets are utilized, otherwise it will enter and hold the position until the close of the Trade Window.

Indian NIFTY Correlation Daytrade/Swing StrategyINTRODUCTION :
This is a daytrading/swing strategy designed mainly for indian market where internally has been adapted to NIFTY market and as well using for internal calculations the values of the candles from NIFTY asset.
With it we search to use with the most correlated asset from the indian market.
For this example I choosed BANKNIFTY
STRATEGY:
The strategy initially uses as candle values the data from the NIFTY asset.
With them I am dividing the work into two calculation parts such as :
-For first part logic, I am doing calculations regarding the volatility of NIFTY, where I initially take into consideration INDIAVIX to have an idea of the expected implied volatility of NIFTY asset and then I compare it with different tools such as ATR, BB and Percentile location of the volatility.
Based on all these factors I take into account the location of the volatility which is atm and if there is a possibility of a strong movement(trend) or sidemarket situation.
-Once I am done with the values of the volatility, the next process in the script logic is to start looking into the trend.
For it I am using different tools such as volume checker, support and resistence key points, pivot points, price actions patterns and different moving averages.
-Risk management part : once we are done with calculation for the entry, the next part is to have an idea where to exit. In this case I am making use of a dynamic risk management which is compressed from multiple ideas such as : we can exit if there were a big gap on the next day in our initial direction, we can also exit based of an internal daily ATR calculation value(we use initially 15min timeframe chart) and lastly if we are around some key points like support/resistence or other different chart patterns like double top, double bot and so on.
CASE EXAMPLE:
As I said before we are initially using for calculation the NIFTY chart with 15min timeframe. With it we can apply to any indian etf,stocks,future. All the assets are going to have the same time of entry and the same time of exit(we get this from NIFTY) and we plot it on the chart we are using, so its key point to look for assets which have a min 75-80% correlation with NIFTY. For this example I used BANKNIFTY chart.
So a type of entry would be this way
Lets assume NIFTY50 is on 19.000 level
INDIAVIX level is currently at 11 which can be translated : 11 / sqrt(250)
So 11 means that on a yearly base we expect the asset to move 11% upwards or downwards
and in a year we have aprox 250 days. So we divide the 11 by sqrt of 250 to get an idea of a daily expected move from the implied volatility of india VIX
11/15.87 = +-0.69%
So INDIAVIX tells us that the values for today nifty is 19000+0,69% and 19000-0.69%
After that I am looking into the daily ATR, and I see that the expected is around 0.8% and is ascending over the last 2 weeks.
Lastly I am looking at the percentile which is currently the volatility on both ATR and INDIAVIX, and I get a value of 90th percentile.
With this my biased is that we are going to expect a short trend, but i cant confirm on the volatility alone so next step is start looking into technical analysis.
I look at volume and is increasing, I look at different price actions paterns and pivots and I see a lower low and a lower high (a descending pattern).
I also see the price is below the key MA like SMA50/100/200, VWAP and so on.
With all of this I get more confirmation that the asset is in a short trend.
Internally once a certain specific % of confirmation from all the logics is achieved, it will trigger a long/short entry, so in this case lets assume we have 80% of our indicators pointing to the short, is going to enter a short.
Now for a long scenario the scene would be , indiavix is around 9,5, ATR is descending. We are around 40th percentile of the volatility.
Our asset is above multiple moving averages, vwap , etc
We have an increasing volume towards bullish side.
And so on( overall 75% of our indicators are pointing towards the long side)
Now for the exit, since we are dealing with a daytrade/swing mentality, short on average we keep the trade open for a less period of time than long ( 19 bars of 15min candles, compared to 57 bars of 15min for long) , so most of the times for short we are going to exit next day and if the trend is still in our favour we re enter the trade.
For long we can stay much more time, sometimes even weeks and we exit mainly when the % of confirmation of indicators point out a reversal/short confirmation fo a big pice action pattern.
STRATEGY RESULTS
For strategy analysis I have used BANKNIFTY NSE with deep history to get access to data from 2011 until present( giving more than 2500 trades) .
For inputs I am using 0.02% comission total ( the comission applied from ZERODHA indian exchange is close to 0.0175% total) so I used it a bit higher in order to take into account some slippages.
For capital THE REASON I USED 100% of the capital allocation is to make a proper comparison with the buy an hold from the same period
Lets assume we had an account of 1M ruppes initially in 2011, we start using 100% of it and then the new values automatically compounded with the new profits and losses so directly compare with 1M of rupees in shares on BANKNIFTY ETFs bought in 2011(buy n hold) until present day.
STRATEGY ACCESS
Strategy is free to be tested for everyone, just let me know in private that you wish to get access to it.

Engulfing with TrendThe script above is a trading strategy with rules based on the Engulfing candlestick pattern within the context of the trend. Some key elements of this script include:
1. ATR (Average True Range) settings to measure market volatility.
2. Supertrend settings to identify the market trend.
3. Conditions for determining uptrend and downtrend.
4. Determination of Bullish (Engulfing pattern during uptrend) and Bearish (Engulfing pattern during downtrend).
5. Calculation of Stop Loss (SL) and Take Profit (TP) levels based on the Engulfing pattern.
6. Entry conditions based on the Engulfing pattern and the corresponding trend.
7. Exit conditions based on price crossovers with SL and TP levels.
8. Plotting of the Engulfing patterns on the chart.
This strategy is used to identify trading opportunities based on Engulfing candlestick patterns that align with the direction of the market trend. Additionally, stop loss and take profit levels are calculated based on the Engulfing pattern, and trading signals are displayed on the chart.
It's important to note that this script can be customized according to your trading preferences and strategy.
