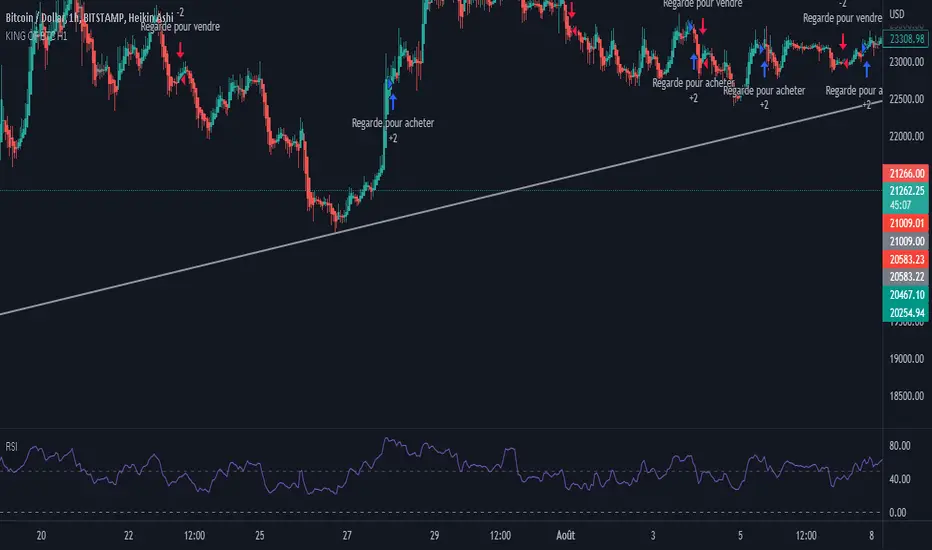
Ultimate Bitcoin StrategyThis is my masterpiece.
I recommend using it following strict rules:
Buy = Wait for the next green Heikein Ashi candle and RSI above 50
Sell: Wait for the next red Heikein Ashi candle and RSI below 50
Use it in H1
Enjoy.
Chart patterns
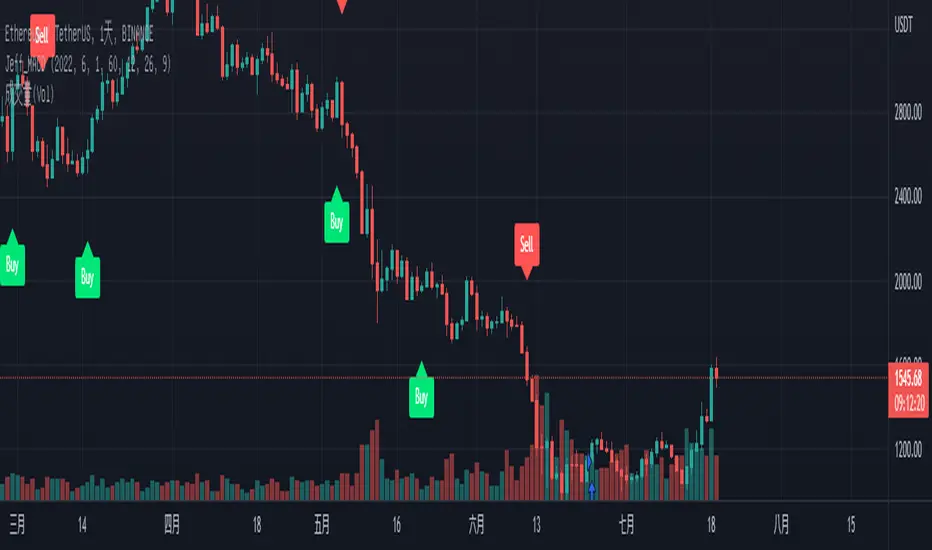
歐咪茄1號策略 ETH2此策略依照曲線不同包含了macd、 ADX 、RSI等作為數據綜合判斷 當然也包含成交量去做預判
不做止損為設定 將行情可能發生的誘多誘空行為規避達到更好的盈利
此策略針對ETH 30MIN為主 其他時框幣種不可以
Strategies include macd, ADX, RSI..., which are judged according to different curves as comprehensive data. Of course, it also includes trading volumes for forecasting.
Do not set stop loss to avoid possible long and short market behavior in the market to obtain better profits
This strategy is based on ETH 30MIN, other time frame currencies are not allowed

Mean reversal QFL v3My aim is to make the bots trade as you would trading QFL manually and “by the book” or at least to my experience and understanding from the material out there of how you should plan a QFL trade.
Im absolutely not a pro trader, I have made my share of costly mistakes trying to be clever or Beeing impatient resulting in painful losses. QFL is we’re I’ve had consistently good results tough.
Is this where I have to say I’m not a financial advisor and all that? Well I’m not. As always Do your own research and backtest, backtest, backtest.
First: I believe no bot strategy are set and forget, while they can run unattended 80-90% of the time you're always going to find yourself in a situation where you will have to manually handle a bad deal. It would also make sense to be somewhat involved in the really good trades making the most out of them. That’s why understanding the strategy the bot Is using is really important, hence why I prefer QFL. It's an easy concept to understand, and proved to be a safe way of making steady profit in pretty much all market conditions if done right.
Some changes in how aggressive you are might be needed if you are the impatient kind of trader who needs to see a lot of deals happening. But it is an added risk. In those cases Luc would advise to start “nibbling” but that would be hard to implement in a bot but I will see if that’s something I can implement.
Same goes for going the more conservative route when market conditions calls for it.
QFL stands for Quickfingersluc, and sometimes it is referred to as the Base Strategy or Mean Reversals. Its main idea is about identifying the moment of panic selling and buying below the base level and utilizing Safety orders.
Base level or Support Level refers to the lowest price level that was reached before the moment the price started increasing again. At that level, you can notice that buyers of some cryptocurrencies make a strong reaction.
As a bit of a learning material i want to make a few points on important factors in trading using the QFL strategy:
• Identify strong bases
• Read the history of the chart
• No emotions
Trading QFL using a bot has it’s limitations:
· Some of the bases are questionable but im constantly trying to improve this
· The strategy don’t take into consideration chart history(success rate)*
· You need to follow a predefined (by you) buying ladder, hence not considering a particular coin's average price movement, which may vary quite a lot. This why I for now has limited the strategy to SIMPLE bots. So that unique alerts can be created for each pair.
· A set Take profit %, possibly making you miss out on higher profits(This is easy to change during a trade though), and no chance of selling in layers(This is coming soon).
1. Some of the bases are questionable
The strategy will start trades of bases that you wouldn’t consider being a strong base(or a base at all) when looking at the chart.
For those not as familiar with QFL. What is a base, and what qualifies as a strong base?
• A base is also called the Support Level, which is the lowest price level that was reached before the price started turning and increasing again.
• A strong base is recognized by a steep fall in price after breaking the base(Panic), followed by a big reaction pump.
• The reaction pump is the most important factor to say that it is a strong base.
• And also the last base, the one you are trading of is the one that counts
Tip: Look for V shapes on the chart, easy to spot when zoomed out.
2. The integrated signals don’t take into consideration chart history(success rate)*
How can you assess the success rate by looking at the chart?
After finding the bases based on the criterias from the 1st point. Looking at the, how many times did it respect the base after breaking it? 7/10, 8/10, 9/10 times? Great! Chances of the next trade also respecting the base is big, and I would consider raising the TP on that deal. Any lower than that I would keep a really close eye on the deal, or even consider closing the deal. And again remember the last base is the one that counts. If all the others are nice strong bases but that last one you are about to take a trade off is no good the base is invalidated so be cautious.
3. You need to follow a predefined (by you) buying ladder
Crypto is volatile, and there is a huge variation in price movements on all the coins.
Trading manually, looking at the chart gives you a good idea on how much a coin on avg. drops below base, and how big the following reaction is. This gives you an indication on how deep you need to set your layers, and where you can take profit.
Using the strategy you have the backtester to see how much max deviation has been in the past so that you can figure out what the optimal max deviation is.
4. A set Take profit %, possibly making you miss out on higher profits(This is easy to change during a trade though), and no chance of selling in layers.
Not going to say to much about this other than what I often do is:
When a bot has started a trade I usually take a look at the chart. If I like what I see, nice chart history, success rate and trading of a strong previous base etc, with the current base break resulting in a panic drop I will consider increasing the TP so that it will make more profit. This can be a bit risky but also very rewarding. Imagine filling all safeties and then selling just below base! Massive profits!! (Gotta be honest though, almost never stretch it that far with a bot though, but it is a possibility) .
If you have studied the chart and concluded that this particular trade has a 90% chance of success, there isn’t really any reason not to place TP just below base. This is where I would like to have the option of layering my sell orders as well so its something im working on implementing.
Trailing is an option in 3commas, but it’s slow to place orders making you miss a selling opportunity when the coin makes a sudden spike up.
ABOUT THIS STRATEGY
In this strategy we can also reverse the strategy and go short. But i must warn you that that is alot riskier.
QFL is meant to be used on higher TF's like 1hr, 2hr and 4hr. But this strategy also work well on lower Timeframes.
The script also simulates DCA strategy with parameters used in 3commas DCA bots for futures trading.
Experiment with parameters to find your trading setup.
Beware how large your total leveraged position is and how far can market go before you get liquidated!
Do that with the help of futures liquidation calculators you can find online!
Included:
An internal average price and profit calculating, instead of TV`s native one, which is subject to severe slippage.
A graphic interface, so levels are clearly visible and back-test analyzing made easier.
Long & Short direction of the strategy.
Table display a summary of past trades
Vertical colored lines appear when the new maximum deviation from the original price has
been reached
All the trading happens with total account capital, and all order sizes inputs are expressed in percent.
How to use:
- Add the script to the current chart
- Open the strategy settings
-Tweak the settings to to your liking.
-Make a SIMPLE bot in 3commas and use the same settings as you did in tradingview if you only want the strategy to send signals to open a deal and let 3commas handle the rest.
If you check safety orders, Take profit deal stop and Stop loss. The strategy will send all the orders to 3 commas. If that’s what you want set TP in 3commas to 50% set number of safety orders to 0 and keep stop loss unchecked.
- Insert bot details using the deal start condition message found in your 3commas bot.
- When happy, right click on the "..." next to the strategy name, then "Add alert'".
- Under "Condition", on the second line, chose "Any alert () function call". Add the webhook from 3commas( 3commas.io ), give it a name, use {{strategy.order.alert_message}} as a placeholder message and "create".
In the future this signal might make it to the 3commas marketplace. You can then subscribe to that signal where I have cherrypicked coins based on thorough backtesting and optimization.
How to obtain access to the script: send me a private message in Tradingview

[B_2] 15min Crypto (Based on Technical Analysis)Republish.
HOW IT WORKS:
+ Open Long: When price close above Kumo Cloud 15m, SuperTrend 15m, RSI > 50, MACD signal (12,26,19) >0, break up Pivot High previous. Dont open long when price close just below resistants in higher timeframe (SuperTrend 2H, 4H).
+ Exit Long: When price hit TPs or SL or having Short Signals.
+ Open Short: When price close below Kumo Cloud 15m, SuperTrend 15m, RSI < 50, MACD signal (12,26,19) <0, break down Pivot Low previous.
+ Exit Short: When price hit TPs or SL or having Long Signals.
HOW TO DO IT:
Very easy to use this script. It only has 2 parts: SETUP ENTRY and SETUP EXIT.
1. SETUP ENTRY:
This strategy uses the rule of dividing capital to enter multiple orders. For example, a common rule 5-3-2 (ie: total capital is 100%, entry 1 is 50%, entry 2 is 30% and entry 3 is 20%). In this strategy, I split my capital into 4 entries. You can customize the capital percentage and price deviation for each entry.
2. SETUP EXIT:
+ Multi profit.
+ Stoploss: you have two options: Stoploss based on percentage or ATR.
+ When price hit TP1, you have two options: only move Stoploss to entry or active trailing.
BACKTEST: You can backtest this strategy on coins: ETH, CRV , RUNE, MATIC, SRM and some like: MKRUSDTPERP , AAVEUSDTPERP , SOLUSDTPERP , ETCUSDTPERP , FILUSDTPERP , BALUSDTPERP , NEARUSDTPERP , SRMUSDTPERP , ALPHAUSDTPERP , DGBUSDTPERP, ...
If you want use this scripts with setup alert or open code, please inbox to me, you are always welcome.

Bitcoin Scalping Strategy (Sampled with: PMARP+MADRID MA RIBBON)
DISCLAIMER:
THE CONTENT WITHIN THIS STRATEGY IS CREATED FROM TWO INDICATORS CREATED BY TWO PINESCRIPTER'S. THE STRATEGY WAS EXECUTED BY MYSELF AND REVERSE-ENGINEERED TO MEET THE CONDITIONS OF THE INTENDED STRATEGY REQUESTOR. I DO NOT TAKE CREDIT FOR THE CONTENT WITHIN THE ESTABLISHED LINES MADE CLEAR BY MYSELF.
The Sampled Scripts and creators:
PMAR/PMARP by @The_Caretaker Link to original script:
Madrid MA RIBBON BAR by @Madrid Link to original script:
Cheat Code's strategy notes:
This sampled strategy (Requested by @elemy_eth) is one combining previously created studies. I reverse-engineered the local scope for the Madrid moving average color plots and set entry and exit conditions for certain criteria met. This strategy is meant to deliver an extremely high hit rate on a daily time frame. This is made possible because of the very low take profit percentage, during the context of a macro downtrend it is made easier to hit 1-3% scalps which is made visible with the strategy using sampled scripts I created here.
How it works:
Entry Conditions:
-Enter Long's if the lime color conditions are met true using the script detailed by Marid's MA
- No re-entry into positions needs to be met true (this prevents pyramiding of orders due to conditions being met true) applicable to both long and short side entries.
- To increase hit rate and prevent traps both the parameters of rsi being sub 80 and no previously engulfing candles need to be met true to enter a long position.
- Enter Short's if the red color conditions of Madrid's moving average are met true.
- Closing Long positions are typically not met within this indicator, however, it still sometimes triggers if necessary. This consists of a pmarp sub 99 and a position size greater than 0.0
- Closing Short positions are typically not met within this indicator, however, it still sometimes triggers if necessary. This consists of a pmarp over 01 and a position size less than 0.0
- Stop Loss: 27.75% Take Profit: 1% (Which does not trigger on ticks over 1% so you will see average trade profits greater than 1%)
BYBIT:BTCUSDT BINANCE:BTCUSDT COINBASE:BTCUSD
Best Of Luck :)
-CheatCode1

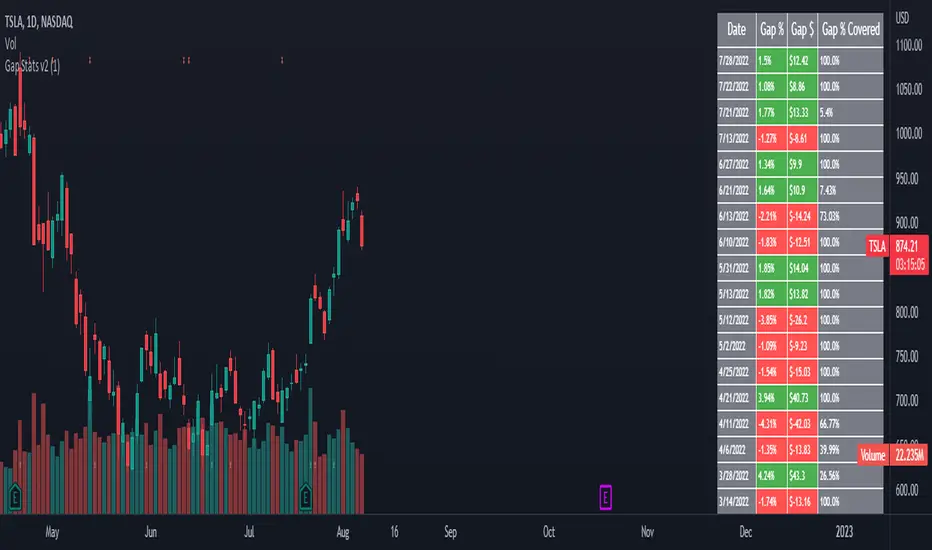
Gap Stats v2This helpful analysis tool displays a table of days a stock has gapped, how much it gapped by and what percentage of the gap was covered.
It is meant to be used on the daily timeframe and can help you distinguish if gaps are going to be filled or not. I like to use it mainly on medium + cap stocks
that have gapped overnight or pre-market and see what the tendency is with how it behaves after a major gap.

R19 STRATEGYHello again.
Let me introduce you R19 Strategy I wrote for mostly BTC long/short signals
This is an upgrated version of STRATEGY R18 F BTC strategy.
I checked this strategy on different timeframes and different assest and found it very usefull for BTC 1 Hour and 5 minutes chart.
Strategy is basically takes BTC/USDT as a main indicator, so you can apply this strategy to all cryptocurrencies as they mostly acts accordingly with BTC itself (Of course you can change main indicator to different assets if you think that there is a positive corelation with. i.e. for BTC signals you can sellect DXY index for main indicator to act for BTC long/short signals)
Default variables of the inticator is calibrated to BTC/USDT 5 minute chart. I gained above %77 success.
Strategy simply uses, ADX, MACD, SMA, Fibo, RSI combination and opens positions accordingly. Timeframe variable is very important that, strategy decides according the timeframe you've sellected but acts within the timeframe in the chart. For example, if you're on the 5 minutes chart, but you've selected 1 hour for the time frame variable, strategy looks for 1 hour MACD crossover for opening a position, but this happens in 5 minutes candle, It acts quickly and opens the position.
Strategy also uses a trailing stop loss feature. You can determine max stoploss, at which point trailing starts and at which distance trailing follows. The green and red lines will show your stoploss levels according to the position strategy enters (green for long, red for short stop loss levels). When price exceeds to the certaing levels of success, stop loss goes with the profitable price (this means, when strategy opens a position, you can put your stop loss to the green/red line in actual trading)
You can fine tune strategy to all assets.
Please write down your comments if you get more successfull about different time zones and different assets. And please tell me your fine tuning levels of this strategy as well.
See you all.

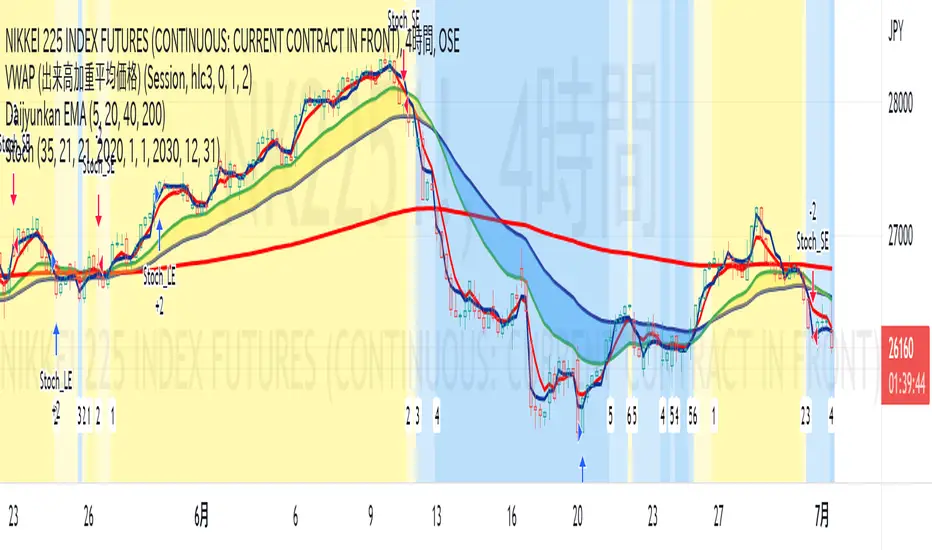
Gotobi TeriyakiUSDJPY Anomaly.
This anomaly originated in Japan.
Buy from 2:00 pm Japan time.
Sell at 9:55 Japan time.
Japanese importers often settle payments to suppliers in dollars, and exchange yen for dollars on settlement days (days falling on a 5 or 10, so-called goto days).
Therefore, on goto days, there is sometimes a shortage of dollars held by financial institutions. This is called the "middle price shortage," and financial institutions purchase dollars through the foreign exchange market to resolve the middle price shortage.
As a result, the dollar currency is bought and USD/JPY depreciates against the yen. Since the yen has historically appreciated against the dollar, exporting companies make forward exchange contracts with financial institutions as a risk hedge.
Financial institutions are therefore forced to procure dollars in the market because they do not have enough dollars in their balance sheets to deliver to exporters.
Five days is called "GO" in Japanese.
Ten days is called "TO" in Japanese.
In Japanese, a day is called "BI".
Now I can eat teriyaki all day long :)
ドル円ゴトー日ストラテジーを作ってみました。

J2S Backtest: 123-Stormer StrategyThis backtest presents the 123-Stormer strategy created by trader Alexandre Wolwacz "Stormer". The strategy is advocates and shared by the trader through his YouTube channel without restrictions.
Note :
This is not an investment recommendation. The purpose of this study is only to share knowledge with the community on tradingview.
What is the purpose of the strategy?
The strategy is to buy the 123-Stormer pattern at the bottom of an uptrend and sell the 123-Stormer pattern at the top of a downtrend, aiming for a short stop for a long profit target.
To which timeframe of a chart is it applicable to?
Recommended for weekly and daily charts, as the signals are more reliable, being that strategy a good option for swing and position trading.
What about risk management and success rate?
The profit target is established by the author as being twice the risk assumed. Also according to the author, the strategy is mathematically positive, reaching around 65% of success rate in tradings.
How are the trends identified in this strategy?
Two averages are plotted to indicate the trend, a fast EMA average with an 8-week close and a slow EMA average with an 80-week close.
Uptrend happens whenever the fast EMA is above the slow EMA and prices are above the fast EMA. In this case, we should start looking for a LONG entry based on the signal of the 123-Stromer pattern to buying.
On the other hand, downtrend happens when the fast EMA is below the slow EMA and prices are below the fast EMA. In this case, we should start looking for a SHORT entry based on the signal of the 123-Stromer pattern to selling.
How to identify the 123-Stormer pattern for a LONG entry?
This pattern consists of three candles. The first candle has a higher low than the second candle's low, and the third candle has a higher low than the second candle's low. In this pattern, we will buy as soon as a trade occurs above the third candle's high, placing a stop as soon as a trade occurs below the second candle's low, with profit target twice the risk assumed. In another words, the amplitude of the prices of the three candles from the third candle’s high upwards. (you can use fibonacci extension to determine your stops and profit targets).
Importantly, the low of the three candles must be above the fast EMA average and in an uptrend.
How to identify the 123-Stormer pattern for a SHORT entry?
This pattern consists of three candles. The first candle has a lower high than the second candle's high, and the third candle has a lower high than the second candle's high. In this pattern, we will sell as soon as a trade occurs below the third candle's low, placing a stop as soon as a trade occurs above the second candle's high, with profit target twice the risk assumed. In other words, the amplitude of prices of the three candles from the third candle’s low down (you can use fibonacci extension to determine your stops and profit targets).
Importantly, the high of the three candles must be below the fast average and in a downtrend.
Tips and tricks
According to the author, the best signal for both LONG or SHORT entry is when the third candle is a inside bar of second candle.
Backtest features
Backtest parameters are fully customizable. The user chooses to validate only LONG or SHORT entries, or both. It is also possible to determine the specific time period for running the backtests, as well as setting a threshold in candels for entry by the 123-Stormer pattern.
Furthermore, for validation purposes, you can choose to activate the best signal of the pattern recommended by the author of the strategy, as well as change the values of the EMA averages or even deactivate them.
Final message
Feel free to provide me with any improvement suggestions for the backtest script. Bear in mind, feel free to use the ideas in my script in your studies.

Swing Failure Reversal StrategyThis strategy is using Swing Failure Patterns as a reversion indicator.
The strategy automatically adapts itself to the timeframe of the current chart.
Swing Failure Pattern occurs when the price trend fails to set new highs in uptrend or meet new lows in a downtrend. This pattern helps traders decide when to enter and exit the market. Usually, traders enter in the downtrend i.e. lower price highs and lower price lows, and exit in the uptrend situation i.e. higher price highs and higher price lows. Thus, traders go against the current trend. This helps the traders take advantage of early trend reversal indicators.
Types of Failure Swing :
Failure Swing Top: This occurs when the stock price goes higher whereas the RSI fails to make a higher high and falls below the recent fail point. The Fail Point is where the RSI line is below the recent swing low. This Failure Swing indicates a short position.
Failure Swing Bottom: This occurs when the stock price gets lower whereas RSI fails to make a lower low and rises over the recent fail point. Fail point is the point where the RSI line is above the recent swing high. This Failure Swing indicates a long position.

sonu1997full banchod
Information technology (IT) companies will kick off the first-quarter earnings season in July amid expectations they will post strong revenue growth, offset by pressure on profit margins exerted by higher. wage costs. IT companies including Infosys and HCL Technologies are unlikely to change their full-year guidance despite concerns of a recession in the US and Europe, analysts said.
Major IT companies typically announce their earnings for the three months ended June in the first fortnight of July, with Infosys and Tata Consultancy Services leading the pack.
The earnings season follows a tumultuous quarter marked by worries over the Russia-Ukraine war, accelerating inflation and tightening of interest rates by global central banks to cool it, supply-chain disruptions, and tumbling financial markets.
IT stocks have fallen the most among sectors, with the Nifty IT index correcting 29 percent from its high in January. Higher valuations and rising fears of an economic slowdown, even recession, in the US and Europe, the biggest markets for IT companies, weighed on the sector
Fib and RSI Strategy PineconnectorUse on 1m only For best results
strategy check for RSI overbought or oversold when key Fib levels are hit
Optimisez to use with Pineconnector using alerts with {{strategy.order.alert_message}}
Feel free to comment or DM if you want to improve
Enjoy

Dual Fibonacci Zone & Ranged Vol DCA Strategy - R3c0nTraderWhat does this do?
This is for educational purposes and allows one to backtest two Fibonacci Zones simultaneously. This also includes an option for Ranged Volume as a parameter.
Pre-requisites:
First off, this is a Long only strategy as I wrote it with DCA in mind. It cannot be used for shorting. Shorting defeats the purpose of a DCA bot which has a goal that is Long a position not Short a position. If you want to short, there are plenty of free scripts out there that do this.
You must have some base knowledge or experience with Fibonacci trading, understanding what is ADX, +DI (and -DI), etc.
You can use this script without a 3Commas account and see how 3Commas DCA Bot would perform. However, I highly recommend inexperienced uses get a free account and going through the tutorials, FAQ's and knowledgebase. This would give you a base understanding of the settings you will see in this strategy and why you will need to know them. Only then should you try testing this strategy with a paper bot.
Background
After I had created and released "Fibonacci Zone DCA Strategy", I began expanding and testing other ideas.
The first idea was to add Ranged Volume to the Fibonacci Zone DCA strategy which I wanted for providing further confirmation before entering a trade. The second idea was to add a second Fibonacci Zone that was just as configurable as the first Fibonacci Zone. I managed to add both and they can be easily enabled or disabled via the strategy settings menu.
Things Got Real Interesting
Things got real interesting when I started testing strategies with two Fibonacci zones. Here's a quick list of what I found I was able to do:
Mix and match exit strategies. I could set the Fib-1 zone strategy to exit with a take profit % and separately set the Fib-2 zone strategy to exit when the price crosses the top-high fib border
Trade the trend. A common phrase amongst traders is "the Trend is your friend" and with the help of an additional Fib Zone, I was able to trade the trend more often by using two different Fib Zone strategies which if configured properly can shorten time to re-deploy capital, increase number of closed trades, and in some cases increase net profit.
Trade both bull market uptrends and bear market downtrends in the same strategy. I found I could configure one Fib Zone strategy to be really good in uptrends and another Fib Zone strategy to be really good in downtrends. In some cases, with both Fib Zone strategies enabled together in a single strategy I got better results than if the strategies were backtested separately.
There are many other trade strategies I am finding with this. One could be to trade a convergence or divergence of the two different Fib Zones. This could possibly be achieved by setting one strategy to have different Fibonacci length.
Credits:
Thank you "EvoCrypto" for granting me permission to use "Ranged Volume" to create this strategy
Thank you "eykpunter" for granting me permission to use "Fibonacci Zones" to create this strategy
Thank you "junyou0424" for granting me permission to use "DCA Bot with SuperTrend Emulator" which I used for adding bot inputs, calculations, and strategy

Bjorgum Double Tap█ OVERVIEW
Double Tap is a pattern recognition script aimed at detecting Double Tops and Double Bottoms. Double Tap can be applied to the broker emulator to observe historical results, run as a trading bot for live trade alerts in real time with entry signals, take profit, and stop orders, or to simply detect patterns.
█ CONCEPTS
How Is A Pattern Defined?
Doubles are technical formations that are both reversal patterns and breakout patterns. These formations typically have a distinctive “M” or a “W” shape with price action breaking beyond the neckline formed by the center of the pattern. They can be recognized when a pivot fails to break when tested for a second time and the retracement that follows breaks beyond the key level opposite. This can trap entrants that were playing in the direction of the prior trend. Entries are made on the breakout with a target projected beyond the neckline equal to the height of the pattern.
Pattern Recognition
Patterns are recognized through the use of zig-zag; a method of filtering price action by connecting swing highs and lows in an alternating fashion to establish trend, support and resistance, or derive shapes from price action. The script looks for the highest or lowest point in a given number of bars and updates a list with the values as they form. If the levels are exceeded, the values are updated. If the direction changes and a new significant point is made, a new point is added to the list and the process starts again. Meanwhile, we scan the list of values looking for the distinctive shape to form as previously described.
█ STRATEGY RESULTS
Back Testing
Historical back testing is the most common method to test a strategy due in part to the general ease of gathering quick results. The underlying theory is that any strategy that worked well in the past is likely to work well in the future, and conversely, any strategy that performed poorly in the past is likely to perform poorly in the future. It is easy to poke holes in this theory, however, as for one to accept it as gospel, one would have to assume that future results will match what has come to pass. The randomness of markets may see to it otherwise, so it is important to scrutinize results. Some commonly used methods are to compare to other markets or benchmarks, perform statistical analysis on the results over many iterations and on differing datasets, walk-forward testing, out-of-sample analysis, or a variety of other techniques. There are many ways to interpret the results, so it is important to do research and gain knowledge in the field prior to taking meaningful conclusions from them.
👉 In short, it would be naive to place trust in one good backtest and expect positive results to continue. For this reason, results have been omitted from this publication.
Repainting
Repainting is simply the difference in behaviour of a strategy in real time vs the results calculated on the historical dataset. The strategy, by default, will wait for confirmed signals and is thus designed to not repaint. Waiting for bar close for entires aligns results in the real time data feed to those calculated on historical bars, which contain far less data. By doing this we align the behaviour of the strategy on the 2 data types, which brings significance to the calculated results. To override this behaviour and introduce repainting one can select "Recalculate on every tick" from the properties tab. It is important to note that by doing this alerts may not align with results seen in the strategy tester when the chart is reloaded, and thus to do so is to forgo backtesting and restricts a strategy to forward testing only.
👉 It is possible to use this script as an indicator as opposed to a full strategy by disabling "Use Strategy" in the "Inputs" tab. Basic alerts for detection will be sent when patterns are detected as opposed to complex order syntax. For alerts mid-bar enable "Recalculate on every tick" , and for confirmed signals ensure it is disabled.
█ EXIT ORDERS
Limit and Stop Orders
By default, the strategy will place a stop loss at the invalidation point of the pattern. This point is beyond the pattern high in the case of Double Tops, or beneath the pattern low in the case of Double Bottoms. The target or take profit point is an equal-legs measurement, or 100% of the pattern height in the direction of the pattern bias. Both the stop and the limit level can be adjusted from the user menu as a percentage of the pattern height.
Trailing Stops
Optional from the menu is the implementation of an ATR based trailing stop. The trailing stop is designed to begin when the target projection is reached. From there, the script looks back a user-defined number of bars for the highest or lowest point +/- the ATR value. For tighter stops the user can look back a lesser number of bars, or decrease the ATR multiple. When using either Alertatron or Trading Connector, each change in the trail value will trigger an alert to update the stop order on the exchange to reflect the new trail price. This reduces latency and slippage that can occur when relying on alerts only as real exchange orders fill faster and remain in place in the event of a disruption in communication between your strategy and the exchange, which ensures a higher level of safety.
👉 It is important to note that in the case the trailing stop is enabled, limit orders are excluded from the exit criteria. Rather, the point in time that the limit value is exceeded is the point that the trail begins. As such, this method will exit by stop loss only.
█ ALERTS
Five Built-in 3rd Party Destinations
The following are five options for delivering alerts from Double Tap to live trade execution via third party API solutions or chat bots to share your trades on social media. These destinations can be selected from the input menu and alert syntax will automatically configure in alerts appropriately to manage trades.
Custom JSON
JSON, or JavaScript Object Notation, is a readable format for structuring data. It is used primarily to transmit data between a server and a web application. In regards to this script, this may be a custom intermediary web application designed to catch alerts and interface with an exchange API. The JSON message is a trade map for an application to read equipped with where its been, where its going, targets, stops, quantity; a full diagnostic of the current state and its previous state. A web application could be configured to follow the messages sent in this format and conduct trades in sync with alerts running on the TV server.
Below is an example of a rendered JSON alert:
{
"passphrase": "1234",
"time": "2022-05-01T17:50:05Z",
"ticker": "ETHUSDTPERP",
"plot": {
"stop_price": 2600.15,
"limit_price": 3100.45
},
"strategy": {
"position_size": 0.1,
"order_action": "buy",
"market_position": "long",
"market_position_size": 0,
"prev_market_position": "flat",
"prev_market_position_size": 0
}
}
Trading Connector
Trading Connector is a third party fully autonomous Chrome extension designed to catch alert webhooks from TradingView and interface with MT4/MT5 to execute live trades from your machine. Alerts to Trading Connector are simple; just select the destination from the input drop down menu, set your ticker in the "TC Ticker" box in the "Alert Strings" section and enter your URL in the alert window when configuring your alert.
Alertatron
Alertatron is an automated algo platform for cryptocurrency trading that is designed to automate your trading strategies. Although the platform is currently restricted to crypto, it offers a versatile interface with high flexibility syntax for complex market orders and conditions. To direct alerts to Alertatron, select the platform from the 3rd party drop down, configure your API key in the ”Alertatron Key” box and add your URL in the alert message box when making alerts.
3 Commas
3 Commas is an easy and quick to use click-and-go third party crypto API solution. Alerts are simple without overly complex syntax. Messages are simply pasted into alerts and executed as alerts are triggered. There are 4 boxes at the bottom of the "Inputs" tab where the appropriate messages to be placed. These messages can be copied from 3 Commas after the bots are set up and pasted directly into the settings menu. Remember to select 3 Commas as a destination from the third party drop down and place the appropriate URL in the alert message window.
Discord
Some may wish to share their trades with their friends in a Discord chat via webhook chat bot. Messages are configured to notify of the pattern type with targets and stop values. A bot can be configured through the integration menu in a Discord chat to which you have appropriate access. Select Discord from the 3rd party drop down menu and place your chat bot URL in the alert message window when configuring alerts.
👉 For further information regarding alert setup, refer to the platform specific instructions given by the chosen third party provider.
█ IMPORTANT NOTES
Setting Alerts
For alert messages to be properly delivered on order fills it is necessary to place the following placeholder in the alert message box when creating an alert.
{{strategy.order.alert_message}}
This placeholder will auto-populate the alert message with the appropriate syntax that is designated for the 3rd party selected in the user menu.
Order Sizing and Commissions
The values that are sent in alert messages are populated from live metrics calculated by the strategy. This means that the actual values in the "Properties" tab are used and must be set by the user. The initial capital, order size, commission, etc. are all used in the calculations, so it is important to set these prior to executing live trades. Be sure to set the commission to the values used by the exchange as well.
👉 It is important to understand that the calculations on the account size take place from the beginning of the price history of the strategy. This means that if historical results have inflated or depleted the account size from the beginning of trade history until now, the values sent in alerts will reflect the calculated size based on the inputs in the "Properties" tab. To start fresh, the user must set the date in the "Inputs" tab to the current date as to remove trades from the trade history. Failure to follow this instruction can result in an unexpected order size being sent in the alert.
█ FOR PINECODERS
• With the recent introduction of matrices in Pine, the script utilizes a matrix to track pivot points with the bars they occurred on, while tracking if that pivot has been traded against to prevent duplicate detections after a trade is exited.
• Alert messages are populated with placeholders ; capability that previously was only possible in alertcondition() , but has recently been extended to `strategy.*()` functions for use in the `alert_message` argument. This allows delivery of live trade values to populate in strategy alert messages.
• New arguments have been added to strategy.exit() , which allow differentiated messages to be sent based on whether the exit occurred at the stop or the limit. The new arguments used in this script are `alert_profit` and `alert_loss` to send messages to Discord

Fibonacci Zone DCA Strategy - R3c0nTraderCredits:
Thank you "eykpunter" for granting me permission to use "Fibonacci Zones" to create this strategy
Thank you "junyou0424" for granting me permission to use "DCA Bot with SuperTrend Emulator" which I used for adding bot inputs, calculations, and strategy
Pre-requisites:
You can use this script without a 3Commas account and see how 3Commas DCA Bot would perform. However, I highly recommend signing up for their free account, going through their training, and testing this strategy with a paper bot. This would give you a base understanding of the settings you will see in this strategy and why you will need to know them.
What can this do?
First off, this is a Long only strategy as I wrote it with DCA in mind. It cannot be used for shorting. Shorting defeats the purpose of a DCA bot which has a goal that is Long a position not Short a position. If you want to short, there are plenty of free scripts out there that do this.
I created this script out of curiosity and I wanted to see how a strategy based on “Fibonacci” levels would work with a 3Commas DCA bot. I came across "eykpunter’s" "Fibonacci Zones" study and in TradingView and I found it to be a very interesting concept. The "Fib Zones" in his study are basically a "Donchian Channel" of 4 Fibonacci lines. These are the High @ 0.236, Center High @ 0.382, Center Low @ 0.618, and Low @ 0.764.
The Fib Zones in this strategy can be used as conditions to open a trade as well as closing a trade. There is also the option to close a trade based on a Target Take Profit (%).
Advanced Fibonacci trading is also supported by specifying additional parameters for Trade Entry and Exit.
For example, for order entry, you can increase the minimum trend strength to open an order via the "minimum ADX value" option. You can also further limit order entry by selecting the option to "Only open trades on bullish +DI" (Positive Directional Index).
Or you can play the contrarian. For example, I would look for "buying the dip" opportunities by doing the following under "Trade Entry Settings":
Set the "Min ADX value to open trade" to zero
Set the option "Open a trade when the price moves" to "1-To the bottom of Downtrend Fib zone" or "2-Higher than the top of the Downtrend Fib zone"
Uncheck option "Only open trades on bullish +DI"
Set the 'Min ADX value to open trade' to Zero
Set the 'Max +DI value to open trade' to a value between 10-20.
For Trade Exit settings, I can use a "Target Take Profit (%)" or one of the High Fib levels to close the trade.
Here's an example result when using a Contrarian-Fibonacci-Zone-DCA strategy:
Explanation of Chart lines and colors on chart
Six Options for Entering a Fibonacci Trade
Open a trade when the price moves:
1-To the bottom of Downtrend Fib zone
2-Higher than the top of the Downtrend Fib zone
3-Higher than the bottom of Ranging Fib Zone
4-Higher than the top of Ranging Fib Zone
5-Higher than the bottom of Uptrend Fib Zone
6-To the top of Uptrend Fib Zone
Three Options for Exiting a Fibonacci Trade
Take profit using:
"Target Take Profit (%)"
"High Fibonacci Border-1"
"High Fibonacci Border-2"

SuperTrend Trapping Candle StrategyHello traders!
How this indicator works?
The main functionality of this indicator is to find entry based upon SuperTrend indicator. This indicator helps us to find trapping candle to enter into the market.
What is a trapping candle?
A trapping candle is a candle that shows strength in opposite direction to SuperTrend. This helps us to enter in a trade before the move start in the current trend's direction. There are two types of trapping candles signals I have added currently:
1. Volume is high than previous candle in the opposite direction.
2. 3 candles of opposite direction with decreasing volume .
How to enter in a trade in uptrend market?
SuperTrend shows a green signal
A green triangle formed below red candle
Enter into the trade when price is above red candle high
SL could be place below red candle or swing low if it is near
How to enter in a trade in downtrend market?
SuperTrend shows a red signal
A red triangle formed above green candle
Enter into the trade when price is below green candle low
SL could be place above green candle high or swing high if it is near
How to avoid to enter in a trade in sideways market?
You can follow price action strategies
Or you can follow some indicator to find sideways market
Indicator settings and how to change?
ATR Length - For SuperTrend, this is default value.
Factor - For SuperTrend, changed to 2 to provide fast signals.
Candle Height - For trapping candle price, default set to 0.003% of the current price.

Scalping Support Resistance StrategyScalping strategy for BTC using one line: Support Resistance.
The strategy draws a line based on the minimum value of the average of High, Low, and Close for a given bar. The entries are carried out on the breakdown of this line. Exits are managed by the specified in the script's inputs take-profit and stop-loss percentages.
From Stream:
www.tradingview.com

Pinbar trailing stop strategyThe strategy finds the nearest pinbar pattern and opens a position (long or short). You choose your take profit and stop loss multiplier.
Take Profit - X times the pinbar size from it's highest point.
Stop loss - X times the pinbar size from it's lowest point.
You can find more detailed screenshots and the source-code on my github page: samgozman/pinbar-strategy-tradingview

Price action: Double top/bottom StrategyDouble top and bottom patterns are chart patterns that occur when the underlying investment moves in a similar pattern to the letter "W" (double bottom) or "M" (double top).
In this strategy, I use Pivot High/Low to find Double top and bottom.
Entry long: when Double bottom occur.
Entry short: when Double top occur.
Risk: Reward: You can change % Stop loss and Target pfofit.
