Boom Trading: EMA Channel StrategyVersion 1
Add EMA 50 high, low, and 200 close
Filter trend by EMA 200
Crossing by EMA 50 channel with EMA 20 fast
Chart patterns

Oversold RSI with tight SL Strategy (by Coinrule)This is one of the best strategies that can be used to get familiar with technical indicators and start to include them in your trading bot rules.
ENTRY
1. This trading system uses the RSI ( Relative Strength Index ) to anticipate good points to enter positions. RSI is a technical indicator frequently used in trading. It works by measuring the speed and change of price movements to determine whether a coin is oversold (indicating a good entry point) or overbought (indicating a point of exit/entry for a short position). The RSI oscillates between 0 and 100 and is traditionally considered overbought when over 70 and oversold when below 30.
2. To pick the right moment to buy, the strategy enters a trade when the RSI falls below 30 indicating the coin is oversold and primed for a trend reversal.
EXIT
The strategy then exits the position when the price appreciates 7% from the point of entry. The position also maintains a tight stop-loss and closes the position if the price depreciates 1% from the entry price. The idea behind this is to cut your losing trades fast and let your winners ride.
The best time frame for this strategy based on our backtesting data is the daily. Shorter time frames can also work well on certain coins, however in our experience, the daily works best. Feel free to experiment with this script and test it on a variety of your coins! With our backtesting data a trading fee of 0.1% is taken into account. The fee is aligned to the base fee applied on Binance, which is the largest cryptocurrency exchange by volume. In the example shown, this strategy made a handsome net profit of 39.31% on Chainlink with 61.54% of trades being profitable.

Sideways Strategy DMI + Bollinger Bands (by Coinrule)Markets don’t always trade in a clear direction. At a closer look, most of the time, they move sideways. Relying on trend-following strategies all the time can thus lead to repeated false signals in such conditions.
However, before you can safely trade sideways, you have to identify the most suitable market conditions.
The main features of such strategies are:
Short-term trades, with quick entries and quick exits
Slightly contrarian and mean-reversionary
Require some indicator that tells you it’s a sideways market
This Sideways DMI + Bollinger Bands strategy incorporates such features to bring you a profitable alternative when the regular trend-following systems stop working.
ENTRY
1. The trading system requires confirmation for a sideways market from the Directional Movement Index (DMI) before you can start opening any trades. For this purpose, the strategy uses the absolute difference between positive and negative DMI, which must be lower than 20.
2. To pick the right moment to buy, the strategy looks at the Bollinger Bands (BB). It enters the trade when the price crosses over the lower BB.
EXIT
The strategy then exits when the move has been exhausted. Generally, in sideways markets, the price should revert lower. The position is closed when the price crosses back down below the upper BB.
The best time frame for this strategy based on our backtest is the 1-hr. Shorter timeframes can also work well on certain coins that are more volatile and trade sideways more often. However, as expected, these exhibit larger volatility in their returns. In general, this approach suits medium timeframes. A trading fee of 0.1% is taken into account. The fee is aligned to the base fee applied on Binance, which is the largest cryptocurrency exchange.

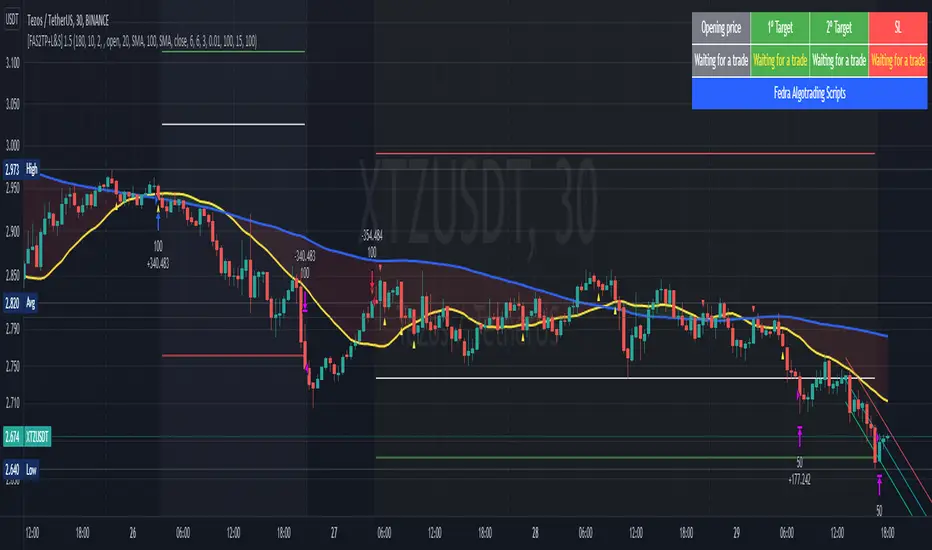
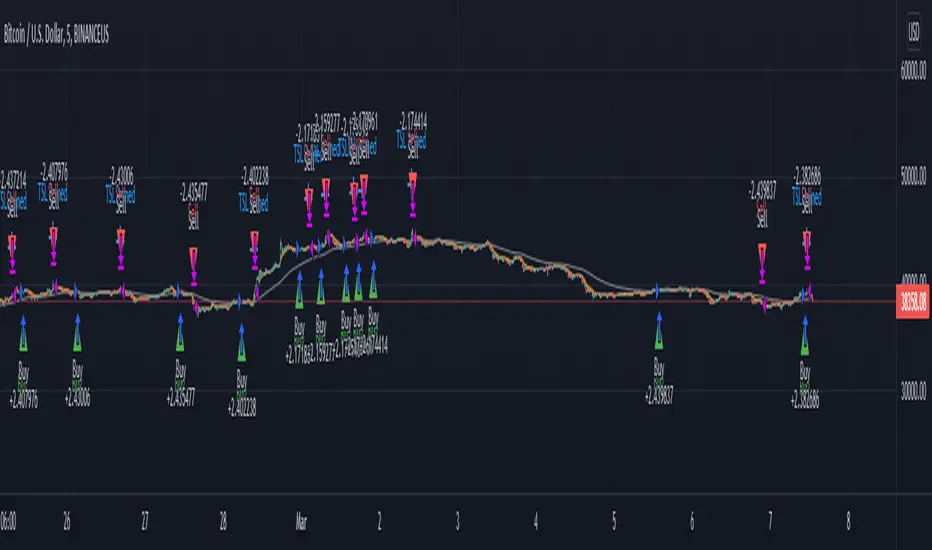
[Fedra Algotrading Strategy 2tp+L&S] Futures Long or ShortStrategy for crypto market, designed for automatic algorithmic trading with bots.
Can place long and short orders
Calculates your entries based on the breakout of the simple deviation of the linear regression of the last X periods.
Configures TP (green line) and SL (red line) percentages, the TP is a trailing TP.
Optionally, you can set a first TP (white line) that sells half of the position.
Advanced trend filter to not open trades against the market. SMA (yellow line), WMA (blue line) and secret sauce
Includes an advanced system to control the backtest period (choose how many days to backtest).
Risk management by volume of capital or amount of losing trades (kill switches that will exit the trade and stop the script)
The script includes default commissions of 0.2% per trade (configurable).
- Dinamic table with Price positions to plan your limit orders if you are trading manually
- Highly customizable and optimizable.
If you want to trade longs and shorts, it is advisable to create 2 different alerts. In most cases, the optimal parameters for longs are not the same as for shorts. In a forthcoming update I will enable separate configurations.
For better performance the script uses real time price information, for this reason Tradingview may warn you that there is "repainting", as the backtest information does not contain the information of each tick but only the open, close, high and low values of each candle.
To avoid this, you can disable the "calculate on every tick" option from the strategy settings panel.
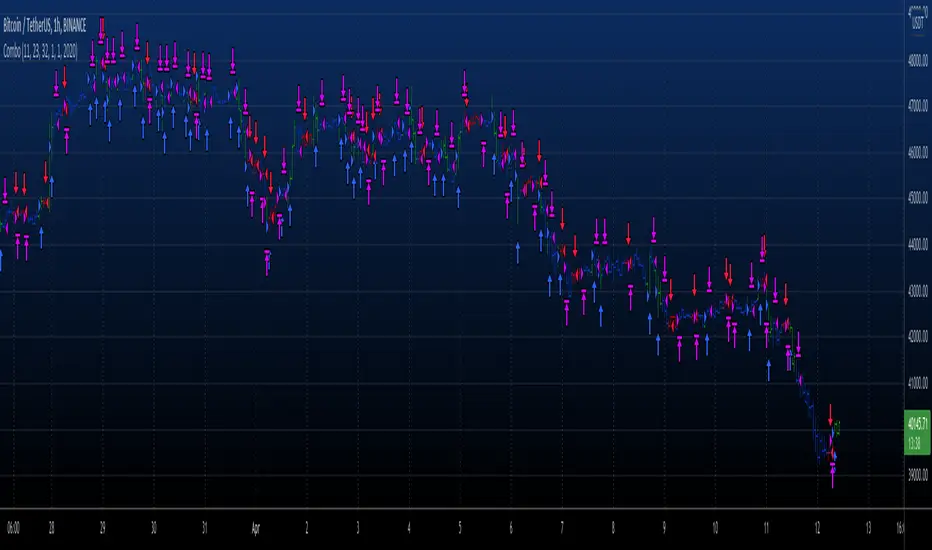
Combo 2/20 EMA & Bill Awesome Oscillator (AC) This is combo strategies for get a cumulative signal.
First strategy
This indicator plots 2/20 exponential moving average. For the Mov
Avg X 2/20 Indicator, the EMA bar will be painted when the Alert criteria is met.
Second strategy
This indicator plots the oscillator as a histogram where blue denotes
periods suited for buying and red . for selling. If the current value
of AO (Awesome Oscillator) is above previous, the period is considered
suited for buying and the period is marked blue. If the AO value is not
above previous, the period is considered suited for selling and the
indicator marks it as red.
WARNING:
- For purpose educate only
- This script to change bars colors.

Strategy Execution Template - Master PatternThis script is a template to execute your strategy with Stop Loss and Take Profit and showing Trades.
Then, you can write your strategy without taking care of Stop Loss and Take Profit method.
3x Fixed Percent Stop Loss, Trailing Percent Stop Loss, Trailing ATR Stop Loss, Tailing HHLL Stop Loss
3x Fixed Percent, Take Profit

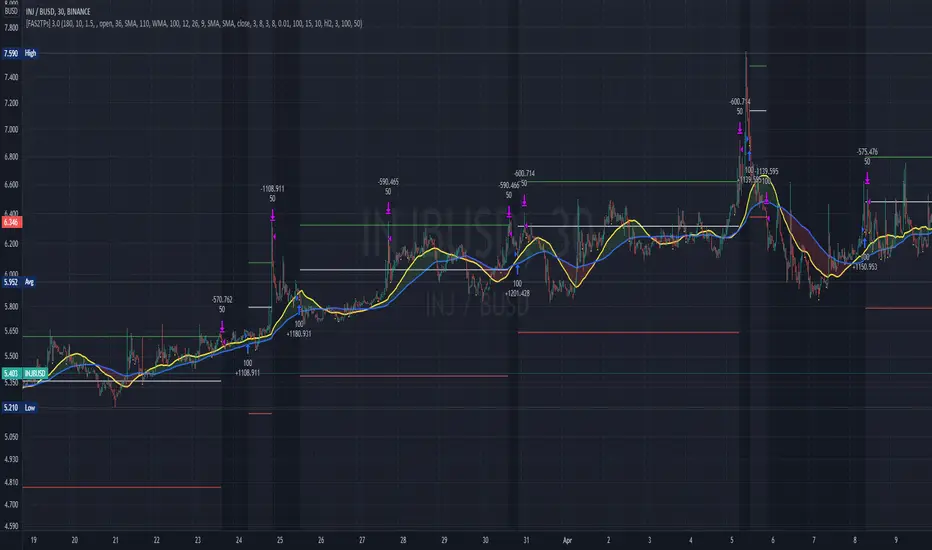
[Fedra Algotrading 2TPs]This strategy uses the deviation of a simple linear regression to determine the entry point into a short-term trend. It also includes an intelligent trend filter (SMA, WMA, Super trend and MACD), to determine the dominant trend over a longer time frame and avoid opening trades against the market.
It manages capital by dividing the position into 2 take profits, the first one configurable in a fixed percentage, which will sell half of the position, and the second one that will trigger a trailing take profit once the desired percentage is reached, with the rest of the position.
Each parameter is optimizable to adapt it to the desired market, but this strategy benefits from the high volatility of mid and low capitalization cryptocurrencies due to their higher volatility.
It also includes tools to adjust the backtests, and command inputs so that the script can automatically work with bots.
Combo 2/20 EMA & (H-L)/C Histogram This is combo strategies for get a cumulative signal.
First strategy
This indicator plots 2/20 exponential moving average. For the Mov
Avg X 2/20 Indicator, the EMA bar will be painted when the Alert criteria is met.
Second strategy
This histogram displays (high-low)/close
Can be applied to any time frame.
WARNING:
- For purpose educate only
- This script to change bars colors.
Wick Reversal Hi the given strategy is based on detecting hammer and shooting star patterns to trade early reversals.

TTC2022TSLA15mThis is version 1.0 "TTC2022TSLA15m" Strategy. This has only been back tested for the ticker "TSLA" on the 15m chart for the year 2022. The reason I isolated this strategy to 2022 is because TSLA's chart patterns have changed from the previous 2 years. So, I wanted to develop an indicator-based strategy that was consistent with current market conditions. The default setting for percent of equity is set to 5% risk. I will adjust any variables that make this TTC2022TSLA15m Strategy more accurate in the future as more 2022 data comes out.
It's based on my TTC: Triangular Trend Channel script that dynamically creates a trend channel on the move. It uses open, high, low, close, simple moving average inputs for its plot lines and sma9 & ema5 for calculation purposes. The default trend channel line settings are based off sma64.
Default color coded in top to bottom price order:
green = top
orange
blue
white = center (64sma)
purple
yellow
red = bottom
• Remember * This has only been back tested for the ticker "TSLA" on the 15m chart for the year 2022 to date. *

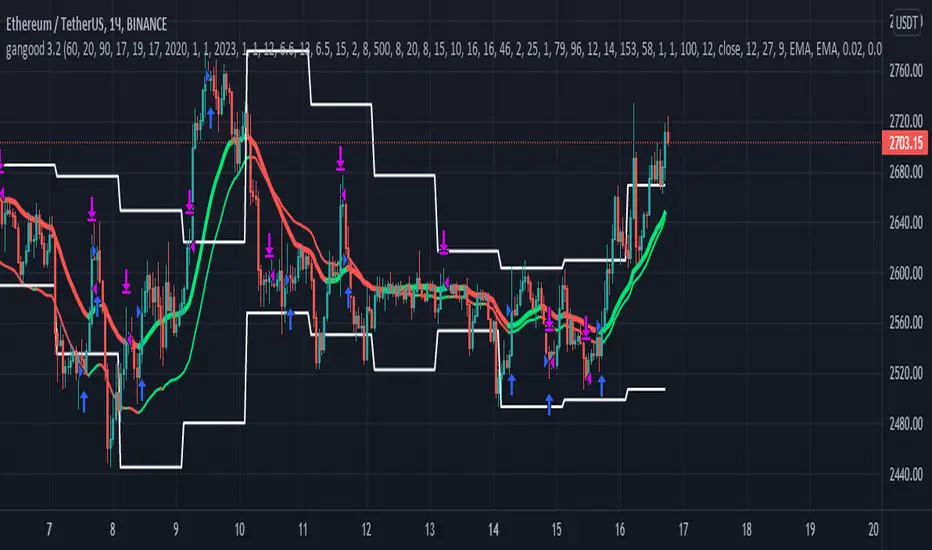
gangood bot for FinandyGangood is a mean reversion algorithm currently optimized for trading the ETH/USDT pair on the 1 hour chart time frame. All indicator inputs use the closing price of the period, and all trades are executed at the open of the period following the period in which the trading signal was generated.
To take into account slippage, the commission costs 0.15%.
Backtest result from 2020.
Result since 2019 2,500,000%, maximum drawdown 18%
This bot uses 11 indicators:
1) ADX
2) RANGE FILTER
3) SAR
4) RSI
5) TWAP
6) JMA
7) MACD
8) VOLUME DELTA
9) VOLUME WEIGHT
10) MA
11) TSI
Pattern 1:
There are 3 main components that make up Gangood: I. Trend Filter. The algorithm uses a version of the ADX indicator as a trend filter to only trade during certain time periods when price is most likely to be range-bound (i.e., average retracement). This indicator consists of a fast ADX and a slow ADX both using the same lookback period.
The ADX is smoothed with a 6-period EMA and the slow ADX is smoothed with a 12-period EMA. When the fast ADX is above the slow ADX , the algorithm does not trade because it indicates that the price is most likely trending, which is bad for a mean reversion system. Conversely, when the fast ADX is below the slow ADX, the price is likely to be in a range, so this is the only time the algorithm is allowed to trade. II. Bollinger Bands When the trend filter allows trading, the algorithm uses Bollinger Bands.
Indicator for opening long and short positions. The Bolliger Bands indicator has a 20 lookback period and a 1.5 standard deviation for both the upper and lower bands. When the price crosses the lower band, a buy signal is generated and a long position is opened. When the price crosses the upper band, a sell signal is generated and a short position is opened.
Pattern 2:
Based on RSI which is commonly used as a trend reversal indicator. However, here it is used as a trend-setting indicator, often with great success. This pattern only takes long trades, which is quite successful in a bull market.
Pattern 3:
Long or short trades are determined by the intersection of the fast EMA with the slow EMA for long positions and vice versa for short positions. Trades should only occur close to intersections. We then use the MACD for the long position. an indicator with a 10-minute time frame where we look for high peaks in negative values for longs and vice versa for shorts. They should be significantly higher than the other peaks.
Capital Management:
The maximum leverage in this strategy, I would recommend 2x, in order to trade without unnecessary risks and keep your nerves in order.
Bot setup:
I use the Finandy terminal, in which you can easily trade with this strategy.
1. We go to binance and turn on the hedging mode, this is necessary so that if tradingview sends a webhook for buying later than for selling.
2. Adding a new signal to Finandy
2.1. Open tab
2.1.1. "Order side" Strategy
2.1.2. "Amount" Balance% x Leverage
2.1.3. We set the percentage of the order two times less than the one you want
2.1.4. "Shoulder" is twice as large as the one you want
2.2.Close tab
2.2.1. "Enebaled" tick
2.2.2. "Reverse / Close" Disable
3. Set a notification for this strategy.
4. Copy "Signal URL" and paste it into webhook on tradingview
5. Copy "Signal Message" and paste it into the message on tradingview

PCT Trailing Stoploss-Strategy
I am not a financial advisor and this is not financial advice. This is provided for illustration only for a Percent based Trailing Stoploss.
I have been looking for a Percent based Trailing Stoploss and have not been able to find one that would work for me so I wrote my own. This works in both a Strategies and Indicators I put comments inline of where to add or remove comments// depending on which one you are aiming for. The simple EMA crossovers are there just to give the strategy something to do. To use, copy the Stoploss section, the inputs at the top, and the reset under the sell section to your own script. When I first started out I found the code for removing the redundant signals and then used it in most of my scripts. For the life of me I do not remember where I got it - either in a comment in Tradingview or on a reddit post, so if you wrote that part, thank you.
About me:
I have only been working with PineScript since January 2022 and have never been much of a coder from a professional standpoint but decided to jump in and learn Pine mainly because I am a crap, emotional trader and this way I can remove that aspect of it and lose my money programmatically as opposed to making it a conscious decision :)
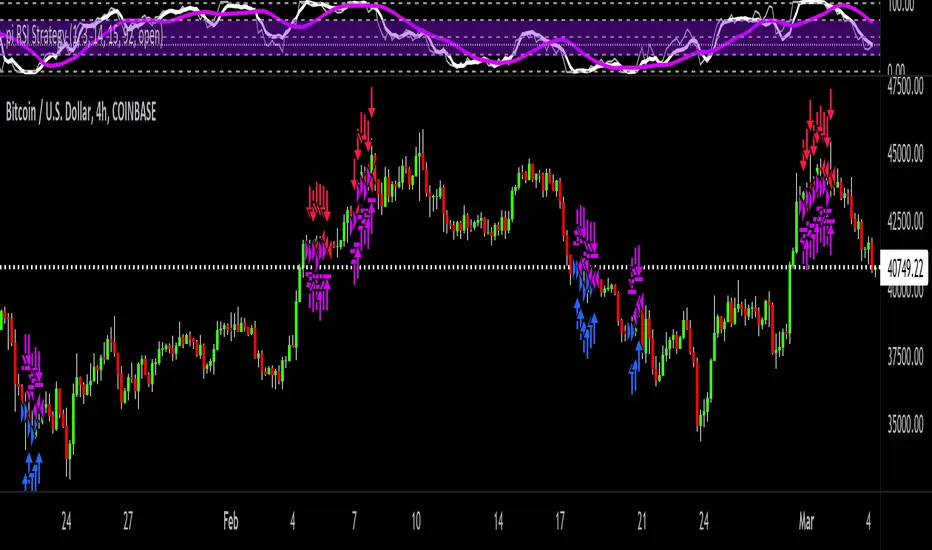
pi RSI StrategypiRSI Strategy is based on my relative strength index indicator pi RSI because it uses the first 15 sequential numbers in Archimedes constant "pi" 3.14159265358979.. I felt that the never ending, non-repeated number, pi, was a good candidate for an input that tracks the constantly changing trends these days.
This is a price momentum strategy that helps you evaluate overbought or oversold conditions. By the default colors, when the white line is above the purple it's going bullish. And when the white line is under the purple it's going bearish.
Also, on the scale, 50 is neutral, below 25 is getting oversold and above 75 is getting overbought. This strategy is useful in conjunction with other price and volume indicators / strategies to help redundantly confirm future price action.
I've spent exhaustive effort on new research & development, engineering, back testing accuracy, real time capital testing, & future version revision of my trading indicator / strategy scripts.
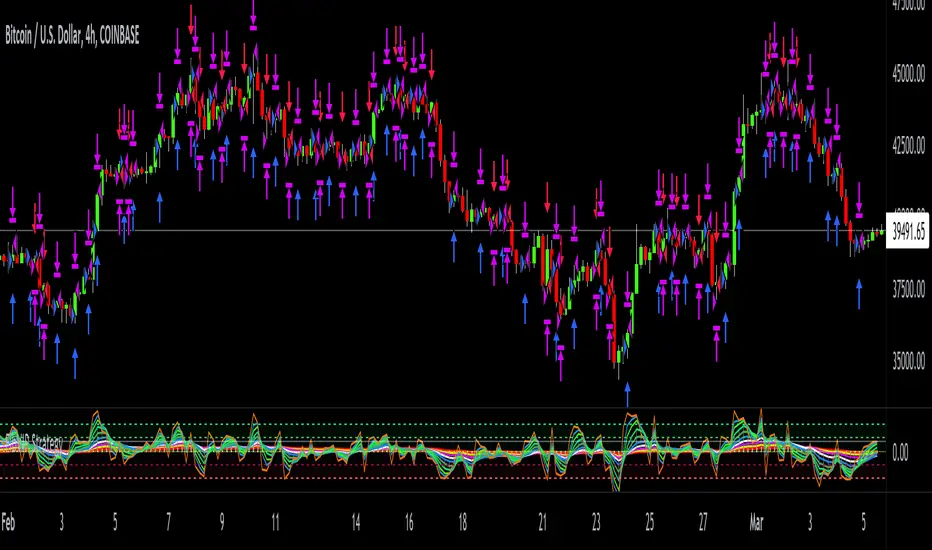
FibVIP StrategyThis is version 1.0 FibVIP Strategy. It's based on my Fibonacci VIP indicator script. Fibonacci VIP (Fibonacci Volume Indicator Precision) is a volume indicator that I made to help me have precise entry and exit timing. It's based on the well-known Fibonacci sequence 1, 2, 3, 5, 8, 13, 21, 34, 55, 89...
The default colors I like to use can be changed to whatever you want. The numbers inputted are based on volume.
Bullish momentum in ascending order is 21 = white, 13 = blue, 8 = green.
Bearish momentum descending order is 89 = red, 55 = yellow, 34 = purple.
Immediate momentum 1 = orange, 2 = blue, 3 = neon green, 5 = lime.
Four high, mid high, mid low & low dashed channel lines with transparent fill colors lime, green, maroon & red.
Also, there's a gray zero line & white dynamic horizontal dotted line to help keep momentum in perspective.
The most bullish signal is when all colors are in a top-down order 1, 2, 3, 5, 8, 13, 21, 34, 55, 89. The most bearish signal is when all colors are reversed and have a bottom-up order of 89, 55, 34, 21, 13, 8, 5, 3, 2, 1.
A crossover, cross-under, divergence or convergence of these colors, help signal the future price action. For example, green crossing over red is bullish, but green crossing under red is bearish.
If colors are low / below the zero line that's bearish and if they are above the zero line, that's bullish.
The FibVIP works great as a leading indicator to confirm future price action of the underlying security momentum.
Combo 2/20 EMA & Adaptive Price Zone This is combo strategies for get a cumulative signal.
First strategy
This indicator plots 2/20 exponential moving average. For the Mov
Avg X 2/20 Indicator, the EMA bar will be painted when the Alert criteria is met.
Second strategy
The adaptive price zone (APZ) is a volatility-based technical indicator that helps investors
identify possible market turning points, which can be especially useful in a sideways-moving
market. It was created by technical analyst Lee Leibfarth in the article “Identify the
Turning Point: Trading With An Adaptive Price Zone,” which appeared in the September 2006 issue
of the journal Technical Analysis of Stocks and Commodities.
This indicator attempts to signal significant price movements by using a set of bands based on
short-term, double-smoothed exponential moving averages that lag only slightly behind price changes.
It can help short-term investors and day traders profit in volatile markets by signaling price
reversal points, which can indicate potentially lucrative times to buy or sell. The APZ can be
implemented as part of an automated trading system and can be applied to the charts of all tradeable assets.
WARNING:
- For purpose educate only
- This script to change bars colors.

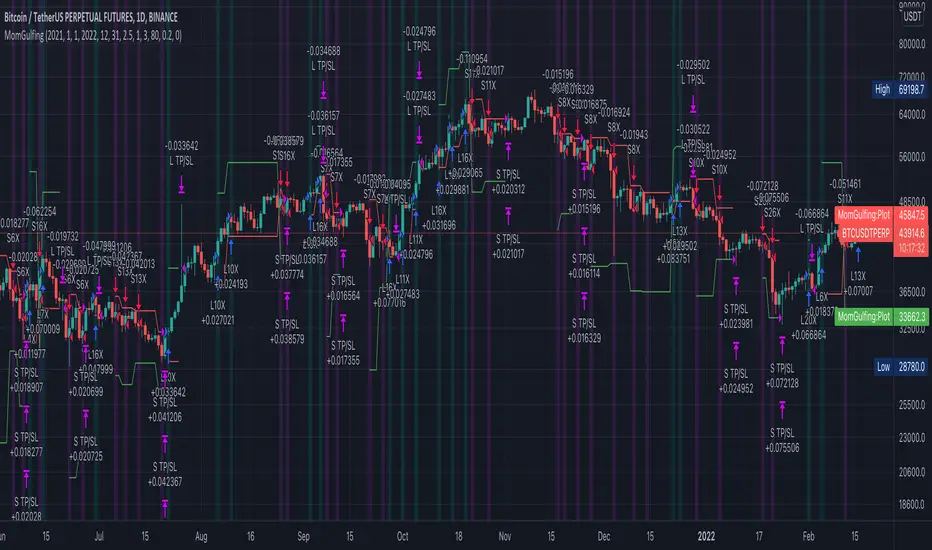
MomGulfingLong Position Rules:
RED -> GREEN,
Green close > previous red high,
Green candle volume > previous red candle volume
or
RED -> GREEN -> GREEN
First green close < previous red high,
Second green close > previous red high,
Second green candle volume > previous red candle volume
or
RED -> GREEN -> GREEN -> GREEN
First green close < previous red high,
Second green close < previous red high,
Third green close > previous red high,
Third green candle volume > previous red candle volume
Short Position Rules:
GREEN -> RED,
Red close < previous green low,
Red candle volume > previous green candle volume
or
GREEN -> RED -> RED
First red close > previous green low,
Second red close > previous green low,
Second red candle volume > previous green candle volume
or
GREEN -> RED -> RED -> RED
First red close > previous green low,
Second red close > previous green low,
Third red close < previous green low,
Third red candle volume > previous green candle volume
Risk Management:
First bar's low/high stop loss level
RR:2.5 take profit level
Leverage: 80/percent(stop level)
Pyramiding: 3
Update tp/sl at every signal
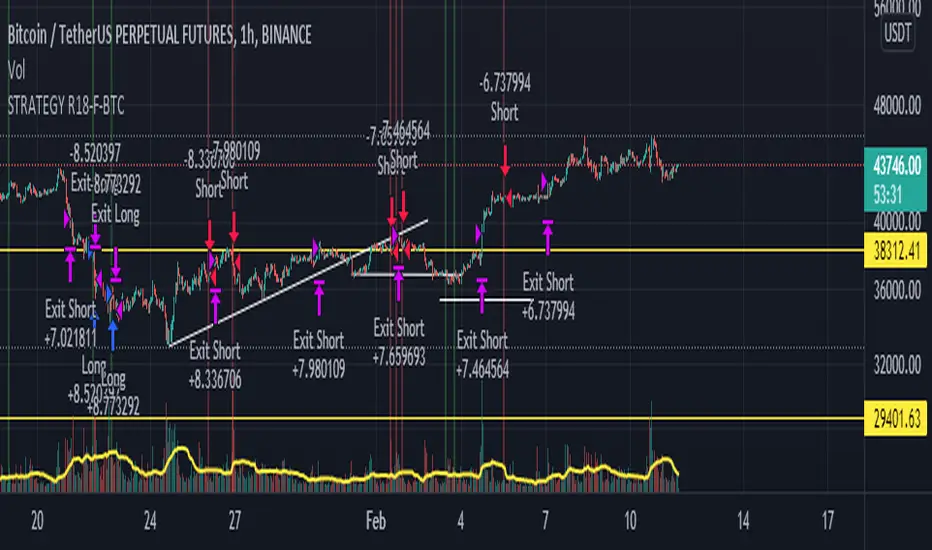
STRATEGY R18-F-BTCHi, I'm @SenatorVonShaft
Just finished the strategy "STRATEGY R18-F-BTC" for trading on #bitcoin and other cryptocurrencies.
As any strategy on TradingView, R18 opens Long/Short positions (with no leverage) on certain price points for assets in the chart. But I intentionally make this strategy for Bitcoin . Strategy is effective with 1h chart and it has %36 winning trade ratio for #bitcoin trade. As strategy uses approximately 1/3 ratio of SL/TP levels, gross profit for 1 year backtest is above %200 (I mean above 3x for only BTC )
Strategy is built on combination of:
- MACD
- RSI
- FIBONACCI levels
- BTCUSDT price itself as indicator (for different crypto assets and BTCUSDTPERP trading. You can select different assets you like for indicator (it's BTCUSDT:Binance by default))
I fine-tuned all levels of indicators above accordingly (it has more than 10 variables that effects strategy itself).
You can find out your own strategy levels by adjusting long/short tp&sl variables as well as initial capital ratio variable.
Reverse option open reverse positions of the strategy