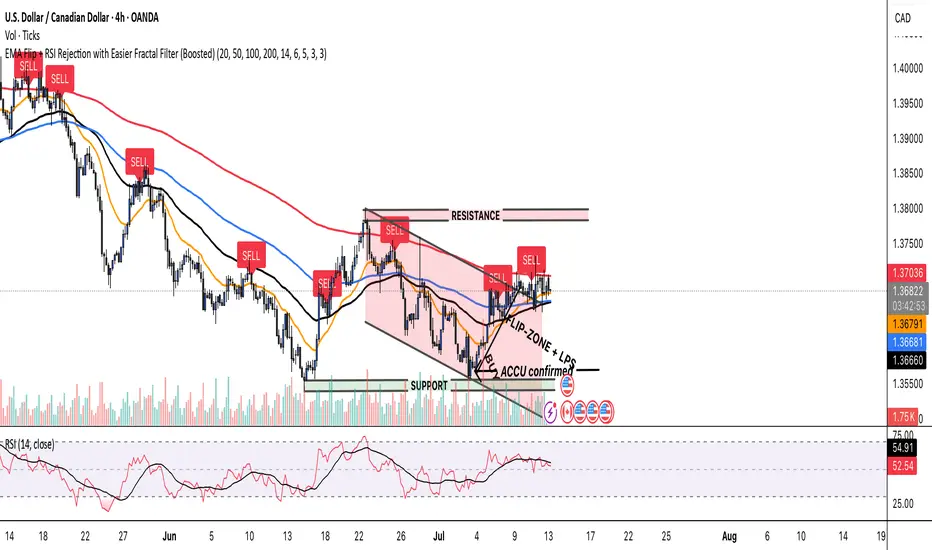
EMA Flip + RSI Rejection with Easier Fractal Filter (Boosted)SQUEEZE & FLIP for spotting LPSs and LPSYz. This Indicator identifies LPS and LPSYS
Chart patterns
20% Rally - All Green CandlesThis indicator detects rallies where the price rises 20% or more using only consecutive green candles. It marks the rally's start with a green dashed line and "Entry" label, and the end with a red solid line and "Target" label. Ideal for identifying strong bullish momentum on daily charts.

Reversal IndicatorWhat does this indicator do?
This indicator is designed to help traders spot potential reversal points in the market by combining multiple conditions:
✅ Multi-Timeframe RSI – Checks RSI on a lower timeframe (like 5m) to see if the market is oversold or overbought.
✅ Higher Timeframe SMA Filter – Uses a higher timeframe SMA (like 1h) as a trend filter, so signals only trigger in the direction of the bigger trend.
✅ Candle Pattern Confirmation – Looks for bullish or bearish engulfing candles to confirm price exhaustion before signaling a reversal.
When all these conditions align, the indicator plots a triangle under/above the candle to highlight a possible reversal.
Why is this useful?
Many traders struggle with false RSI signals or candle patterns that fail because they don’t respect the larger trend.
This indicator filters out weak setups by requiring alignment between:
A lower timeframe RSI oversold/overbought condition,
A higher timeframe trend filter (SMA),
And a strong candle reversal pattern.
This multi-layer approach helps avoid chasing every RSI dip and focuses only on high-probability reversal zones.
How does it work?
Bullish reversal signal → appears when RSI on the lower TF is oversold, price is still above the higher TF SMA (trend still intact), AND a bullish engulfing candle forms.
Bearish reversal signal → appears when RSI on the lower TF is overbought, price is below the higher TF SMA, AND a bearish engulfing candle forms.
When all conditions match, the indicator plots a triangle under the candle for bullish signals and above the candle for bearish signals.
How to use it?
Choose your timeframes:
A timeframe for trend filtering (e.g. 1h).
A timeframe for RSI (e.g. 4h).
NOTICE: THE RSI TIMEFRAME SHOULD BE GREATER THEN THE TIMEFRAME FOR THE SMA
Otherwise it will not generate that much signals.
Watch for signals ONLY in the direction of the higher trend.
Use the signals as potential reversal points, not as guaranteed entries. Combine with your own confluence.
Optionally set alerts for bullish or bearish reversal conditions so you never miss a setup.
Customization
✅ Choose your RSI length & overbought/oversold levels.
✅ Select which timeframes you want for SMA & RSI.
✅ Toggle the higher TF SMA display on/off.
✅ Adjust signal appearance (triangles).
Important Notes
⚠️ This is not a standalone trading system. It’s a tool to help spot possible reversal areas. Always confirm with price action, support/resistance, or your own strategy


KZ TRADING _ BOT RSI,STOCH, MO HINH NENBot trade demo for m15 . it suitable for XAU, U.J. use RSI + Stoch RSI and candless pattem

Robbin hoodsomething good, this is ewrfiwevdcbdkjsdbvkj vasfdkjvsdvkjae dk;v asd vk;jsbdvkaeskv jkjsD v.kj awerekrv

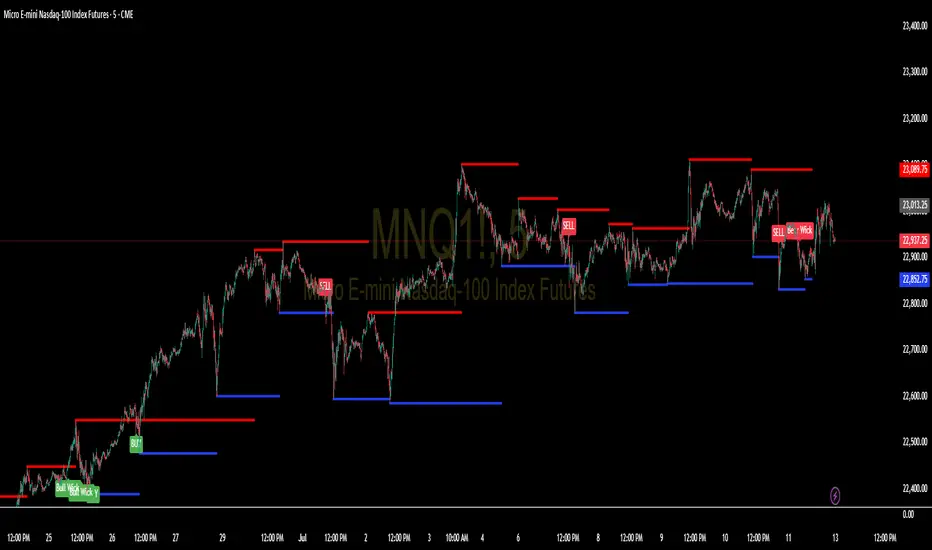
Support and Resistance Levels with BreaksThis indicator identifies dynamic support and resistance levels using pivot point analysis and provides clear trading signals when these levels are broken with volume confirmation. Enhanced version with improved signal clarity for better trading decisions.
## 🔧 Key Features
### Support & Resistance Detection
- Automatically identifies key pivot high and low levels
- Draws clear visual lines (red for resistance, blue for support)
- Configurable sensitivity with left/right bar settings
### Enhanced Trading Signals
- **BUY** signals when resistance is broken with volume confirmation
- **SELL** signals when support is broken with volume confirmation
- **Bull Wick** alerts for potential reversals at resistance
- **Bear Wick** alerts for potential reversals at support
### Volume Confirmation
- Built-in volume oscillator using 5 and 10-period EMAs
- Filters out low-volume false breakouts
- Adjustable volume threshold (default: 20%)
### Complete Alert System
- Support Broken alerts
- Resistance Broken alerts
- Bull Wick reversal alerts
- Bear Wick reversal alerts
## ⚙️ Settings
- **Show Breaks**: Toggle signal display
- **Left Bars**: Pivot detection lookback (default: 15)
- **Right Bars**: Pivot detection lookforward (default: 15)
- **Volume Threshold**: Minimum volume increase for valid signals (default: 20%)
## 📈 Best For
- Swing trading strategies
- Breakout confirmation
- Support/resistance trading
- Volume-based entry signals
## 🔍 How It Works
1. Identifies pivot highs/lows using configurable periods
2. Calculates volume oscillator for confirmation
3. Generates BUY signals on resistance breaks with volume
4. Generates SELL signals on support breaks with volume
5. Detects wick patterns for potential reversals
## 📋 Updates in This Version
- Enhanced BUY/SELL signal clarity (replaced generic "B" labels)
- Added Bull Wick and Bear Wick alert conditions
- Updated to Pine Script v6 compatibility
- Improved signal filtering and accuracy
## ⚠️ Disclaimer
This indicator is for educational and informational purposes only. Always conduct your own analysis and risk management before making trading decisions. Past performance does not guarantee future results.
---
**Original Script**: "Support and Resistance Levels with Breaks" by LuxAlgo
**License**: CC BY-NC-SA 4.0
**Enhanced by**: profitgang
**Version**: Pine Script v6
K_RSI_ATR_ATR%_CMO_MACD_ADXThis indicator is combination of below indicators:
RSI
ATR
ATR%
CMO
MACD
ADX


EMA HMA ATF Trade SignalThis indicator is designed as a discretionary trading tool to highlight high-quality trade setups across 15-minute and similar intraday timeframes. It uses a multi-layered logic framework combining trend, momentum, structure, and timing filters. It is not meant to fire frequently — its strength is in filtering out noise and emphasizing clean, aligned market moves.

Lokie's RSI + VWAP + EMA Scalper [Fresh Edition]Lokie’s RSI + VWAP + EMA Scalper
Built for fast, smart scalping on 1–5 min charts. Combines RSI momentum, EMA crossovers, and VWAP zone bias to highlight clean buy/sell entries.
No FOMO signals. No fluff. Just tactical precision.
Perfect for momentum traders who want clarity, not clutter.
By DerekFWIN

Stop or Go?-Displaying RVOL as ratio now instead of percentage.
-Default startup location moved to bottom right with large size

EdgeXplorer - Mitigation SignalsEdgeXplorer – Mitigation Signals
Trade structure. React with precision. Trail with logic.
EdgeXplorer – Mitigation Signals is a precision tool designed to help traders visually identify mitigation zones in price action — areas where liquidity is swept, structure shifts, and opportunities appear. Using smart detection logic, this script plots high-probability bullish or bearish zones, provides TP/SL range guidance, and includes a built-in trailing stop system — all while coloring candles dynamically for cleaner trend recognition.
This is for traders who trust the story behind the candle — not just the candle itself.
⸻
🔍 What It Does
This script detects and maps mitigation blocks, entry zones, targets, and dynamic stops based on key price action structures. You get:
• Real-time bullish and bearish mitigation zones
• Average basis line inside zones (optional)
• Auto-calculated take profit (TP) and stop-loss (SL) regions
• Adaptive trailing stop engine
• Full candle coloring override to clarify live trend bias
It’s a visual and logic-based system to simplify complex decisions.
⸻
⚙️ How It Works
1. Mitigation Signal Detection
It identifies bullish or bearish mitigation signals by analyzing recent wick and close structure. When a breakout fakeout occurs (e.g., price sweeps a high/low and closes opposite), a mitigation zone is drawn — marking potential reversal or continuation zones.
2. Zone Boxes + Labels
A colored zone box appears around the structural wick. Inside that zone, a dashed average line can also be shown — acting as a “basis” for break-and-retest or trailing logic.
3. Range Zones for TP/SL
Above or below the mitigation zone, the script draws:
• A range top for profit-taking (ATR-based)
• A range bottom if enabled — great for SL zones or alternate TP levels
4. Trailing Stop System
After a signal is fired, the script deploys a dynamic trailing stop based on ATR and your trend mode:
• Reset on every new signal (more reactive)
• Or only on opposite signal (more committed)
5. Candle Coloring Engine
As long as price stays inside the active move, candles are color-coded (wick and body). If a trailing stop is hit or the zone is breached, the override is removed.
⸻
📊 Inputs & Settings
Setting Description
Zone Width Filter Filters out narrow/weak setups using ATR distance logic
TP/SL Range Zones Show/hide TP (top) and optional SL (bottom) boxes with custom distance
Trailing Stop Logic Choose how and when the trail resets (signal vs inverse signal)
Bull/Bear Toggle Show/hide specific mitigation zone types (bullish/bearish)
Average Line Toggle the median line inside the zone
Candle Coloring Auto overrides candles when a valid move is active
⸻
🧠 Use It For…
• Scalping and Intra-Day Reversals
Quickly spot smart money moves with structural context and follow-through logic.
• Swing Trading Smart Entries
Wait for confirmation, then use the built-in trailing stop to manage trades with less emotion.
• Trend Continuation Filtering
Use the average line and trailing stop to stay in strong moves while filtering noise.
• Break & Retest Traders
Let the zone + average line show you where to re-enter or add with confidence.
⸻
🚨 Built-In Alerts
✅ Bullish Mitigation Signal
✅ Bearish Mitigation Signal
✅ Trailing Stop Flips

BTST Top Gainer ScannerBTST Stock identifier- BETA
scanner configuration based on the validated BTST checklist. This scans for stocks likely to gain 5-10% intraday tomorrow when bought at today's close:
Execution Tips:
Run scanner at 3:20 PM IST daily
Filter stocks with:
FII/DII net buying (check moneycontrol)
Pre-market futures premium > 0.4%
No pending corporate actions
Position sizing formula: Qty = (1% Account Risk) / (1.5 * ta.atr(14))
Cross-verify with FII/DII activity (moneycontrol.com) - stocks with FII net buys have 23% higher success rate.

NASDAQ Liquidity Breaker Bot1. Define session time (7:20 PM – 7:40 PM BD time / 9:20–9:40 AM EST)
2. Detect 15M swing high/low zones
3. On 1M chart: Detect strong bullish/bearish break
4. Identify breaker candle zone
5. Trigger entry based on break + retest logic
6. Set SL and TP logic (dynamic if needed)
7. Plot everything visually (entries, exits, zones)

Horizontal Lines [Vynkron]📄 Script Description – "Horizontal Lines "
This Pine Script v6 indicator draws up to 11 customizable horizontal lines on your chart, ideal for marking round levels, support/resistance zones, or psychological price points (e.g. every 100 points on the NQ).
🔧 Features:
11 price inputs (default: 22000 to 23000, step 100)
Single color, width, and style configuration for all lines
Uses hline() so lines are fixed across the full chart
Easy to adjust or toggle lines individually
💡 Use Cases:
Highlighting round-number levels on instruments like Nasdaq 100 Futures
Visualizing major price zones
Manual technical analysis without scripting loops
Let me know if you want to make it dynamic, add labels, or only draw lines within the visible chart range.


StratNinjaTableThe StratNinjaTable is a comprehensive technical analysis tool for TradingView designed to provide traders with a multi-timeframe overview of a security's performance and key metrics in a single, customizable table.
This indicator is built around "The Strat" candlestick methodology, which focuses on inside bars (1), trending bars (2U for up, 2D for down), and outside bars (3). It displays this information across multiple, user-selected timeframes simultaneously, from minutes to yearly charts.
Key Features
Multi-Timeframe "Strat" Analysis: The core of the indicator is a table that shows the current "Strat" number (1, 2U, 2D, or 3) and the directional bias (▲ for up, ▼ for down) for each selected timeframe. This allows for a quick assessment of market structure and potential setups across different chart periods.
Customizable Timeframe Selection: Users can easily select which timeframes they want to monitor, including standard intervals like 5-minute, 15-minute, hourly, daily, weekly, and monthly charts.
Comprehensive Data Table: Beyond the "Strat" analysis, the indicator populates a detailed table with essential market data:
Ticker Information: Displays the current ticker and the chart's timeframe.
Money Flow Index (MFI): Shows the MFI value, with color-coded backgrounds to highlight overbought (>80) and oversold (<20) conditions.
Average True Range (ATR): Provides the ATR value and its percentage relative to the closing price, with color signals for low or high volatility.
Market Cap: Calculates and displays the security's market capitalization.
Sector Information: Shows the sector the security belongs to.
Moving Average Data: Includes the distance of the current price from the 20-day Simple Moving Average (SMA), expressed as a percentage.
Volume: Displays the 30-day average trading volume.
Strat Pattern Prediction: Shows a historical sequence of the last two Strat patterns and a potential future pattern based on the current bar's direction.
Timeframe Countdown: A timer for each timeframe shows how much time is left until the current candle closes.
Customizable Appearance: The indicator offers extensive customization options for the table's position on the screen and the colors used for different "Strat" bar types, allowing users to tailor the visual presentation to their preferences.
In essence, the StratNinjaTable serves as an all-in-one dashboard, enabling traders to quickly gauge market sentiment, identify confluence across timeframes, and access key technical data without cluttering their charts with multiple separate indicators.


PC UpdatedThis indicator identifies a high-probability breakout setup using a simple but powerful 3-candle formation. It works on lower timeframes (like 5m) and is ideal for scalping or short-term intraday setups.

Japanese Candlestick PatternsCandlestick Pattern Detector – Your Smart Market Insight Tool
Unlock the hidden language of price action with the Candlestick Pattern Detector, an advanced TradingView indicator meticulously crafted to identify powerful candlestick formations in real time. Whether you are a day trader seeking sharp reversals, a swing trader scouting for trend continuations, or an investor who values precise entry signals, this indicator is your indispensable trading companion.
The Candlestick Pattern Detector continuously scans every bar on your chart and highlights over 30 classic and advanced candlestick patterns, including dojis, engulfing candles, hammers, shooting stars, morning stars, evening stars, haramis, and more. Each detected pattern is labeled directly on the chart, providing crystal-clear visual signals without clutter. Customizable settings allow you to choose which patterns to monitor, fine-tune sensitivity, and adjust label colors and styles to match your personal trading aesthetic.
Beyond merely spotting patterns, this indicator empowers traders to understand the psychological forces driving the market. Bullish and bearish signals help you gauge potential trend reversals, momentum shifts, or periods of consolidation. By integrating these time-tested price action signals into your strategy, you gain a powerful edge in anticipating market moves before they unfold.
Key Features:
Detects 30+ popular candlestick patterns in real time
Clear on-chart labels and color-coded signals
Customizable alerts for immediate trading opportunities
Adjustable sensitivity for noise reduction
Perfect for intraday, swing, or long-term trading
Elevate your trading precision and confidence with the Candlestick Pattern Detector. Let the market’s story reveal itself, candle by candle.

