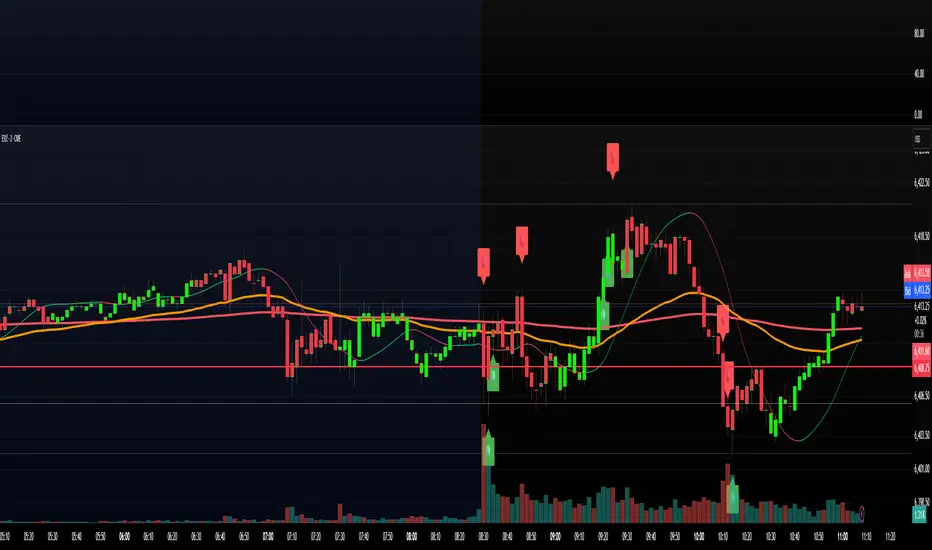
Intra Bullish Strategy - Profit Ping v4.0ProfitPing 4.0 is a high-precision intraday swing trading strategy designed for global equity markets, including the US, South Africa, and Australia. The system identifies high-probability BUY and EXIT signals using a confluence of technical indicators and real-time volume dynamics.
🧠 Key Features:
Dual EMA Crossover (7 & 14) for short-term trend confirmation
Volume Spike Detection based on 20-period moving average
RSI Momentum Filter (ideal zone: 55–65) to avoid overbought entries
MACD Histogram & Signal Line Sync for trend momentum validation
Candlestick Pattern Filtering (e.g. bullish engulfing, flags, breakout candles)
Multi-Timeframe Confirmation (optional) for intraday trend alignment
Dynamic Risk-to-Reward Logic built into alert framework
Webhook-compatible JSON alerts for automation to Google Sheets, Power BI, and IBKR
🛠️ Alert System:
BUY alert triggers when all bullish conditions align
EXIT alert triggers only if a previous BUY exists for that ticker
Trade status is updated live in Google Sheets and integrated with Power BI dashboards
Orphaned EXITs (no matched BUY) are tracked separately for accuracy review
🔄 Ideal For:
Traders seeking 1:2 to 1:5 risk/reward setups
Automation-focused workflows (via TradingView → Google Sheets → Power BI)
Swing traders wanting clean visual logs, automated P&L tracking, and optional IBKR execution
Chart patterns

Official USD Staggered Bands - ArgentinaOfficial USD Staggered Bands - Argentina
The Central Bank, under the administration of Javier Milei (La Libertad Avanza), announced on Friday, April 11, 2025, a series of measures to eliminate the so-called "exchange rate restriction."
In this new phase, the dollar's exchange rate on the Free Exchange Market (MLC) will be able to fluctuate within a band between $1,000 and $1,400 , the limits of which will be expanded at a rate of 1% monthly.
The lines evolve daily, increasing as the public administration predicts. This way, you can know the likelihood of a Central Bank intervention to correct the variation and return the peso to a price within the band.
The script runs under the ticker USDARS

Night Session Highlight with Timezone (Valehson)Highlights this time range from 21:00 to 09:00 with a gray background with 90% transparency.

Night Session Highlight (Valehson)Highlights time range from 21:00 to 09:00 with a gray background with 90% transparency.
Dual Session ORB S/R Lines Pro by Yendor_BShort description:
Clean opening-range breakout support/resistance lines for London and US sessions with confirmed breakout labels and alert-ready signals. UTC-based, adjustable start point, customizable styling, minimal clutter.
Detailed description:
What it does:
Captures the Opening Range (default first 15 minutes) for London and New York (US) sessions in UTC, plots the high and low as support/resistance lines, and marks confirmed breakouts when price closes beyond those levels. Lines can begin at either the range end or session start and persist for the configured session length.
Key Features:
ORB defined over the first N minutes after session open (configurable, default 15).
Two sessions: London and US (New York) with separate start times.
High/low support & resistance lines per session:
Selectable start point: Range End or Session Start.
Independently customizable color, width, and style (solid/dashed/dotted) for each high and low.
Confirmed breakout labels: only on the first candle that closes beyond the ORB high or low after the range completes (prior close must be inside).
Alerts and alertconditions for breakout long/short per session, usable in TradingView’s alert dialog.
Fully UTC-based. Works on any timeframe; 1-minute or 5-minute recommended for precision.
Minimal visual clutter; no persistent shaded boxes in this version.
Inputs explained:
ORB Duration (minutes): Length of the opening range used to calculate session high and low.
Session Length (hours): How long the S/R lines remain active (typically full session).
London / US Start (UTC): Session open times in UTC.
Line Start Point: Choose whether the lines begin at the range end or at the session start.
High/Low Styling: Independent color, thickness, and style for each session’s high and low.
Breakout Labels: Toggle one-time confirmed breakout annotations.
Alerts: Enable breakout alert messages.
Example workflows:
Monitor the first 15 minutes of the London session.
After the range, wait for a candle to close beyond the high or low for a confirmed breakout.
Use the label or alert to trigger entry logic (retest, continuation, etc.).
Repeat for the US session; compare overlaps for higher conviction.
Alert setup:
Open the Alerts panel. Choose one of the built-in alertconditions: London Breakout Long, London Breakout Short, US Breakout Long, US Breakout Short. Set frequency to Once Per Bar Close. Customize notification/webhook payload if automating.
Preset suggestions:
Standard London ORB: 15 minute range, lines from range end, green high / lime low.
Standard US ORB: 15 minute range, lines from range end, blue high / aqua low.
Overlap Bias: Both sessions active, lines start from session start, differentiated styles.
Tips & best practices:
Combine with external volume or volatility filters to reduce false breakouts. Use on correlated pairs to observe consistent session structure. Treat broken ORB levels as flipped support/resistance on revisit. Prefer confirmed closes beyond lines rather than wick touches.
Limitations / disclaimer:
Provides structural visualization and breakout signaling; does not guarantee profitability. Always apply proper risk management and confirm with additional context. Backtest settings before live use.
Tags:
#ORB #OpeningRangeBreakout #SessionTrading #LondonSession #NewYorkSession #SupportResistance #Breakout #Intraday #Pinev6 #TradingView #Forex #TrendStructure #Alerts #USD #EURUSD #TradingSignals #UTCBased #PriceAction #MarketStructure #IntradayBreakouts

ALPHA 999This indicator is designed to provide traders with clear and reliable signals by combining essential technical tools into one simplified framework. Whether you’re trading crypto, stocks, or forex, this tool helps identify potential entry and exit points using . It is well-suited for both intraday and swing traders, offering customizable inputs, multi-timeframe compatibility, and real-time alerts. The indicator displays intuitive visual cues directly on the chart, making it easy to interpret market conditions and respond quickly. Ideal for traders who prefer clean charts with actionable signals, this tool enhances decision-making without overwhelming complexity. While powerful on its own, it can be paired with other indicators for greater confirmation and accuracy. Please note: this indicator is for educational purposes only and should be used with proper risk management and backtesting before applying to live trades.
ALPHA 999This script is a custom-built indicator designed to enhance your trading strategy by providing . It is optimized for and suitable for both intraday and swing traders.

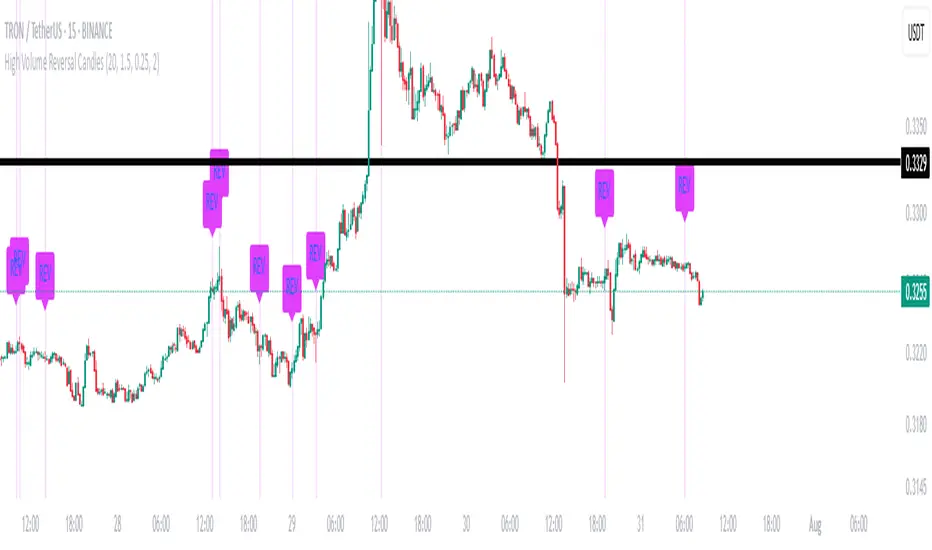
High Volume Reversal CandlesIdentifies candles which display reversal patterns (mainly hammers, inverted hammers, spinning top) on unusually high volume.
This makes the candlestick pattern more likely to fulfil.
Remember to always wait for confirmation; should only be used as an entry locator, not entry trigger.
Dynamic Gap Probability Tool with N-Bar Decay📌 How It Works
1. Moving Average (MA) Reference
o The indicator plots a moving average (SMA, EMA, WMA, etc.) on the chart.
o Price can be above or below this moving average.
2. Probability Tracking
o Every time a bar closes, the script records:
Whether the next candle closed up (green) or down (red).
Whether within the next N bars (e.g., 3 bars ahead) the price moved higher or lower than the current close.
3. N Bar Lookahead
o Instead of only caring about the very next candle, it looks forward several bars to see if the market eventually moves in your favor.
o Example: If N = 3, it answers:
"Within the next 3 bars, what’s the chance price will go higher/lower from here?"
4. Results Table
o At the edge of your chart, the table shows:
✅ Next Green % – Probability next candle is bullish.
❌ Next Red % – Probability next candle is bearish.
📈 N Bar Bull % – Probability that within N bars, price goes higher.
📉 N Bar Bear % – Probability that within N bars, price goes lower.
💡 Why It’s Useful for Traders
• Removes Guesswork – Instead of relying on “gut feeling,” you see historical probabilities for how price reacts when above/below the MA.
• Better Trade Timing – If N Bar Bullish Probability is high, it suggests waiting for confirmation and holding longer than just 1 candle.
• Adapts to Style –
o Scalpers: Use N = 1 to see immediate probabilities.
o Swing Traders: Use N = 3, 5, or 10 to see longer-term reaction probabilities.
• Trend Awareness – Works differently above and below the moving average, giving you a bias toward long or short trades.
• Confidence in Decisions – Probabilities are based on real past data from the chart’s history.

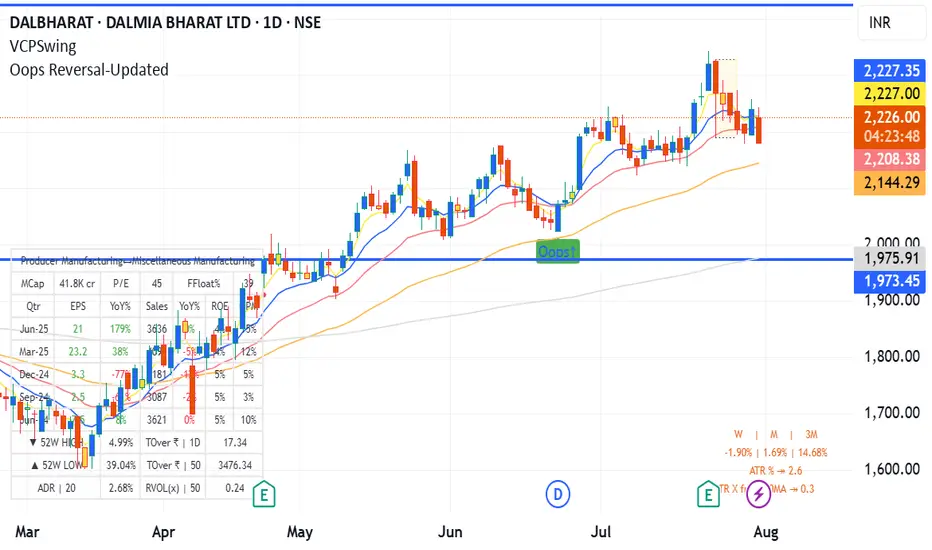
Oops Reversal-Updatedoops reversal - manas arora updated to cover only if it closes above previous day high
Multi CEX BTC Spot vs Perpetual PremiumThis Indicator shows the BTC Spot vs Perpetual premium across different CEX.

Combined Time and Price IndicatorCammjayyy THis is a time frame indicator that changes the colors based on day highs and lows. really good for swings and hedging

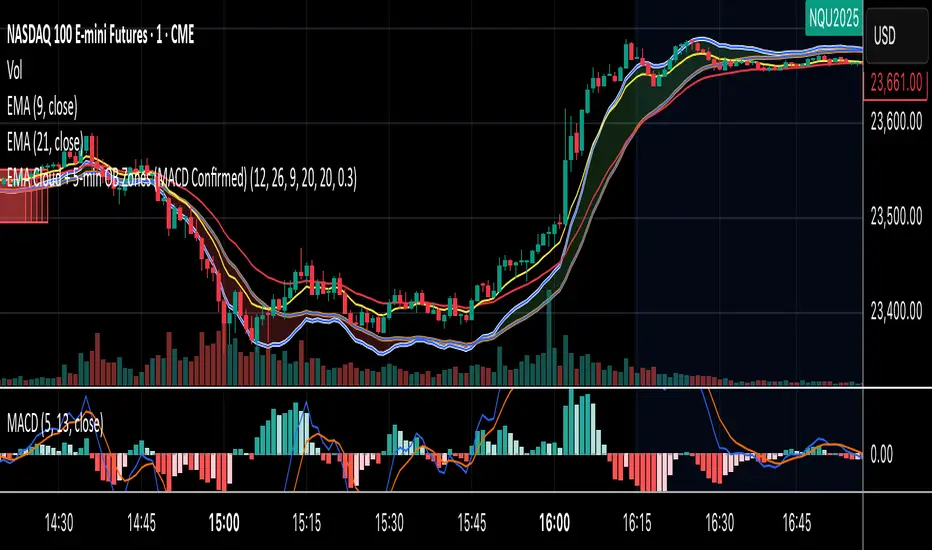
EMA Cloud + 5-min OB Zones (MACD Confirmed)What This Does:
OB detection runs only on 5-minute candles
Script works perfectly even if you're on a 1-minute chart
You’ll still see clean 5-min OB boxes extending into your execution zone

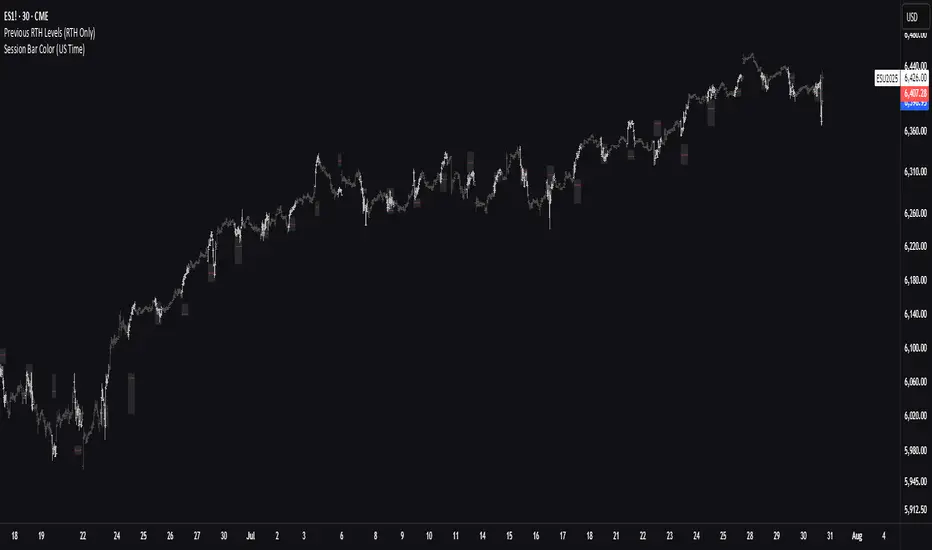
Previous RTH Levels (RTH Only)Previous RTH Levels on current session (RTH Only)
This indicator calculates key volume profile levels from the previous Regular Trading Hours (RTH) session and projects them onto the current RTH session. It is designed to provide traders with significant historical price levels—Point of Control (POC), Value Area High (VAH), and Value Area Low (VAL)—to use as potential support, resistance, and pivot points for intraday trading.
Instead of just plotting lines, this script highlights the entire Value Area (VA) between the VAH and VAL, offering a clear visual reference for the prior day's zone of price agreement.
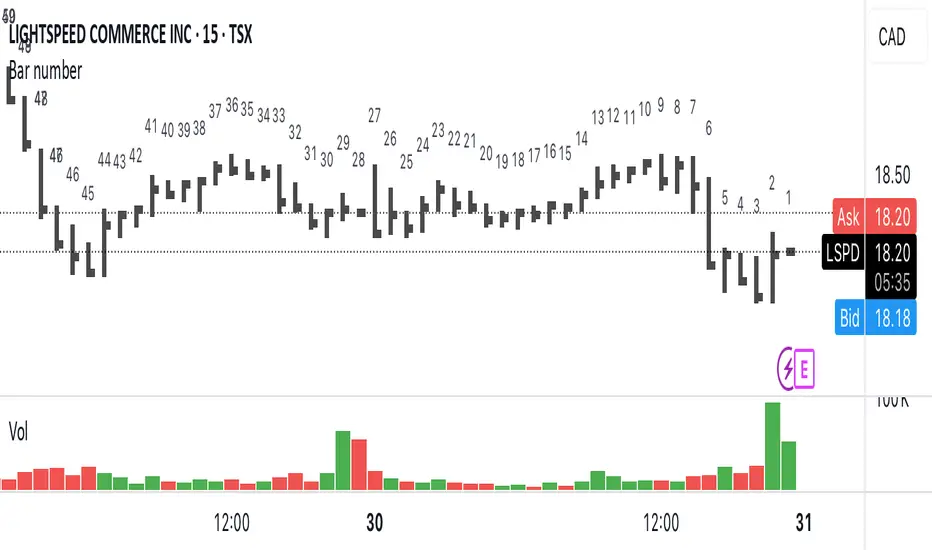
Bar numberAdds a number above the last 50 candles. Candle 1 is always the most recent.
Can be useful when teaching people onlinet. Now they can just ask « what’s candle number 20 » instead of « what’s with that narrow range candle next to the big one to the left… no not that one, the other one »
Silver BulletSilver Bullet is a trading tool built for finding cleaner, higher-probability setups. It focuses on key windows of market movement and adds helpful tools like daily range levels and candlestick patterns.
Whether you’re trading breakouts or reversals, Silver Bullet gives you a clearer view of the market and more confidence in your setups.
⸻
🔹 Trading Setup #1: Macro Time
The Macro Time setting offers two modes: Macro Bullet and Silver Bullet. Both help traders focus on specific times when the market tends to deliver clean moves.
• Macro Bullet is based on the high and low of a full macro session. It automatically detects the session’s range and bias, then offers optimal entries for either Long or Short setups. Once the session resolves, it provides Fibonacci-based levels for entry, target, and stop loss.
• Silver Bullet is based on ICT concepts and focuses on the hourly range for London, NY AM, and NY PM sessions. It’s designed for quick time blocks and highlights key levels as the session unfolds.
To use this setup, set Macro Time to “ICT Sessions” and select your preferred mode under Bullet Mode.
⸻
🔹 Trading Setup #2: Daily Range
Enable Daily Range to draw Fibonacci levels based on either the previous day’s candle or the current day’s developing range. These levels help you identify potential support, resistance, and midpoint zones throughout the day.
With the current day’s range, levels automatically update in real time as new highs or lows form — keeping your chart aligned with evolving price action.
⸻
🔹 Trading Setup #3: Candlestick Patterns
Turn on Candlestick Patterns to automatically highlight clean reversal signals such as Hammers, Hanging Men, Shooting Stars, and Tweezers. Each pattern is detected using specific criteria and trend filters to reduce noise and improve reliability. They work especially well as confirmation signals around key levels or session zones.
Silver Bullet brings structure, clarity, and precision to your intraday trading. By combining time-based bias, price action levels, and pattern recognition, it helps you trade with purpose — not guesswork. Use one setup or combine all three for a complete view of the market, tailored to your style and session of choice.

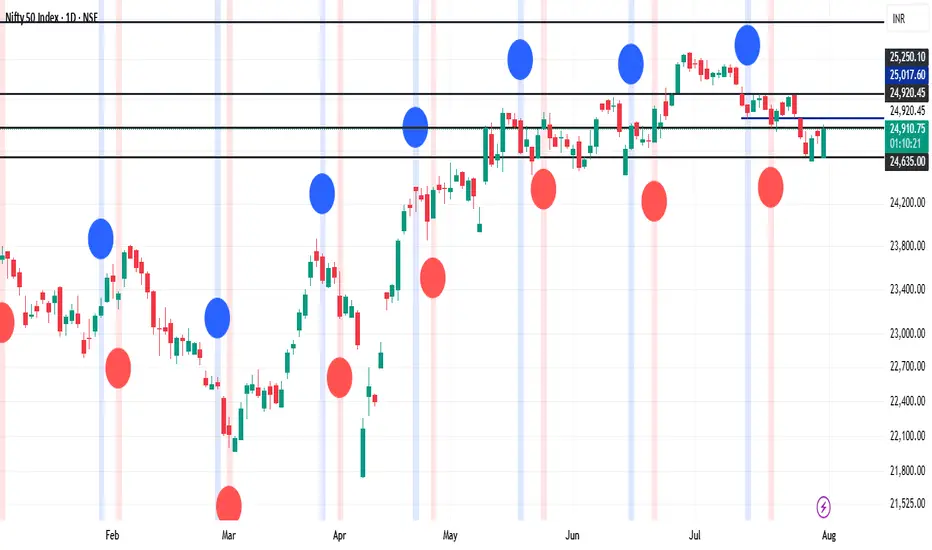
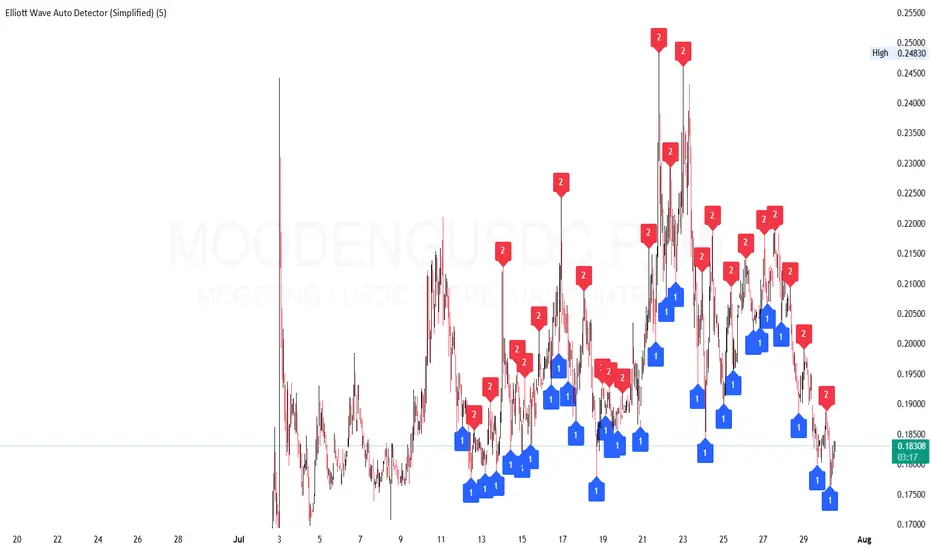
Elliott Wave Auto Detector (Simplified)How to Use the Detector
Identify Structure: Look for sequences like 1-2-1-2...
These may show a forming or ongoing Elliott wave pattern.
Validate Trend: Multiple red 2’s at lower highs suggests a bearish trend; the reverse with blue 1’s at higher lows is bullish.
Trading Zones:
Consider buying near clusters of blue 1’s (support zones).
Consider selling or shorting near clusters of red 2’s (resistance zones).
Look for Breakouts: If price breaks out of the descending channel, trend may reverse or accelerate.
Order Block Finder (5-min Demand Zones)This highlights potential bullish order blocks on a 5-min chart when:
Candle is bullish
Small body (suggesting accumulation or absorption)
Lowest low in last X bars