LUX CLARA - EMA + VWAP (No ATR Filter) - v6EMA STRAT SHOUT OUTOUTLIERSSSSS
Overview:
an intraday strategy built around two core principles:
Trend Confirmation using the 50 EMA (Exponential Moving Average) in relation to the VWAP (Volume-Weighted Average Price).
Entry Signals triggered by the 8 EMA crossing the 50 EMA in the direction of that confirmed trend.
Key Logic:
Bullish Trend if the 50 EMA is above VWAP. Only long entries are allowed when the 8 EMA crosses above the 50 EMA during that bullish phase.
Bearish Trend if the 50 EMA is below VWAP. Only short entries are allowed when the 8 EMA crosses below the 50 EMA during that bearish phase.
Intraday Focus: Trades are restricted to a user-defined session window (default 7:30 AM–11:30 AM), aligning entries/exits with peak intraday liquidity.
Exit Rule: Positions close automatically when the 8 EMA crosses back in the opposite direction of the entry.
Why It Works:
EMA + VWAP helps detect both immediate momentum (EMAs) and overall institutional bias (VWAP).
By confining trades to a set intraday window, the strategy aims to capture morning volatility while avoiding choppy afternoon or overnight sessions.
Customization:
Users can adjust EMA lengths, session times, or incorporate stops/targets for additional risk management.
It can be tested on various symbols and intraday timeframes to gauge performance and robustness.
Chart patterns

Smart Money Breakout & Order Block StrategySmart Money Breakout & Order Block Strategy
Created by Shubham
This strategy was developed by Shubham, designed to provide traders with a structured approach to smart money trading by combining breakout entries and order block reversals. It focuses on liquidity zones, volatility filters, and ATR-based stop management to adapt to different market conditions.
🔹 Strategy Overview
The Smart Money Breakout & Order Block Strategy is built for traders who want to identify institutional moves while avoiding false breakouts. This non-repainting strategy helps traders detect:
✅ Momentum Breakouts – Price breaking key support & resistance levels.
✅ Order Block Reversals – Institutional buying & selling zones.
✅ Dynamic Stop Management – No fixed SL/TP; uses ATR-based trailing stops.
✅ Volatility Filtering – Avoids choppy market conditions.
🔹 Trading Logic
1️⃣ Breakout Trading (Momentum Entries)
Long Entry: When price breaks above resistance with high volatility.
Short Entry: When price breaks below support with high volatility.
2️⃣ Order Block Reversals (Liquidity Entries)
Bullish Order Block: A strong price rejection after consecutive bearish candles signals smart money accumulation, triggering a long trade.
Bearish Order Block: A strong price rejection after consecutive bullish candles signals smart money distribution, triggering a short trade.
3️⃣ Volatility Filter (False Signal Prevention)
Uses normalized volatility to ensure breakouts are backed by strong momentum.
Helps filter out low-volume, choppy market conditions.
4️⃣ ATR-Based Position Management (Dynamic Stops & Trailing Stop)
No fixed SL/TP → Uses ATR-based stop-loss to adapt to market volatility.
Implements a trailing stop for maximizing potential profits in trending markets.
🔹 Key Features
✔️ Developed by Shubham – Designed for precision trading with institutional techniques.
✔️ Smart Money Concept – Identifies liquidity zones, breakouts, and order blocks.
✔️ Volatility Filter – Prevents false breakouts by analyzing market momentum.
✔️ ATR-Based Dynamic Stops – No fixed SL/TP, making it more adaptive.
✔️ Trailing Stop Functionality – Allows profits to run while reducing risk.
✔️ Fully Automated Execution – Uses TradingView’s strategy functions for automatic trade placement and exits.
✔️ Commission-Adjusted Backtesting – Includes realistic commission settings to ensure accurate results.
📊 Backtesting & Realistic Expectations
✅ Best for Higher Timeframes (1H, 4H, Daily) – Avoids market noise.
✅ Most Effective in Trending & Volatile Markets – Crypto, forex, indices, and commodities.
✅ Performance Varies with Market Conditions – Works best in strong trends.
✅ No Unrealistic Promises – Strategy performance is dependent on market behavior and risk management.
📌 IMPORTANT DISCLAIMER:
This strategy is provided for educational purposes only and should not be considered financial advice. Past performance in backtesting does not guarantee future results. Users should conduct their own research before applying this strategy in live markets.
🚀 Developed by Shubham – Test it yourself and see how it performs! 🚀

TrendSync Pro (SMC)📊 TrendSync Pro (SMC) – Advanced Trend-Following Strategy with HTF Alignment
Created by Shubham Singh
🔍 Strategy Overview
TrendSync Pro (SMC) is a precision-based smart trend-following strategy inspired by Smart Money Concepts (SMC). It combines: Real-time pivot-based trendline detection
Higher Time Frame (HTF) filtering to align trades with dominant trend
Risk management via adjustable Stop Loss (SL) and Take Profit (TP)
Directional control — trade only bullish, bearish, or both setups
Realistic backtesting using commissions and slippage
Pre-optimized profiles for scalpers, intraday, swing, and long-term traders
🧠 How It Works:
🔧 Strategy Settings Image:
beeimg.com
The strategy dynamically identifies trend direction by using swing high/low pivots. When a new pivot forms: It draws a trendline from the last significant pivot
Detects whether the trend is up (based on pivot lows) or down (based on pivot highs)
Waits for price to break above/below the trendline
Confirms with HTF price direction (HTF close > previous HTF close = bullish)
Only then it triggers a long or short trade
It exits either at TP, SL, or a manual trendline break
🛠️ Adjustable Parameters:
Trend Period: Length for pivot detection (affects sensitivity of trendlines)
HTF Timeframe: Aligns lower timeframe entries with higher timeframe direction
SL% and TP%: Customize your risk-reward profile
Commission & Slippage: Make backtests more realistic
Trade Direction: Choose to trade: Long only, Short only, or Both
🎛️ Trade Direction Control:
In settings, you can choose: Bullish Only: Executes only long entries
Bearish Only: Executes only short entries
Both: Executes both long and short entries when conditions are met
This allows you to align trades with your own market bias or external analysis.
📈 Entry Logic: Long Entry:
• Price crosses above trendline
• HTF is bullish (HTF close > previous close)
• Latest pivot is a low (trend is considered up)
Short Entry:
• Price crosses below trendline
• HTF is bearish (HTF close < previous close)
• Latest pivot is a high (trend is considered down)
📉 Exit Logic: Hit Take Profit or Stop Loss
Manual trendline invalidation: If price crosses opposite of the trend direction
⏰ Best Timeframes & Recommended Settings:
Scalping (1m to 5m):
HTF = 15m | Trend Period = 7
SL = 0.5% | TP = 1% to 2%
Intraday (15m to 30m):
HTF = 1H | Trend Period = 10–14
SL = 0.75% | TP = 2% to 3%
6 Hour Trading (30m to 1H):
HTF = 4H | Trend Period = 20
SL = 1% | TP = 4% to 6%
Swing Trading (4H to 1D):
HTF = 1D | Trend Period = 35
SL = 2% | TP = 8% to 12%
Long-Term Investing (1D+):
HTF = 1W | Trend Period = 50
SL = 3% | TP = 15%+
Note: These are recommended base settings. Adjust based on volatility, asset class, or personal trading style.
📸 Testing Note:
beeimg.com
TradingView limits test length to 20k bars (~40 trades on smaller timeframes). To show long-term results: Test on higher timeframes (e.g., 1H, 4H, 1D)
Share images of backtest result in description
Host longer test result screenshots on Imgur or any public drive
📍 Asset Behavior Insight:
This strategy works on multiple assets, including BTC, ETH, etc.
Performance varies by trend strength:
Sometimes BTC performs better than ETH
Other times ETH gives better results
That’s normal as both assets follow different volatility and trend behavior
It’s a trend-following setup. Longer and clearer the trend → better the results.
✅ Best Practices: Avoid ranging markets
Use proper SL/TP for each timeframe
Use directional filter if you already have a directional bias
Always forward test before going live
⚠️ Trading Disclaimer:
This script is for educational and backtesting purposes only. Trading involves risk. Always use risk management and never invest more than you can afford to lose.

Enhanced Range Filter Strategy with ATR TP/SLBuilt by Omotola
## **Enhanced Range Filter Strategy: A Comprehensive Overview**
### **1. Introduction**
The **Enhanced Range Filter Strategy** is a powerful technical trading system designed to identify high-probability trading opportunities while filtering out market noise. It utilizes **range-based trend filtering**, **momentum confirmation**, and **volatility-based risk management** to generate precise entry and exit signals. This strategy is particularly useful for traders who aim to capitalize on trend-following setups while avoiding choppy, ranging market conditions.
---
### **2. Key Components of the Strategy**
#### **A. Range Filter (Trend Determination)**
- The **Range Filter** smooths price fluctuations and helps identify clear trends.
- It calculates an **adjusted price range** based on a **sampling period** and a **multiplier**, ensuring a dynamic trend-following approach.
- **Uptrends:** When the current price is above the range filter and the trend is strengthening.
- **Downtrends:** When the price falls below the range filter and momentum confirms the move.
#### **B. RSI (Relative Strength Index) as Momentum Confirmation**
- RSI is used to **filter out weak trades** and prevent entries during overbought/oversold conditions.
- **Buy Signals:** RSI is above a certain threshold (e.g., 50) in an uptrend.
- **Sell Signals:** RSI is below a certain threshold (e.g., 50) in a downtrend.
#### **C. ADX (Average Directional Index) for Trend Strength Confirmation**
- ADX ensures that trades are only taken when the trend has **sufficient strength**.
- Avoids trading in low-volatility, ranging markets.
- **Threshold (e.g., 25):** Only trade when ADX is above this value, indicating a strong trend.
#### **D. ATR (Average True Range) for Risk Management**
- **Stop Loss (SL):** Placed **one ATR below** (for long trades) or **one ATR above** (for short trades).
- **Take Profit (TP):** Set at a **3:1 reward-to-risk ratio**, using ATR to determine realistic price targets.
- Ensures volatility-adjusted risk management.
---
### **3. Entry and Exit Conditions**
#### **📈 Buy (Long) Entry Conditions:**
1. **Price is above the Range Filter** → Indicates an uptrend.
2. **Upward trend strength is positive** (confirmed via trend counter).
3. **RSI is above the buy threshold** (e.g., 50, to confirm momentum).
4. **ADX confirms trend strength** (e.g., above 25).
5. **Volatility is supportive** (using ATR analysis).
#### **📉 Sell (Short) Entry Conditions:**
1. **Price is below the Range Filter** → Indicates a downtrend.
2. **Downward trend strength is positive** (confirmed via trend counter).
3. **RSI is below the sell threshold** (e.g., 50, to confirm momentum).
4. **ADX confirms trend strength** (e.g., above 25).
5. **Volatility is supportive** (using ATR analysis).
#### **🚪 Exit Conditions:**
- **Stop Loss (SL):**
- **Long Trades:** 1 ATR below entry price.
- **Short Trades:** 1 ATR above entry price.
- **Take Profit (TP):**
- Set at **3x the risk distance** to achieve a favorable risk-reward ratio.
- **Ranging Market Exit:**
- If ADX falls below the threshold, indicating a weakening trend.
---
### **4. Visualization & Alerts**
- **Colored range filter line** changes based on trend direction.
- **Buy and Sell signals** appear as labels on the chart.
- **Stop Loss and Take Profit levels** are plotted as dashed lines.
- **Gray background highlights ranging markets** where trading is avoided.
- **Alerts trigger on Buy, Sell, and Ranging Market conditions** for automation.
---
### **5. Advantages of the Enhanced Range Filter Strategy**
✅ **Trend-Following with Noise Reduction** → Helps avoid false signals by filtering out weak trends.
✅ **Momentum Confirmation with RSI & ADX** → Ensures that only strong, valid trades are executed.
✅ **Volatility-Based Risk Management** → ATR ensures adaptive stop loss and take profit placements.
✅ **Works on Multiple Timeframes** → Effective for day trading, swing trading, and scalping.
✅ **Visually Intuitive** → Clearly displays trade signals, SL/TP levels, and trend conditions.
---
### **6. Who Should Use This Strategy?**
✔ **Trend Traders** who want to enter trades with momentum confirmation.
✔ **Swing Traders** looking for medium-term opportunities with a solid risk-reward ratio.
✔ **Scalpers** who need precise entries and exits to minimize false signals.
✔ **Algorithmic Traders** using alerts for automated execution.
---
### **7. Conclusion**
The **Enhanced Range Filter Strategy** is a powerful trading tool that combines **trend-following techniques, momentum indicators, and risk management** into a structured, rule-based system. By leveraging **Range Filters, RSI, ADX, and ATR**, traders can improve trade accuracy, manage risk effectively, and filter out unfavorable market conditions.
This strategy is **ideal for traders looking for a systematic, disciplined approach** to capturing trends while **avoiding market noise and false breakouts**. 🚀

GQT GPT - Volume-based Support & Resistance Zones V2搞钱兔,搞钱是为了更好的生活。
Title: GQT GPT - Volume-based Support & Resistance Zones V2
Overview:
This strategy is implemented in PineScript v5 and is designed to identify key support and resistance zones based on volume-driven fractal analysis on a 1-hour timeframe. It computes fractal high points (for resistance) and fractal low points (for support) using volume moving averages and specific price action criteria. These zones are visually represented on the chart with customizable lines and zone fills.
Trading Logic:
• Entry: The strategy initiates a long position when the price crosses into the support zone (i.e., when the price drops into a predetermined support area).
• Exit: The long position is closed when the price enters the resistance zone (i.e., when the price rises into a predetermined resistance area).
• Time Frame: Trading signals are generated solely from the 1-hour chart. The strategy is only active within a specified start and end date.
• Note: Only long trades are executed; short selling is not part of the strategy.
Visualization and Parameters:
• Support/Resistance Zones: The zones are drawn based on calculated fractal values, with options to extend the lines to the right for easier tracking.
• Customization: Users can configure the appearance, such as line style (solid, dotted, dashed), line width, colors, and label positions.
• Volume Filtering: A volume moving average threshold is used to confirm the fractal signals, enhancing the reliability of the support and resistance levels.
• Alerts: The strategy includes alert conditions for when the price enters the support or resistance zones, allowing for timely notifications.
⸻
搞钱兔,搞钱是为了更好的生活。
标题: GQT GPT - 基于成交量的支撑与阻力区间 V2
概述:
本策略使用 PineScript v5 实现,旨在基于成交量驱动的分形分析,在1小时级别的图表上识别关键支撑与阻力区间。策略通过成交量移动平均线和特定的价格行为标准计算分形高点(阻力)和分形低点(支撑),并以自定义的线条和区间填充形式直观地显示在图表上。
交易逻辑:
• 进场条件: 当价格进入支撑区间(即价格跌入预设支撑区域)时,策略在没有持仓的情况下发出做多信号。
• 离场条件: 当价格进入阻力区间(即价格上升至预设阻力区域)时,持有多头头寸则会被平仓。
• 时间范围: 策略的信号仅基于1小时级别的图表,并且仅在指定的开始日期与结束日期之间生效。
• 备注: 本策略仅执行多头交易,不进行空头操作。
可视化与参数设置:
• 支撑/阻力区间: 根据计算得出的分形值绘制支撑与阻力线,可选择将线条延伸至右侧,便于后续观察。
• 自定义选项: 用户可以调整线条样式(实线、点线、虚线)、线宽、颜色及标签位置,以满足个性化需求。
• 成交量过滤: 策略使用成交量移动平均阈值来确认分形信号,提高支撑和阻力区间的有效性。
• 警报功能: 当价格进入支撑或阻力区间时,策略会触发警报条件,方便用户及时关注市场变化。
⸻

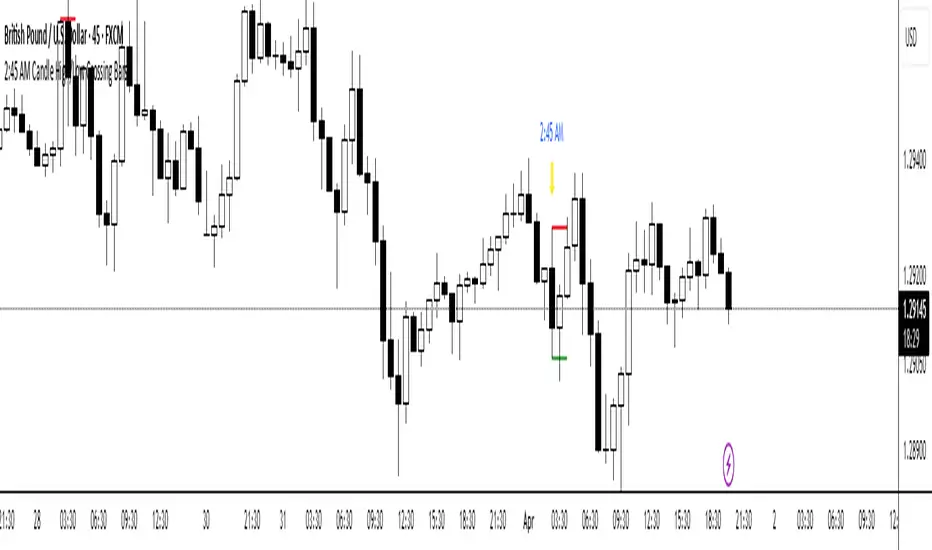
2:45 AM Candle High/Low Crossing Bars2:45 AM Candle High/Low Crossing Bars is an indicator that focuses on the trading view 2:45am NY TIME high and low indicating green for buy and red bars for sell, with the 2:45am new york time highlight/ If the next candle sweeps the low we buy while if it sweeps the high we sell, all time zoon must be the new York UTC time.
Box Chart Overlay StrategyExploring the Box Chart Overlay Strategy with RSI & Bollinger Confirmation
The “Box Chart Overlay Strategy by BD” is a sophisticated TradingView strategy script written in Pine Script (version 5). It combines a box charting method with two widely used technical indicators—Relative Strength Index (RSI) and Bollinger Bands—to generate trade entries. In this article, we break down the strategy’s components, its logic, and how it visually represents trading signals on the chart.
1. Strategy Setup and User Inputs
Strategy Declaration
At the top of the script, the strategy is declared with key parameters:
Overlay: The indicator is plotted directly on the price chart.
Initial Capital & Position Sizing: It uses a simulated trading account with an initial capital of 10,000 and positions sized as a percentage of equity (10% by default).
Commission: A commission of 0.1% is factored into trades.
Input Parameters
The strategy is highly customizable. Users can adjust various inputs such as:
Box Settings:
Box Size (RSboxSize): Defines the size of each price “box.”
Box Options: Choose from three modes:
Standard: Boxes are calculated continuously from the start of the chart.
Anchored: The first box is fixed at a specified time and price.
Daily Reset: The boxes reset each day based on a defined session time.
Color Customizations:
Options to customize the appearance of boxes, borders, labels, and even repainting the candles based on the current price’s relation to box levels.
RSI Settings:
Length, overbought, and oversold levels are set to filter trades.
Bollinger Bands Settings:
Users can set the length of the moving average and the multiplier for standard deviation, which will be used to compute the upper and lower bands.
2. The Box Chart Mechanism
Box Construction
The core idea of a box chart is to group price movement into discrete blocks—or boxes—of a fixed size. In this strategy:
Standard Mode:
The script calculates boxes starting at a rounded price level. When the price moves sufficiently above or below the current box’s boundaries, a new box is drawn.
Anchored and Daily Reset Modes:
These modes allow traders to control where the box calculations begin or to reset them during a specific intraday session.
Visual Elements
Several custom functions handle the visual components:
drawBoxUp() and drawBoxDn():
These functions create boxes in bullish or bearish directions respectively, based on whether the price has exceeded the current box’s high or low.
drawLines() and drawLabels():
Lines are drawn to extend the current box levels, and labels are updated to display key levels or the “remainder” (the difference needed to trigger a new box).
Projected Boxes:
A “projected” box is drawn to indicate potential upcoming box levels, providing an additional visual cue about the price action.
3. Integrating RSI and Bollinger Bands for Trade Confirmation
RSI Integration
The strategy computes the RSI using a user-defined length. It then uses the following conditions to validate entries:
Long Trades (Box Up):
The strategy waits for the RSI to be at or below the oversold level before considering a long entry.
Short Trades (Box Down):
It requires the RSI to be at or above the overbought level before triggering a short entry.
Bollinger Bands Confirmation
In addition to the RSI filter:
For Long Entries:
The price must be at or below the lower Bollinger Band.
For Short Entries:
The price must be at or above the upper Bollinger Band.
By combining these filters with the box breakout logic, the strategy aims to enhance the quality of its trade signals.
4. Dynamic Trade Entries and Alerts
Box Logic and Entry Functions
Two key functions—BoxUpFunc() and BoxDownFunc()—handle the creation of new boxes and also check if trade conditions are met:
When a new box is drawn, the script evaluates if the RSI and Bollinger conditions align.
If conditions are satisfied, the script places an entry order:
Long Entry: Initiated when the price moves upward, RSI indicates oversold, and the price touches or falls below the lower Bollinger Band.
Short Entry: Triggered when the price falls downward, RSI signals overbought, and the price touches or exceeds the upper Bollinger Band.
Alerts
Built-in alert functions notify traders when a new box level is reached. Users can set custom alert messages to ensure they are aware of potential trade opportunities as soon as the conditions are met.
5. Visual Enhancements and Candle Repainting
The script also includes options for repainting candles based on their relation to the current box’s boundaries:
Above, Below, or Within the Box:
Candles are color-coded using user-defined colors, making it easier to visually assess where the price is in relation to the box levels.
Labels and Lines:
These continuously update to reflect current levels and provide an immediate visual reference for potential breakout points.
Conclusion
The Box Chart Overlay Strategy by BD is a multi-faceted approach that marries the traditional box chart technique with modern technical indicators—RSI and Bollinger Bands—to refine entry signals. By offering various customization options for box creation, visual styling, and confirmation criteria, the strategy allows traders to adapt it to different market conditions and personal trading styles. Whether you prefer a continuously running “Standard” mode or a more controlled “Anchored” or “Daily Reset” approach, this strategy provides a robust framework for integrating price action with momentum and volatility measures.

Qullamaggie [Modified] | FractalystWhat's the purpose of this strategy?
The strategy aims to identify high-probability breakout setups in trending markets, inspired by Kristjan "Qullamaggie" Kullamägi’s approach.
It focuses on capturing explosive price moves after periods of consolidation, using technical criteria like moving averages, breakouts, trailing stop-loss and momentum confirmation.
Ideal for swing traders seeking to ride strong trends while managing risk.
----
How does the strategy work?
The strategy follows a systematic process to capture high-momentum breakouts:
Pre-Breakout Criteria:
Prior Price Surge: Identifies stocks that have rallied 30-100%+ in recent month(s), signaling strong underlying momentum (per Qullamaggie’s volatility expansion principles).
Consolidation Phase: Looks for a tightening price range (e.g., flag, pennant, or tight base), indicating a potential "coiling" before continuation.
Trend Confirmation: Uses moving averages (e.g., 20/50/200 EMA) to ensure the stock is trading above key averages on the daily chart, confirming an uptrend.
Price Break: Enters when price clears the consolidation high with conviction.
Risk Management:
Initial Stop Loss: Placed below the consolidation low or a recent swing point to limit downside.
Break-Even Adjustment: Moves stop loss to breakeven once the trade reaches 1.5x risk-to-reward (RR), securing a "free trade" while letting winners run.
Trailing Stop (Unique Edge):
Market Structure Trailing: Instead of trailing via moving averages, the stop is dynamically adjusted using structural invalidation level. This adapts to price action, allowing the trade to stay open during volatile retracements while locking in gains as new structure forms.
Why This Matters: Most strategies use rigid trailing stops (e.g., below the 10EMA), which often exit prematurely in choppy markets. By trailing based on structure, this strategy avoids "noise" and captures larger trends, directly boosting overall returns.
----
What markets or timeframes is this suited for?
This is a long-only strategy designed for trending markets, and it performs best in:
Markets: Stocks (especially high-growth, liquid equities), cryptocurrencies (major pairs with strong volatility), commodities (e.g., oil, gold), and futures (index/commodity futures).
Timeframes: Primarily daily charts for swing trades (1-30 day holds), though weekly charts can help confirm broader trends.
Key Advantage: The TradingView script allows instant backtesting with adjustable parameters
You can:
- Test historical performance across multiple markets to identify which assets align best with the strategy.
- Optimize settings (e.g., trailing stop sensitivity, moving averages etc.) to match a market’s volatility profile.
Build a diversified portfolio by filtering for markets that show consistent profitability in backtests.
For example, you might discover cryptos require tighter trailing stops due to volatility, while stocks thrive with wider structural stops. The script automates this analysis, letting you to trade confidently.
----
What indicators or tools does the strategy use?
The strategy combines customizable technical tools with strict anti-lookahead safeguards:
Core Indicators:
Moving Averages: Adjustable periods (e.g., 20/50/200 EMA or SMA) and timeframes (daily/weekly) to confirm trend alignment. Users can test combinations (e.g., 10EMA vs. 20EMA) to optimize for specific markets.
Breakout Parameters:
Consolidation Length: Adjustable window to define the "tightness" of the pre-breakout pattern.
Entry Models: Flexible entry logics (Breakouts and fractals)
Anti-Lookahead Design:
All calculations (e.g., moving averages, consolidation ranges, volume averages) use only closed/confirmed data available at the time of the signal.
----
How do I manage risk with this strategy?
The strategy prioritizes customizable risk controls to align with your trading style and account size:
User-Defined Risk Inputs:
Risk Per Trade: Set a % of Equity (e.g., 1-2%) to determine position size. The strategy auto-calculates shares/contracts to match your selected risk per trade.
Flexibility: Choose between fixed risk or equity-based scaling.
The script adjusts position sizing dynamically based on your selection.
Pyramiding Feature:
Customizable Entries: Adjust the number of pyramiding trades allowed (e.g., 1-3 additional positions) in the strategy settings. Each new entry is triggered only if the prior trade hits its 1.5x RR target and the trend remains intact.
Risk-Scaled Additions: New positions use profits from prior trades, compounding gains without increasing initial risk.
Risk-Free Trade Mechanic:
Once a trade reaches 1.5x RR, the stop loss is moved to breakeven, eliminating downside risk.
The strategy then opens a new position (if pyramiding is enabled) using a portion of the locked-in profit. This "snowballs" winners while keeping total capital exposure stable.
Impact on Net Profit & Drawdown:
Net Profit Boost: Pyramiding lets you ride multi-leg trends aggressively. For example, a 100% runner could generate 2-3x more profit vs. a single-entry approach.
Controlled Drawdowns: Since new positions are funded by profits (not initial capital), max drawdown stays anchored to your original risk per trade (e.g., 1-2% of account). Even if later entries fail, the breakeven stop on prior trades protects overall equity.
Why This Works: Most strategies either over-leverage (increasing drawdowns) or exit too early. By recycling profits into new positions only after securing risk-free capital, this approach mimics hedge fund "scaling in" tactics while staying retail-trader friendly.
----
How does the strategy identify market structure for its trailing stoploss?
The strategy identifies market structure by utilizing an efficient logic with for loops to pinpoint the first swing candle that features a pivot of 2. This marks the beginning of the break of structure, where the market's previous trend or pattern is considered invalidated or changed.
----
What are the underlying calculations?
The underlying calculations involve:
Identifying Swing Points: The strategy looks for swing highs (marked with blue Xs) and swing lows (marked with red Xs). A swing high is identified when a candle's high is higher than the highs of the candles before and after it. Conversely, a swing low is when a candle's low is lower than the lows of the candles before and after it.
Break of Structure (BOS):
Bullish BOS: This occurs when the price breaks above the swing high level of the previous structure, indicating a potential shift to a bullish trend.
Bearish BOS: This happens when the price breaks below the swing low level of the previous structure, signaling a potential shift to a bearish trend.
Structural Liquidity and Invalidation:
Structural Liquidity: After a break of structure, liquidity levels are updated to the first swing high in a bullish BOS or the first swing low in a bearish BOS.
Structural Invalidation: If the price moves back to the level of the first swing low before the bullish BOS or the first swing high before the bearish BOS, it invalidates the break of structure, suggesting a potential reversal or continuation of the previous trend.
This method provides users with a technical approach to filter market regimes, offering an advantage by minimizing the risk of overfitting to historical data, which is often a concern with traditional indicators like moving averages.
By focusing on identifying pivotal swing points and the subsequent breaks of structure, the strategy maintains a balance between sensitivity to market changes and robustness against historical data anomalies, ensuring a more adaptable and potentially more reliable market analysis tool.
----
What entry criteria are used in this script?
The script uses two entry models for trading decisions: BreakOut and Fractal.
Underlying Calculations:
Breakout: The script records the most recent swing high by storing it in a variable. When the price closes above this recorded level, and all other predefined conditions are satisfied, the script triggers a breakout entry. This approach is considered conservative because it waits for the price to confirm a breakout above the previous high before entering a trade. As shown in the image, as soon as the price closes above the new candle (first tick), the long entry gets taken. The stop-loss is initially set and then moved to break-even once the price moves in favor of the trade.
Fractal: This method involves identifying a swing low with a period of 2, which means it looks for a low point where the price is lower than the two candles before and after it. Once this pattern is detected, the script executes the trade. This is an aggressive approach since it doesn't wait for further price confirmation. In the image, this is represented by the 'Fractal 2' label where the script identifies and acts on the swing low pattern.
----
What type of stop-loss identification method are used in this strategy?
This strategy employs two types of stop-loss methods: Initial Stop-loss and Trailing Stop-Loss.
Underlying Calculations:
Initial Stop-loss:
ATR Based: The strategy uses the Average True Range (ATR) to set an initial stop-loss, which helps in accounting for market volatility without predicting price direction.
Calculation:
- First, the True Range (TR) is calculated for each period, which is the greatest of:
- Current Period High - Current Period Low
- Absolute Value of Current Period High - Previous Period Close
- Absolute Value of Current Period Low - Previous Period Close
- The ATR is then the moving average of these TR values over a specified period, typically 14 periods by default. This ATR value can be used to set the stop-loss at a distance from the entry price that reflects the current market volatility.
Swing Low Based:
For this method, the stop-loss is set based on the most recent swing low identified in the market structure analysis. This approach uses the lowest point of the recent price action as a reference for setting the stop-loss.
Trailing Stop-Loss:
The strategy uses structural liquidity and structural invalidation levels across multiple timeframes to adjust the stop-loss once the trade is profitable. This method involves:
Detecting Structural Liquidity: After a break of structure, the liquidity levels are updated to the first swing high in a bullish scenario or the first swing low in a bearish scenario. These levels serve as potential areas where the price might find support or resistance, allowing the stop-loss to trail the price movement.
Detecting Structural Invalidation: If the price returns to the level of the first swing low before a bullish break of structure or the first swing high before a bearish break of structure, it suggests the trend might be reversing or invalidating, prompting the adjustment of the stop-loss to lock in profits or minimize losses.
By using these methods, the strategy dynamically adjusts the initial stop-loss based on market volatility, helping to protect against adverse price movements while allowing for enough room for trades to develop. The ATR-based stop-loss adapts to the current market conditions by considering the volatility, ensuring that the stop-loss is not too tight during volatile periods, which could lead to premature exits, nor too loose during calm markets, which might result in larger losses. Similarly, the swing low based stop-loss provides a logical exit point if the market structure changes unfavorably.
Each market behaves differently across various timeframes, and it is essential to test different parameters and optimizations to find out which trailing stop-loss method gives you the desired results and performance. This involves backtesting the strategy with different settings for the ATR period, the distance from the swing low, and how the trailing stop-loss reacts to structural liquidity and invalidation levels.
Through this process, you can tailor the strategy to perform optimally in different market environments, ensuring that the stop-loss mechanism supports the trade's longevity while safeguarding against significant drawdowns.
----
What type of break-even method is used in this strategy? What are the underlying calculations?
Moves the initial stop-loss to the entry price when the price reaches a certain RR ratio.
Calculation:
Break-even level = Entry Price + (Initial Risk * RR Ratio)
----
What tables are available in this script?
- Summary: Provides a general overview, displaying key performance parameters such as Net Profit, Profit Factor, Max Drawdown, Average Trade, Closed Trades and more.
Total Commission: Displays the cumulative commissions incurred from all trades executed within the selected backtesting window. This value is derived by summing the commission fees for each trade on your chart.
Average Commission: Represents the average commission per trade, calculated by dividing the Total Commission by the total number of closed trades. This metric is crucial for assessing the impact of trading costs on overall profitability.
Avg Trade: The sum of money gained or lost by the average trade generated by a strategy. Calculated by dividing the Net Profit by the overall number of closed trades. An important value since it must be large enough to cover the commission and slippage costs of trading the strategy and still bring a profit.
MaxDD: Displays the largest drawdown of losses, i.e., the maximum possible loss that the strategy could have incurred among all of the trades it has made. This value is calculated separately for every bar that the strategy spends with an open position.
Profit Factor: The amount of money a trading strategy made for every unit of money it lost (in the selected currency). This value is calculated by dividing gross profits by gross losses.
Avg RR: This is calculated by dividing the average winning trade by the average losing trade. This field is not a very meaningful value by itself because it does not take into account the ratio of the number of winning vs losing trades, and strategies can have different approaches to profitability. A strategy may trade at every possibility in order to capture many small profits, yet have an average losing trade greater than the average winning trade. The higher this value is, the better, but it should be considered together with the percentage of winning trades and the net profit.
Winrate: The percentage of winning trades generated by a strategy. Calculated by dividing the number of winning trades by the total number of closed trades generated by a strategy. Percent profitable is not a very reliable measure by itself. A strategy could have many small winning trades, making the percent profitable high with a small average winning trade, or a few big winning trades accounting for a low percent profitable and a big average winning trade. Most mean-reversion successful strategies have a percent profitability of 40-80% but are profitable due to risk management control.
BE Trades: Number of break-even trades, excluding commission/slippage.
Losing Trades: The total number of losing trades generated by the strategy.
Winning Trades: The total number of winning trades generated by the strategy.
Total Trades: Total number of taken traders visible your charts.
Net Profit: The overall profit or loss (in the selected currency) achieved by the trading strategy in the test period. The value is the sum of all values from the Profit column (on the List of Trades tab), taking into account the sign.
- Monthly: Displays performance data on a month-by-month basis, allowing users to analyze performance trends over each month and year.
- Weekly: Displays performance data on a week-by-week basis, helping users to understand weekly performance variations.
- UI Table: A user-friendly table that allows users to view and save the selected strategy parameters from user inputs. This table enables easy access to key settings and configurations, providing a straightforward solution for saving strategy parameters by simply taking a screenshot with Alt + S or ⌥ + S.
User-input styles and customizations:
Please note that all background colors in the style are disabled by default to enhance visualization.
How to Use This Strategy to Create a Profitable Edge and Systems?
Choose Your Strategy mode:
- Decide whether you are creating an investing strategy or a trading strategy.
Select a Market:
- Choose a one-sided market such as stocks, indices, or cryptocurrencies.
Historical Data:
- Ensure the historical data covers at least 10 years of price action for robust backtesting.
Timeframe Selection:
- Choose the timeframe you are comfortable trading with. It is strongly recommended to use a timeframe above 15 minutes to minimize the impact of commissions/slippage on your profits.
Set Commission and Slippage:
- Properly set the commission and slippage in the strategy properties according to your broker/prop firm specifications.
Parameter Optimization:
- Use trial and error to test different parameters until you find the performance results you are looking for in the summary table or, preferably, through deep backtesting using the strategy tester.
Trade Count:
- Ensure the number of trades is 200 or more; the higher, the better for statistical significance.
Positive Average Trade:
- Make sure the average trade is above zero.
(An important value since it must be large enough to cover the commission and slippage costs of trading the strategy and still bring a profit.)
Performance Metrics:
- Look for a high profit factor, and net profit with minimum drawdown.
- Ideally, aim for a drawdown under 20-30%, depending on your risk tolerance.
Refinement and Optimization:
- Try out different markets and timeframes.
- Continue working on refining your edge using the available filters and components to further optimize your strategy.
What Makes This Strategy Unique?
This strategy combines flexibility, smart risk management, and momentum focus in a way that’s rare and practical:
1. Adapts to Any Market Rhythm
Works on daily, weekly, or intraday charts without code changes.
Uses two entry types: classic breakouts (like trending stocks) or fractal patterns (to avoid false starts).
2. Smarter Stop-Loss System
No rigid rules: Stops adjust based on price structure (e.g., new “higher lows”), not fixed percentages.
Avoids whipsaws: Tightens stops only when the trend strengthens, not in choppy markets.
3. Safe Profit-Boosting Pyramiding
Adds new positions only after prior trades are risk-free (stops moved above breakeven).
Scales up using locked-in profits, not new capital, to grow gains safely.
4. Built-In Momentum Check
Tracks 1/3/6-month price growth to spotlight stocks with strong, lasting momentum.
Terms and Conditions | Disclaimer
Our charting tools are provided for informational and educational purposes only and should not be construed as financial, investment, or trading advice. They are not intended to forecast market movements or offer specific recommendations. Users should understand that past performance does not guarantee future results and should not base financial decisions solely on historical data.
Built-in components, features, and functionalities of our charting tools are the intellectual property of @Fractalyst Unauthorized use, reproduction, or distribution of these proprietary elements is prohibited.
- By continuing to use our charting tools, the user acknowledges and accepts the Terms and Conditions outlined in this legal disclaimer and agrees to respect our intellectual property rights and comply with all applicable laws and regulations.

Scalping Strategy Signal v2 by [INFINITYTRADER]Overview
This Pine Script (v6) implements a scalping strategy that uses higher timeframe data (default: 4H) to generate entry and exit signals, originally designed for the 15-minute timeframe with an option for 30-minute charts. The "Scalping Strategy Signal v2 by " integrates moving averages, RSI, volume, ATR, and candlestick patterns to identify trading opportunities. It features adjustable risk management with ATR-based stop-loss, take-profit, and trailing stops, plus dynamic position sizing based on user-set capital. Trades trigger only on the higher timeframe candle close (e.g., 4H) to limit activity within the same period. This closed-source script offers a structured scalping approach, blending multiple entry methods and risk controls for adaptability across market conditions.
What Makes It Unique
Unlike typical scalping scripts relying on single-indicator triggers (e.g., RSI alone or basic MA crossovers), this strategy combines four distinct entry methods—standard MA crossovers, RSI-based momentum shifts, trend-following shorts, and candlestick pattern logic—evaluated on a 4H timeframe for confirmation. This multi-layered design, paired with re-entry logic after losses and a mix of manual, ATR-based, and trailing exits, aims to balance trade frequency and reliability. The higher timeframe filter adds precision not commonly found in simpler scalping tools, while the 30-minute option enhances consistency by reducing noise.
How It Works
Timeframe Logic
Runs on a base timeframe (designed for 15-minute charts, with a 30-minute option) while pulling data from a user-chosen higher timeframe (default: 4H) for signal accuracy.
Limits entries to the close of each 4H candle, ensuring one trade per period to avoid over-trading in volatile conditions.
Indicators and Data
Moving Averages : Employs 21-period and 50-period simple moving averages on the higher timeframe to detect trends and signal entries/exits.
Volume : Requires volume to exceed 70% of its 20-period average on the higher timeframe for momentum confirmation.
RSI : Uses a 14-period RSI for overbought/oversold filtering and a 6-period RSI for precise entry timing.
ATR : Applies a 14-period Average True Range on the higher timeframe to set adaptive stop-loss and take-profit levels.
Candlestick Patterns : Analyzes consecutive green or red 4H bars for trend continuation signals.
Why These Indicators
The blend of moving averages, RSI, volume, ATR, and candlestick patterns forms a robust scalping framework. Moving averages establish trend context, RSI filters momentum and avoids extremes, volume confirms market activity, ATR adjusts risk to volatility, and candlestick patterns enhance entry timing with price action insights. Together, they target small, frequent moves in flat or trending markets, with the 4H filter reducing false signals common in lower-timeframe scalping.
Entry Conditions
Four entry methods are evaluated at the 4H candle close:
Standard Long Entry: Price crosses above the 21-period moving average, volume exceeds 70% of its 20-period average, and the 1H 14-period RSI is below 70—confirms uptrend momentum.
Special Long Entry: The 6-period RSI crosses above 23, price is more than 1.5 times the ATR from the 21-period moving average, and price exceeds its prior close—targets oversold bounces with a stop-loss at the 4H candle’s low.
Short Entries:
- RSI-Based: The 6-period RSI crosses below 68 with volume support—catches overbought pullbacks.
- Trend-Based: Price crosses below the 21-period moving average, volume is above 70% of its average, and the 1H 14-period RSI is above 30—confirms downtrends.
Red/Green Bar Logic: Two consecutive green 4H bars for longs or red 4H bars for shorts—uses candlestick patterns for continuation, with a tight stop-loss from the base timeframe candle.
Re-Entry Logic
Long : After a losing special long, triggers when the 6-period RSI crosses 27 and price crosses the 21-period moving average.
Short : After a losing short, triggers when the 6-period RSI crosses 50 and price crosses below the 21-period moving average.
Purpose: Offers recovery opportunities with stricter conditions.
Exit Conditions
Manual Exits: Longs close if the 21-period MA crosses below the 50-period MA or the 1H 14-period RSI exceeds 68; shorts close if the 21-period MA crosses above the 50-period MA or RSI drops below 25.
ATR-Based TP/SL: Stop-loss is entry price ± ATR × 1.5 (default); take-profit is ± ATR × 4 (default), checked at 4H close.
Trailing Stop: Adjusts ±6x ATR from peak/trough, closing if price retraces within 1x ATR.
Special/Tight SL: Special longs exit if price opens below the 4H candle’s low; 4th method entries use the base timeframe candle’s low/high, checked every bar.
Position Sizing
Bases trade value on user-set capital (default: 100 USDT), dividing by the higher timeframe close price for dynamic sizing.
Visualization
Displays a table at the bottom-right with current/previous signals, TP/SL levels, equity, trading pair, and trade size—color-coded for clarity (green for buy, red for sell).
Inputs
Initial Capital (USDT): Sets trade value (default: 100, min: 1).
ATR Stop-Loss Multiplier: Adjusts SL distance (default: 1.5, min: 1).
ATR Take-Profit Multiplier: Adjusts TP distance (default: 4, min: 1).
Higher Timeframe: Selects analysis timeframe (options: 1m, 5m, 15m, 30m, 1H, 4H, D, W; default: 4H).
Usage Notes
Intended Timeframe: Designed for 15-minute charts with 4H confirmation for precision and frequency; 30-minute charts improve consistency by reducing noise.
Backtesting: Adjust ATR multipliers and capital to match your asset’s volatility and risk tolerance.
Risk Management: Combines manual, ATR, and trailing exits—monitor to avoid overexposure.
Limitations: 4H candle-close dependency may delay entries in fast markets; RSI/volume filters can reduce trades in low-momentum periods.
Backtest Observations
Tested on BTC/USDT (4H higher timeframe, default settings: Initial Capital: 100 USDT, ATR SL: 1.5x, ATR TP: 4x) across market conditions, comparing 15-minute and 30-minute charts:
Bull Market (Jul 2023 - Dec 2023):
15-Minute: 277 long, 219 short; Win Rate: 42.74%; P&L: 108%; Drawdown: 1.99%; Profit Factor: 3.074.
30-Minute: 257 long, 215 short; Win Rate: 49.58%; P&L: 116.85%; Drawdown: 2.34%; Profit Factor: 3.14.
Notes: Moving average crossovers and green bar patterns suited this bullish phase; 30-minute improved win rate and P&L by filtering weaker signals.
Bear Market (Jan 2022 - Jun 2022):
15-Minute: 262 long, 211 short; Win Rate: 44.4%; P&L: 239.80%; Drawdown: 3.74%; Profit Factor: 3.419.
30-Minute: 250 long, 200 short; Win Rate: 52.22%; P&L: 258.77%; Drawdown: 5.34%; Profit Factor: 3.461.
Notes: Red bar patterns and RSI shorts thrived in the downtrend; 30-minute cut choppy reversals for better consistency.
Flat Market (Jan 2021 - Jun 2021):
15-Minute: 280 long, 208 short; Win Rate: 51.84%; P&L: 340.33%; Drawdown: 9.59%; Profit Factor: 2.924.
30-Minute: 270 long, 209 short; Win Rate: 55.11%; P&L: 315.42%; Drawdown: 7.21%; Profit Factor: 2.598.
Notes: High trade frequency and P&L showed strength in ranges; 30-minute lowered drawdown for better risk control.
Results reflect historical performance on BTC/USDT with default settings—users should test on their assets and timeframes. Past performance does not guarantee future results and is shared only to illustrate the strategy’s behavior.
Why It Works Well in Flat Markets
A "flat market" lacks strong directional trends, with price oscillating around moving averages, as in Jan 2021 - Jun 2021 for BTC/USDT. This strategy excels here because its crossover-based entries trigger frequently in tight ranges. In trending markets, an exit might not be followed by a new entry without a pullback, but flat markets produce multiple crossovers, enabling more trades. ATR-based TP/SL and trailing stops capture these small swings, while RSI and volume filters ensure momentum, driving high P&L and win rates.
Technical Details
Built in Pine Script v6 for TradingView compatibility.
Prevents overlapping trades with long/short checks.
Handles edge cases like zero division and auto-detects the trading pair’s base currency (e.g., BTC from BTCUSDT).
This strategy suits scalpers seeking structured entries and risk management. Test on 15-minute or 30-minute charts to match your style and market conditions.

PowerZone Trading StrategyExplanation of the PowerZone Trading Strategy for Your Users
The PowerZone Trading Strategy is an automated trading strategy that detects strong price movements (called "PowerZones") and generates signals to enter a long (buy) or short (sell) position, complete with predefined take profit and stop loss levels. Here’s how it works, step by step:
1. What is a PowerZone?
A "PowerZone" (PZ) is a zone on the chart where the price has shown a significant and consistent movement over a specific number of candles (bars). There are two types:
Bullish PowerZone (Bullish PZ): Occurs when the price rises consistently over several candles after an initial bearish candle.
Bearish PowerZone (Bearish PZ): Occurs when the price falls consistently over several candles after an initial bullish candle.
The code analyzes:
A set number of candles (e.g., 5, adjustable via "Periods").
A minimum percentage move (adjustable via "Min % Move for PowerZone") to qualify as a strong zone.
Whether to use the full candle range (highs and lows) or just open/close prices (toggle with "Use Full Range ").
2. How Does It Detect PowerZones?
Bullish PowerZone:
Looks for an initial bearish candle (close below open).
Checks that the next candles (e.g., 5) are all bullish (close above open).
Ensures the total price movement exceeds the minimum percentage set.
Defines a range: from the high (or open) to the low of the initial candle.
Bearish PowerZone:
Looks for an initial bullish candle (close above open).
Checks that the next candles are all bearish (close below open).
Ensures the total price movement exceeds the minimum percentage.
Defines a range: from the high to the low (or close) of the initial candle.
These zones are drawn on the chart with lines: green or white for bullish, red or blue for bearish, depending on the color scheme ("DARK" or "BRIGHT").
3. When Does It Enter a Trade?
The strategy waits for a breakout from the PowerZone range to enter a trade:
Buy (Long): When the price breaks above the high of a Bullish PowerZone.
Sell (Short): When the price breaks below the low of a Bearish PowerZone.
The position size is set to 100% of available equity (adjustable in the code).
4. Take Profit and Stop Loss
Take Profit (TP): Calculated as a multiple (adjustable via "Take Profit Factor," default 1.5) of the PowerZone height. For example:
For a buy, TP = Entry price + (PZ height × 1.5).
For a sell, TP = Entry price - (PZ height × 1.5).
Stop Loss (SL): Calculated as a multiple (adjustable via "Stop Loss Factor," default 1.0) of the PZ height, placed below the range for buys or above for sells.
5. Visualization on the Chart
PowerZones are displayed with lines on the chart (you can hide them with "Show Bullish Channel" or "Show Bearish Channel").
An optional info panel ("Show Info Panel") displays key levels: PZ high and low, TP, and SL.
You can also enable brief documentation on the chart ("Show Documentation") explaining the basic rules.
6. Alerts
The code generates automatic alerts in TradingView:
For a bullish breakout: "Bullish PowerZone Breakout - LONG!"
For a bearish breakdown: "Bearish PowerZone Breakdown - SHORT!"
7. Customization
You can tweak:
The number of candles to detect a PZ ("Periods").
The minimum percentage move ("Min % Move").
Whether to use highs/lows or just open/close ("Use Full Range").
The TP and SL factors.
The color scheme and what elements to display on the chart.
Practical Example
Imagine you set "Periods = 5" and "Min % Move = 2%":
An initial bearish candle appears, followed by 5 consecutive bullish candles.
The total move exceeds 2%.
A Bullish PowerZone is drawn with a high and low.
If the price breaks above the high, you enter a long position with a TP 1.5 times the PZ height and an SL equal to the height below.
The system executes the trade and exits automatically at TP or SL.
Conclusion
This strategy is great for capturing strong price movements after consolidation or momentum zones. It’s automated, visual, and customizable, making it useful for both beginner and advanced traders. Try it out and adjust it to fit your trading style!

Reversal & Breakout Strategy with ORB### Reversal & Breakout Strategy with ORB
This strategy combines three distinct trading approaches—reversals, trend breakouts, and opening range breakouts (ORB)—into a single, cohesive system. The goal is to capture high-probability setups across different market conditions, leveraging a mashup of technical indicators for confirmation and risk management. Below, I’ll explain why this combination works, how the components interact, and how to use it effectively.
#### Why the Mashup?
- **Reversals**: Identifies overextended moves using RSI (overbought/oversold) and SMA50 crosses, filtered by VWAP and SMA200 trend direction. This targets mean-reversion opportunities in trending markets.
- **Breakouts**: Uses EMA9/EMA20 crossovers with VWAP and SMA200 confirmation to catch momentum-driven trend continuations.
- **Opening Range Breakout (ORB)**: Detects early momentum by breaking the high/low of a user-defined opening range (default: 15 bars) with volume confirmation. This adds a time-based edge, ideal for intraday trading.
The synergy comes from blending these methods: reversals catch pullbacks, breakouts ride trends, and ORB exploits early volatility—all filtered by trend (SMA200) and anchored by VWAP for context.
#### How It Works
1. **Indicators**:
- **EMA9/EMA20**: Fast-moving averages for breakout signals.
- **SMA50**: Medium-term trend filter for reversals.
- **SMA200**: Long-term trend direction to align trades.
- **RSI (14)**: Measures overbought (>70) or oversold (<30) conditions.
- **VWAP**: Acts as a dynamic support/resistance level.
- **ATR (14)**: Sets stop-loss distance (default: 1.5x ATR).
- **Volume**: Confirms ORB breakouts (1.5x average volume of opening range).
2. **Entry Conditions**:
- **Long**: Triggers on reversal (SMA50 cross + RSI < 30 + below VWAP + uptrend), breakout (EMA9 > EMA20 + above VWAP + uptrend), or ORB (break above opening range high + volume).
- **Short**: Triggers on reversal (SMA50 cross + RSI > 70 + above VWAP + downtrend), breakout (EMA9 < EMA20 + below VWAP + downtrend), or ORB (break below opening range low + volume).
3. **Risk Management**:
- Risks 5% of equity per trade (based on the initial capital set in the strategy tester).
- Stop-loss: Based on lowest low/highest high over 7 bars ± 1.5x ATR.
- Targets: Two exits at 1:1 and 1:2 risk:reward (50% of position at each).
- Break-even: Stop moves to entry price after the first target is hit.
4. **Backtesting Settings**:
- Commission: Hardcoded at 0.1% per trade (realistic for most brokers).
- Slippage: Hardcoded at 2 ticks (realistic for most markets).
- Tested on datasets yielding 100+ trades (e.g., 2-min or 5-min charts over months).
#### How to Use It
- **Timeframe**: Works best on intraday (2-min, 5-min) or daily charts. Adjust `Opening Range Bars` (e.g., 15 bars = 30 min on 2-min chart) for your timeframe.
- **Settings**:
- Set your initial equity in the TradingView strategy tester’s "Properties" tab under "Initial Capital" (e.g., $10,000). The script automatically risks 5% of this equity per trade.
- Adjust `Stop Loss ATR Multiplier` or `Risk:Reward Targets` based on your risk tolerance.
- Note that commission (0.1%) and slippage (2 ticks) are fixed in the script for backtesting consistency.
- **Execution**: Enter on signal, monitor plotted stop (red) and targets (green/blue). The strategy supports pyramiding (up to 2 positions) for scaling into trends.
#### Backtesting Notes
Results are realistic with commission (0.1%) and slippage (2 ticks) included. For a sufficient sample, test on volatile instruments (e.g., stocks, forex) over 3-6 months on lower timeframes. The default 1.5x ATR stop may seem wide, but it’s justified to avoid premature exits in volatile markets—feel free to tweak it with justification. The script assumes an initial capital of $10,000 in the strategy tester for the 5% risk calculation (e.g., $500 risk per trade); adjust this in the "Properties" tab as needed.
This mashup isn’t just a random mix; it’s a deliberate fusion of complementary strategies, offering traders flexibility across market phases. Questions? Let me know!

Liquidity + Internal Market Shift StrategyLiquidity + Internal Market Shift Strategy
This strategy combines liquidity zone analysis with the internal market structure, aiming to identify high-probability entry points. It uses key liquidity levels (local highs and lows) to track the price's interaction with significant market levels and then employs internal market shifts to trigger trades.
Key Features:
Internal Shift Logic: Instead of relying on traditional candlestick patterns like engulfing candles, this strategy utilizes internal market shifts. A bullish shift occurs when the price breaks previous bearish levels, and a bearish shift happens when the price breaks previous bullish levels, indicating a change in market direction.
Liquidity Zones: The strategy dynamically identifies key liquidity zones (local highs and lows) to detect potential reversal points and prevent trades in weak market conditions.
Mode Options: You can choose to run the strategy in "Both," "Bullish Only," or "Bearish Only" modes, allowing for flexibility based on market conditions.
Stop-Loss and Take-Profit: Customizable stop-loss and take-profit levels are integrated to manage risk and lock in profits.
Time Range Control: You can specify the time range for trading, ensuring the strategy only operates during the desired period.
This strategy is ideal for traders who want to combine liquidity analysis with internal structure shifts for precise market entries and exits.
This description clearly outlines the strategy's logic, the flexibility it provides, and how it works. You can adjust it further to match your personal trading style or preferences!

Gold Scalping BOS & CHoCHThis strategy is designed for scalping gold (XAU/USD) on the 3-minute timeframe, utilizing Break of Structure (BOS) and Change of Character (CHoCH) to identify high-probability trade setups. Unlike traditional SMA crossover strategies, this method focuses purely on price action and market structure shifts, allowing for early entries and better risk management.
Core Concepts:
Break of Structure (BOS) – Confirms a continuation of the trend when price breaks the last swing high (bullish) or last swing low (bearish).
Change of Character (CHoCH) – Detects possible trend reversals by identifying a shift in market momentum.
Dynamic Support & Resistance – Uses the last 10-bar highs and lows to determine adaptive stop-loss (SL) and take-profit (TP) levels.
Risk-to-Reward Ratio (1:2 RR) – Ensures trades are executed with a favorable risk/reward ratio.
Entry Conditions:
Buy Entry:
BOS (Bullish) confirmed (price breaks the previous swing high).
CHoCH (Bullish) confirms trend shift.
Price crosses back above the last swing low (confirmation of support).
Sell Entry:
BOS (Bearish) confirmed (price breaks the previous swing low).
CHoCH (Bearish) confirms trend shift.
Price crosses back below the last swing high (confirmation of resistance).
Exit Conditions:
Stop Loss (SL): Set at the most recent dynamic support (for buys) or resistance (for sells).
Take Profit (TP): 2x the risk (1:2 risk-reward ratio).
Advantages of This Strategy:
✅ No lagging indicators – Uses price action for real-time entries.
✅ High probability setups – Focuses only on strong structural breaks.
✅ Adaptive SL/TP – Uses real market structure instead of fixed values.
✅ Optimized for Scalping – Best suited for quick in-and-out trades.
Best Time to Trade:
🔹 London & New York Sessions (High volatility for gold).

Grease Trap V1.0The Grease Trap V1.0 indicator is a dynamic, Fibonacci-based strategy that calculates unique moving averages to generate trading signals. Below is an overview of its main components and functionality:
How It Works
Fibonacci Grouped Averages:
Dynamic Fibonacci Sequence:
The indicator uses a custom function that dynamically builds a Fibonacci sequence. The user can set the number of Fibonacci elements for two separate calculations:
One for the Indicator Average (default: 9 elements).
One for the Base Average (default: 14 elements).
Grouped Averaging:
Using these Fibonacci numbers, the script groups historical closing prices into segments. For each group (with a length determined by a Fibonacci number), it computes an average. These individual group averages are then averaged together to produce a single dynamic average.
Plotting and Visual Cues:
Two Lines:
The indicator plots two lines on the chart:
Primary Dynamic Fibonacci Grouped Average
Base Dynamic Fibonacci Grouped Average
Color Coding:
The colors of these lines change based on their relationship to the current high price and to each other. For example, if the primary average is above the high or crosses above the base average, it might be shown in green or yellow, whereas certain conditions trigger red, signaling caution.
Crossover Dots:
When the primary average crosses above the base (a bullish signal), a green dot is plotted. Conversely, when it crosses below (a bearish signal), a red dot is displayed. These dots help visually pinpoint the moments of potential trade entry or exit.
Trading Signals and Orders:
Buy Signal:
Triggered when the primary average crosses above the base average. On a buy signal:
If in a short position, it closes that position.
Then, it enters a long position.
Sell Signal:
Triggered when the primary average crosses below the base average. On a sell signal:
If in a long position, it closes that position.
Then, it enters a short position.
Profit Target Management:
The indicator includes automated profit management:
For long positions, it sets an exit order when the price rises by a user-defined percentage (default: 2%).
For short positions, it sets an exit order when the price falls by a similar percentage.
Alerts:
The script is equipped with alert conditions. Traders receive notifications whenever a buy or sell signal is generated, helping them stay on top of potential trading opportunities.
Customization
User Inputs:
Traders can adjust:
The number of Fibonacci elements for each average calculation.
Profit target percentages for both long and short positions.
Data Length Requirement:
The script ensures it uses at least 200 data points (or the total number of available bars, whichever is greater) for a robust calculation of the averages.
In Summary
The Grease Trap V1.0 indicator combines the mathematical elegance of Fibonacci sequences with dynamic grouped averaging. It offers:
Innovative Moving Averages: Based on Fibonacci groupings of historical price data.
Clear Visual Cues: Through color-coded lines and crossover dots.
Automated Trading Actions: With built-in order management and profit targets.
Alert Notifications: So traders are instantly aware of key market signals.
This makes the Grease Trap V1.0 a comprehensive tool for both signal generation and automated strategy execution, suitable for traders looking to integrate Fibonacci principles into their trading systems.

Premarket Gap MomoTrader(SC)🚀 Pre-Market Momentum Trader | Dynamic Position Sizing 🔥
📈 Trade explosive pre-market breakouts with confidence! This algorithmic strategy automatically detects high-momentum setups, dynamically adjusts position size, and ensures risk control with a one-trade-per-day rule.
⸻
🎯 Key Features
✅ Pre-Market Trading (4:00 - 9:30 AM EST) – Only trades during the most volatile session for early breakouts.
✅ Dynamic Position Sizing – Adapts trade size based on candle strength:
• ≥90% body → 100% position
• ≥85% body → 50% position
• ≥75% body → 25% position
✅ 1 Trade Per Day – Avoids overtrading by allowing only one high-quality trade daily.
✅ Momentum Protection – Stays in the trade as long as:
• Every candle remains green (no red candles).
• Each new candle has increasing volume (confirming strong buying).
✅ Automated Exit – Closes position if:
• A red candle appears.
• Volume fails to increase on a green candle.
⸻
🔍 How It Works
📌 Entry Conditions:
✔️ Candle gains ≥5% from previous close.
✔️ Candle is green & body size ≥75% of total range.
✔️ Volume >15K (confirming liquidity).
✔️ Occurs within pre-market session (4:00 - 9:30 AM EST).
✔️ Only the first valid trade of the day is taken.
📌 Exit Conditions:
❌ First red candle after entry → Exit trade.
❌ First green candle with lower volume → Exit trade.
⸻
🏆 Why Use This?
🔹 Eliminates Fake Breakouts – No trade unless volume & momentum confirm.
🔹 Prevents Overtrading – Restricts to one quality trade per day.
🔹 Adaptable to Any Market – Works on stocks, crypto, or forex.
🔹 Hands-Free Execution – No manual chart watching required!
⸻
🚨 Important Notes
📢 Not financial advice. Trading involves risk—always backtest & practice on paper trading before using real money.
📢 Enable pre-market data in your TradingView settings for accurate results.
📢 Optimized for 1-minute & 5-minute timeframes.
🔔 Like this strategy? Leave a comment, share your results, and don’t forget to hit Follow for more strategies! 🚀🔥

TheRookAlgoPROThe Rook Algo PRO is an automated strategy that uses ICT dealing ranges to get in sync with potential market trends. It detects the market sentiment and then place a sell or a buy trade in premium/discount or in breakouts with the desired risk management.
Why is useful?
This algorithm is designed to help traders to quickly identify the current state of the market and easily back test their strategy over longs periods of time and different markets its ideal for traders that want to profit on potential expansions and want to avoid consolidations this algo will tell you when the expansion is likely to begin and when is just consolidating and failing moves to avoid trading.
How it works and how it does it?
The Algo detects the current and previous market structure to identify current ranges and ICT dealing ranges that are created when the market takes buyside liquidity and sellside liquidity, it will tell if the market is in a consolidation, expansion, retracement or in a potential turtle soup environment, it will tell if the range is small or big compared to the previous one. Is important to use it in a trending markets because when is ranging the signals lose effectiveness.
This algo is similar to the previously released the Rook algo with the additional features that is an automated strategy that can take trades using filters with the desired risk reward and different entry types and trade management options.
Also this version plots FVGS(fair value gaps) during expansions, and detects consolidations with a box and the mid point or average. Some bars colors are available to help in the identification of the market state. It has the option to show colors of the dealing ranges first detected state.
How to use it?
Start selecting the desired type of entry you want to trade, you can choose to take Discount longs, premium sells, breakouts longs and sells, this first four options are the selected by default. You can enable riskier options like trades without confirmation in premium and discount or turtle soup of the current or previous dealing range. This last ones are ideal for traders looking to enter on a counter trend but has to be used with caution with a higher timeframe reference.
In the picture below we can see a premium sell signal configuration followed by a discount buy signal It display the stop break even level and take profit.
This next image show how the riskier entries work. Because we are not waiting for a confirmation and entering on a counter trend is normal to experience some stop losses because the stop is very tight. Should only be used with a clear Higher timeframe reference as support of the trade idea. This algo has the option to enable standard deviations from the normal stop point to prevent liquidity sweeps. The purple or blue arrows indicate when we are in a potential turtle soup environment.
The algo have a feature called auto-trade enable by default that allow for a reversal of the current trade in case it meets the criteria. And also can take all possible buys or all possible sells that are riskier entries if you just want to see the market sentiment. This is useful when the market is very volatile but is moving not just ranging.
Then we configure the desired trade filters. We have the options to trade only when dealing ranges are in sync for a more secure trend, or we can disable it to take riskier trades like turtle soup trades. We can chose the minimum risk reward to take the trade and the target extension from the current range and the exit type can be when we hit the level or in a retracement that is the default setting. These setting are the most important that determine profitability of the strategy, they has be adjusted depending on the timeframe and market we are trading.
The stop and target levels can also be configured with standard deviations from the current range that way can be adapted to the market volatility.
The Algo allow the user to chose if it want to place break even, or trail the stop. In the picture below we can see it in action. This can work when the trend is very strong if not can lead to multiple reentries or loses.
The last option we can configure is the time where the trades are going to be taken, if we trade usually in the morning then we can just add the morning time by default is set to the morning 730am to 1330pm if you want to trade other times you should change this. Or if we want to enter on the ICT macro times can also be added in a filter. Trade taken with the macro times only enable is visible in the picture below.
Strategy Results
The results are obtained using 2000usd in the MNQ! In the 15minutes timeframe 1 contract per trade. Commission are set to 2USD, slippage to 1tick, the backtesting range is from May 2 2024 to March 2025 for a total of 119 trades, this Strategy default settings are designed to take trades on the daily expansions, trail stop and Break even is activated the exit on profit is on a retracement, and for loses when the stop is hit. The auto-trade option is enable to allow to detect quickly market changes. The strategy give realistic results, makes around 200% of the account in around a year. 1.4 profit factor with around 37% profitable trades. These results can be further improve and adapted to the specific style of trading using the filters.
Remember entries constitute only a small component of a complete winning strategy. Other factors like risk management, position-sizing, trading frequency, trading fees, and many others must also be properly managed to achieve profitability. Past performance doesn’t guarantee future results.
Summary of features
-Easily Identify the current dealing range and market state to avoid consolidations
-Recognize expansions with FVGs and consolidation with shaded boxes
-Recognize turtle soups scenarios to avoid fake out breakout
-Configurable automated trades in premium/discount or breakouts
-Auto-trade option that allow for reversal of the current trade when is no longer valid
-Time filter to allow only entries around the times you trade or on the macro times.
-Risk Reward filter to take the automated trades with visible stop and take profit levels
-Customizable trade management take profit, stop, breakeven level with standard deviations
-Trail stop option to secure profit when price move in your favor
-Option to exit on a close, retracement or reversal after hitting the take profit level
-Option to exit on a close or reversal after hitting stop loss
-Dashboard with instant statistics about the strategy current settings and market sentiment

Bull Flag (9:30-12:00 Only) [One-Liner Fix]🚀 Bull Flag Breakout Strategy | Intraday Momentum (9:30-12:00) 🔥📈
💡 Designed for Intraday Traders who love momentum breakouts and want to automate Bull Flag setups with volume confirmation! This strategy detects strong bullish moves, measures pullbacks, and triggers trades when the first candle makes a new high—ensuring maximum momentum.
⸻
🏆 Why This Strategy?
✅ Bull Flag Pattern Automation – No need to manually spot pullbacks! 🎯
✅ Smart Volume Confirmation – Only enter trades when breakout volume is strong! 📊
✅ Morning Session Focused (9:30 - 12:00 EST) – Trade when momentum is at its peak! ⏰
✅ Customizable ATR & Risk Settings – Adjust pullback %, stop-loss, and take-profit! 🛠️
✅ Backtest-Friendly – See how the strategy performs over time! 🔍
⸻
🎯 How It Works
📌 Step 1: Detects a Bullish Impulse Bar
🔹 Large green candle 🚀
🔹 Candle range > ATR multiplier
🔹 Volume > Average volume threshold
📌 Step 2: Confirms a Valid Pullback
🔸 Pullback must stay within % range of the impulse move 📉
🔸 If the pullback is too deep or takes too long, the setup is ignored ⛔
📌 Step 3: First Candle to Make a New High 📈
🔹 When a candle breaks the previous high and volume confirms, go long! 💰
🔹 Stop-Loss set at pullback low
🔹 Take-Profit at Risk:Reward (R:R) Target 🎯
⸻
🔥 Best For
💎 Scalpers & Day Traders – Capture short-term breakout momentum! ⚡
📊 Backtesters – Optimize ATR, volume, and pullback rules for best performance! 🧪
⏳ Morning Momentum Traders – Focus on 9:30-12:00 AM EST for higher probability setups!
⸻
🚨 Important Notes
🔹 This strategy is not financial advice! 📜
🔹 Always backtest & paper trade before using real money! 📉📈
🔹 Volatility varies – Customize settings based on your trading style! 🔧
🚀 Like this script? Give it a try & let us know how it works for you! 🔥👊
⸻

RSI, Volume, MACD, EMA ComboRSI + Volume + MACD + EMA Trading System
This script combines four powerful indicators—Relative Strength Index (RSI), Volume, Moving Average Convergence Divergence (MACD), and Exponential Moving Average (EMA)—to create a comprehensive trading strategy for better trend confirmation and trade entries.
How It Works
RSI (Relative Strength Index)
Helps identify overbought and oversold conditions.
Used to confirm momentum strength before taking a trade.
Volume
Confirms the strength of price movements.
Avoids false signals by ensuring there is sufficient trading activity.
MACD (Moving Average Convergence Divergence)
Confirms trend direction and momentum shifts.
Provides buy/sell signals through MACD line crossovers.
EMA (Exponential Moving Average)
Acts as a dynamic support and resistance level.
Helps filter out trades that go against the overall trend.
Trading Logic
Buy Signal:
RSI is above 50 (bullish momentum).
MACD shows a bullish crossover.
The price is above the EMA (trend confirmation).
Volume is increasing (strong participation).
Sell Signal:
RSI is below 50 (bearish momentum).
MACD shows a bearish crossover.
The price is below the EMA (downtrend confirmation).
Volume is increasing (intense selling pressure).
Backtesting & Risk Management
The strategy is optimized for scalping on the 1-minute timeframe (adjustable for other timeframes).
Default settings use realistic commission and slippage to simulate actual trading conditions.
A stop-loss and take-profit system is integrated to manage risk effectively.
This script is designed to help traders filter out false signals, improve trend confirmation, and increase trade accuracy by combining multiple indicators in a structured way.

3Commas Multicoin Scalper LITE [SwissAlgo]
Introduction
Are you tired of tracking cryptocurrency charts and placing orders manually on your Exchange?
The 3Commas Multicoin Scalper LITE is an automated trading system designed to identify and execute potential trading setups on multiple cryptocurrencies ( simultaneously ) on your preferred Exchange (Binance, Bybit, OKX, Gate.io, Bitget) via 3Commas integration.
It analyzes price action, volume, momentum, volatility, and trend patterns across two categories of USDT Perpetual coins: the 'Top Major Coins' category (11 established cryptocurrencies) and your Custom Category (up to 10 coins of your choice).
The indicator sends real-time trading signals directly to your 3Commas bots for automated execution, identifying both trend-following and contrarian trading opportunities in all market conditions.
Trade automatically all coins of one or more selected categories:
----------------------------------------------
What it Does
The 3Commas Multicoin Scalper LITE is a technical analysis tool that monitors multiple cryptocurrency pairs simultaneously and connects with 3Commas for signal delivery and execution.
Here's how the strategy works:
🔶 Technical Analysis : Analyzes price action, volume, momentum, volatility, and trend patterns across USDT Perpetual Futures contracts simultaneously.
🔶 Pattern Detection : Identifies specific candle patterns and technical confluences that suggest potential trading setups across USDT.P contracts of the selected category.
🔶 Signal Generation : When technical criteria are met at bar close, the indicator creates deal-start signals for the relevant pairs.
🔶 3Commas Integration : Packages these signals and delivers them to 3Commas through TradingView alerts, allowing 3Commas bots to receive specific pair information ('Deal-Start' signals).
🔶 Category Management : Each TradingView alert monitors an entire category, allowing selective activation of different crypto categories.
🔶 Visual Feedback : Provides color-coded candles and backgrounds to visualize technical conditions, with optional pivot points and trend visualization.
Candle types
Signals
----------------------------------------------
Quick Start Guide
1. Setup 3Commas Bots : Configure two DCA bots in 3Commas (All USDT pairs) - one for LONG positions and one for SHORT positions.
2. Define Trading Parameters : Set your budget for each trade and adjust your preferred sensitivity within the indicator settings.
3. Create Category Alerts : Set up one TradingView alert for each crypto category you want to trade.
That's it! Once configured, the system automatically sends signals to your 3Commas bots when predefined trading setups are detected across coins in your selected/activated categories. The indicator scans all coins at bar close (for example, every hour on the 1H timeframe) and triggers trade execution only for those showing technical confluences.
Important : Consider your total capital when enabling categories. More details about the setup process are provided below (see paragraph "Detailed Setup & Configuration").
----------------------------------------------
Built-in Backtesting
The 3Commas Multicoin Scalper LITE includes backtesting visualization for each coin. When viewing any USDT Perpetual pair on your chart, you can visualize how the strategy would have performed historically on that specific asset.
Color-coded candles and signal markers show past trading setups, helping you evaluate which coins responded best to the strategy. This built-in backtesting capability can support your selection of assets/categories to trade before deploying real capital.
As backtesting results are hypothetical and do not guarantee future performance, your research and analysis are essential for selecting the crypto categories/coins to trade.
The default strategy settings are: Start Capital 1,000$, leverage 10X, Commissions 0.1% (average Taker Fee on Exchanges for average users), Order Amount 200$ for Longs/Shorts, Slippage 4
Example of backtesting view
----------------------------------------------
Key Features
🔶 Multi-Exchange Support : Compatible with BINANCE, BYBIT, BITGET, GATEIO, and OKX USDT Perpetual markets (USDT.P)
🔶 Category Options : Analyze cryptocurrencies in the Top Major Coins category or create your custom watchlist
🔶 Custom Category Option : Create your watchlist with up to 10 custom USDT Perpetual pairs
🔶 3Commas Integration : Seamlessly connects with 3Commas bots to automate trade entries and exits
🔶 Dual Strategy Approach : Identifies both "trend following" and "contrarian" potential setups
🔶 Confluence-Based Signals : Uses a combination of multiple technical factors - price spikes, price momentum, volume spikes, volume momentum, trend analysis, and volatility spikes - to generate potential trading setups
🔶 Risk Management : Adjustable sensitivity/risk levels, leverage settings, and budget allocation for each trade
🔶 Visual Indicators : Color-coded candles and trading signals provide visual feedback on market conditions
🔶 Trend Indication : Background colors showing ongoing uptrends/downtrends
🔶 Pivot Points & Daily Open : Optional display of pivot points and daily open price for additional context
🔶 Liquidity Analysis : Optional display of high/low liquidity timeframes throughout the trading week
🔶 Trade Control : Configurable limit for the maximum number of signals sent to 3Commas for execution (per bar close and category)
5 Available Exchanges
Pick coins/tokens and defined your Custom Category
----------------------------------------------
Methodology
The 3Commas Multicoin Scalper LITE utilizes a multi-faceted approach to identify potential trading setups:
1. Price Action Analysis : Detects abnormal price movements by comparing the current candle's range to historical averages and standard deviations, helping identify potential "pump and dump" scenarios or new-trends start
2. Price Momentum : Evaluates the relative strength of bullish vs. bearish price movements over time, indicating the build-up of buying or selling pressure.
3. Volume Analysis: Identifies unusual volume spikes by comparing current volume to historical averages, signaling strong market interest in a particular direction.
4. Volume Momentum : Measures the ratio of bullish to bearish volume, revealing the dominance of buyers or sellers over time.
5. Trend Analysis : Combines EMA slopes, RSI, and Stochastic RSI to determine overall trend direction and strength.
6. Volatility : Monitors the ATR (Average True Range) to detect periods of increased market volatility, which may indicate potential breakouts or reversals
7. Candle Wick Analysis : Evaluates upper and lower wick percentages to detect potential rejection patterns and reversals.
8. Pivot Point Analysis : Uses pivot points (PP, R1-R3, S1-S3) for identifying key support/resistance areas and potential breakout/breakdown levels.
9. Daily Open Reference: Analyzes price action relative to the daily open for potential setups related to price movement vs. the opening price
10. Market Timing/Liquidity : Evaluates high/low liquidity periods, specific days/times of heightened risk, and potential market manipulation timeframes.
11. Boost Factors : Applies additional weight to certain confluence patterns to adjust global scores
These factors are combined into a "Global Score" ranging from -1 to +1 , applied at bar close to the newly formed candles.
Scores above predefined thresholds (configurable via the Sensitivity Settings) indicate strong bullish or bearish conditions and trigger signals based on predefined patterns. The indicator then applies additional filters to generate specific "Trend Following" and "Contrarian" trading signals. The identified signals are packaged and sent to 3Commas for execution.
Pivot Points
Trend Background
----------------------------------------------
Who This Strategy Is For
The 3Commas Multicoin Scalper LITE may benefit:
Crypto Traders seeking to automate their trading across multiple coins simultaneously
3Commas Users looking to enhance their bot performance with technical signals
Busy Traders who want to monitor market opportunities without constant chart-watching
Multi-strategy traders interested in both trend-following and reversal trading approaches
Traders of Various Experience Levels from intermediate traders wanting to save time to advanced traders seeking to optimize their operations
Perpetual Futures Traders on major exchanges (Binance, Bybit, OKX, Gate.io, Bitget)
Swing and Scalp Traders seeking to identify short to medium-term profit opportunities
----------------------------------------------
Visual Indicators
The indicator provides visual feedback through:
1. Candlestick Colors :
* Lime: Strong bullish candle (High positive score)
* Blue: Moderate bullish candle (Medium positive score)
* Red: Strong bearish candle (High negative score)
* Purple: Moderate bearish candle (Medium negative score)
* Pale Green/Red: Mild bullish/bearish candle
2. Signal Markers :
* ↗: Trend following Long signal
* ↘: Trend following Short signal
* ⤴: Contrarian Long signal
* ⤵: Contrarian Short signal
3. Optional Elements :
* Pivot Points: Daily support/resistance levels (R1-R3, S1-S3, PP)
* Daily Open: Reference price level for the current trading day
* Trend Background: Color-coded background suggesting potential ongoing uptrend/downtrend
* Liquidity Highlighting: Background colors indicating typical high/low market liquidity periods
4. TradingView Strategy Plots and Backtesting Data : Standard performance metrics showing entry/exit points, equity curves, and trade statistics, based on the signals generated by the script.
----------------------------------------------
Detailed Setup & Configuration
The indicator features a user-friendly input panel organized in sequential steps to guide you through the complete setup process. Tooltips for each step provide additional information to help you understand the actions required to get the strategy running.
Informative tables provide additional details and instructions for critical setup steps such as 3Commas bot configuration and TradingView alert creation (to activate trading on specific categories).
1. Choose Exchange, Crypto Category & Sensitivity
* Select your USDT Perpetual Exchange (BINANCE, BYBIT, BITGET, GATEIO, or OKX) - i.e. the same Exchange connected in your 3Commas account
* Choose your preferred crypto category, or define your watchlist
* Choose from three sensitivity levels: Default, Aggressive, or Test Mode (test mode is designed to generate more signals, a potentially helpful feature when you are testing the indicator and alerts)
2. Setup 3Commas Bots and integrate them with the algo
* Create both LONG and SHORT DCA Bots in 3Commas
* Configure bots to accept signals for 'All USDT Pairs' with "TradingView Custom Signal" as deal start condition
* Enter your Bot IDs and Email Token in the indicator settings
* Set a maximum budget for LONG and SHORT trades
* Choose whether to allow LONG trades, SHORT trades, or both, according to your preference and market analysis
* Set maximum trades per bar/category (i.e. the max. number of simultaneous signals that the algo may send to your 3Commas bots for execution at every bar close - every hour if you set the 1H timeframe)
* Access the detailed setup guide table for step-by-step 3Commas configuration instructions
3Commas integration
3. Choose Visuals
* Toggle various optional visual elements to add to the chart: category metrics, fired alerts, coin metrics, daily open, pivot points
* Select a color theme: Dark or Light
4. Activate Trading via Alerts
* Create TradingView alerts for each category you want to trade
* Set alert condition to "3Commas Multicoin Scalper" with "Any alert() function call"
* Set the content of the message field to: {{Message}}, deleting the default content shown in this text field, to enable proper 3Commas integration (any other text than {{Message}}, would break the delivery trading signals from Tradingview to 3Commas)
* View the alerts setup instruction table for visual guidance on this critical step
Alerts
Fired Alerts (example at a single bar)
Fired Alerts (frequency)
Important Configuration Notes
Ensure that the TradingView chart's exchange matches your selected exchange in the indicator settings and your 3Commas bot settings.
You must configure the same leverage in both the script and your 3Commas bots
Your 3Commas bots must be configured for All USDT pairs
You must enter the exact Bot IDs and Email Token from 3Commas (these remain confidential - no one, including us, has access to them)
If you activate multiple categories without sufficient capital, 3Commas will display " insufficient funds " errors - align your available capital with the number of categories you activate (each deal will use the budget amount specified in user inputs)
You are free to set your Take Profit % / trailing on 3Commas
We recommend not to use DCA orders (i.e. set the number of DCA orders at zero)
Legend of symbols and plots on the chart
----------------------------------------------
FAQs
General Questions
❓ Q: What features are included in this indicator? A: This indicator provides access to the "Top Major Coins" category and a custom category option where you can define up to 10 pairs of your choice. It includes multi-exchange support, 3Commas integration, a dual strategy approach, visual indicators, trade controls, and comprehensive backtesting capabilities. The indicator is optimized to manage up to 2 trades per hour/category with leverage up to 10x and trade sizes up to 500 USDT - everything needed for traders looking to automate their crypto trading across multiple pairs simultaneously.
❓ Q: What is Global Score? A: The Global Score serves as a foundation for signal generation. When a candle's score exceeds certain thresholds (defined by your Risk Level setting), it becomes a candidate for signal generation. However, not all high-scoring candles generate trading signals - the indicator applies additional pattern recognition and contextual filters. For example, a strongly positive score (lime candle) in an established uptrend may trigger a "Trend Following" signal, while a strongly negative score (red candle) in a downtrend might generate a "Trend following Short" signal. Similarly, contrarian signals are generated when specific reversal patterns occur alongside appropriate Global Score values, often involving wick analysis and pivot point interactions. This multi-layer approach helps filter out false positives and identify higher-probability trading setups.
❓ Q: What's the difference between "Trend following" and "Contrarian" signals in the script? A: "Trend Following" signals follow the identified trends while "Contrarian" signals anticipate potential trend reversals.
❓ Q: Why don't I see any signals on my chart? A: Make sure you're viewing a USDT Perpetual pair from your selected exchange that belongs to the crypto category you've chosen to analyze. For example, if you've selected the "Top Major Coins" category with Binance as your exchange, you need to view a chart of one of those specific pairs (like BINANCE:BTCUSDT.P) to see signals. If you switch exchanges, for example from Binance to Bybit, you need to pull a Bybit pair on the chart to see backtesting data and signals.
❓ Q: Does this indicator guarantee profits? A: No. Trading cryptocurrencies involves significant risk, and past performance is not indicative of future results. This indicator is a tool to help you identify potential trading setups, but it does not and cannot guarantee profits.
❓ Q: Does this indicator repaint or use lookahead bias? A: No. All trading signals generated by this indicator are based only on completed price data and do not repaint. The system is designed to ensure that backtesting results reflect as closely as possible what you should experience in live trading.
While reference levels like pivot points are kept stable throughout the day using lookahead on, the actual buy and sell signals are calculated using only historical data (lookahead off) that would have been available at that moment in time. This ensures reliability and consistency between backtesting and real-time trading performance.
Technical Setup
❓ Q: What exchanges are supported? A: The strategy supports BINANCE, BYBIT, BITGET, GATEIO, and OKX USDT Perpetual markets (i.e. all the Exchanges you can connect to your 3Commas account for USDT Perpetual trading, excluding Coinbase Perpetual that offers USDC pairs, instead of USDT).
❓ Q: What timeframe should I use? A: The indicator is optimized for the 1-hour (1H) timeframe but may run on any timeframe.
❓ Q: How many coins can I trade at once? A: You can trade all coins within the selected category. You can activate categories by setting up alerts.
❓ Q: How many alerts do I need to set up? A: You need to set up one alert for each crypto category you want to trade. We recommend starting with one category, testing the results carefully, monitoring performance daily, and perhaps activating additional categories in a second stage.
❓ Q: Are there any specific risk management features built into the indicator? A: Yes, the indicator includes risk management features: adjustable maximum trades per hour/category, the ability to enable/disable long or short signals depending on market conditions, customizable trade size for both long and short positions, and different sensitivity/risk level settings.
❓ Q: What happens if 3Commas can't execute a signal? A: If 3Commas cannot execute a signal (due to insufficient funds, bot offline, etc.), the trade will be skipped. The indicator will continue sending signals for other valid setups, but it doesn't retry failed signals.
❓ Q: Can I run this indicator on multiple charts at once? A: Yes, but it's not necessary. The indicator analyzes all coins in your selected categories regardless of which chart you apply it to. For optimal resource usage, apply it to a single chart of a USDT Perpetual pair from your selected exchange. To stop trading a category, simply delete the alert created for that category.
❓ Q: How frequently does the indicator scan for new signals? A: The indicator scans all coins in your selected categories at the close of each bar (every hour if you selected the 1H timeframe).
----------------------------------------------
⚠️
Disclaimer
This indicator is for informational and educational purposes only and does not constitute financial advice. Trading cryptocurrencies involves significant risk, including the potential loss of all invested capital, and past performance is not indicative of future results.
Always conduct your own thorough research (DYOR) and understand the risks involved before making any trading decisions. Trading with leverage significantly amplifies both potential profits and losses - exercise extreme caution when using leverage and never risk more than you can afford to lose.
The Bot ID and Email Token information are transmitted directly from TradingView to 3Commas via secure connections. No third party or entity will ever have access to this data (including the Author). Do not share your 3Commas credentials with anyone.
This indicator is not affiliated with, endorsed by, or sponsored by TradingView or 3Commas.

3Commas Multicoin Scalper PRO [SwissAlgo]Introduction
Are you tired of tracking dozens of cryptocurrency charts and placing orders manually on your Exchange?
The 3Commas Multicoin Scalper PRO is an automated trading system designed to simultaneously identify and execute potential trading setups on multiple cryptocurrencies on your preferred Exchange (Binance, Bybit, OKX, Gate.io, Bitget) via 3Commas integration.
It analyzes price action, volume, momentum, volatility, and trend patterns across 180+ USDT Perpetual coins divided into 17 crypto categories , providing real-time signals directly to your 3Commas bots for automated trade execution. This indicator aims to identify potential trend-following and contrarian setups in both bull and bear markets.
-------------------------------------
What it Does
The 3Commas Multicoin Scalper PRO is a technical analysis tool that monitors multiple cryptocurrency pairs simultaneously and connects with 3Commas for signal delivery and execution.
Here's how the strategy works:
🔶 Technical Analysis : Analyzes price action, volume, momentum, volatility, and trend patterns across multiple USDT Perpetual Futures contracts simultaneously.
🔶 Pattern Detection : Identifies specific candle patterns and technical confluences that suggest potential trading setups across all USDT.P contracts of the selected categories
🔶 Signal Generation : When technical criteria are met at bar close, the indicator creates deal-start signals for the relevant pairs.
🔶 3Commas Integration : Packages these signals and delivers them to 3Commas through TradingView alerts, allowing 3Commas bots to receive specific pair information ('Deal-Start' signals).
🔶 Category Management : Each TradingView alert monitors an entire category (approximately 11 pairs), allowing selective activation of different crypto categories.
🔶 Visual Feedback : Provides color-coded candles and backgrounds to visualize technical conditions, with optional pivot points and trend visualization.
Candle types:
Signals:
-------------------------------------
Quick Start Guide
1. Setup 3Commas Bots : Configure two DCA bots in 3Commas (All USDT pairs) - one for LONG positions and one for SHORT positions.
2. Define Trading Parameters : Set your budget for each trade and adjust your preferred sensitivity within the indicator settings.
3. Create Category Alerts : Set up one TradingView alert for each crypto category you want to trade.
That's it! Once configured, the system automatically sends signals to your 3Commas bots when predefined trading setups are detected across coins in your selected/activated categories. The indicator scans all coins at bar close (for example, every hour on the 1H timeframe) and triggers trade execution only for those showing technical confluences.
Important : The more categories you activate by setting TradingView alerts, the more signals your 3Commas bots will receive. Consider your total capital when enabling multiple categories. More details about the setup process are provided below (see paragraph "Detailed Setup & Configuration")
-------------------------------------
Built-in Backtesting
The 3Commas Multicoin Scalper PRO includes backtesting visualization for each coin. When viewing any USDT Perpetual pair on your chart, you can visualize how the strategy would have performed historically on that specific asset.
Color-coded candles and signal markers show past trading setups, helping you evaluate which coins responded best to the strategy. This built-in backtesting capability can support your selection of assets/categories to trade before deploying real capital.
As backtesting results are hypothetical and do not guarantee future performance, your research and analysis are essential for selecting the crypto categories/coins to trade.
The default strategy settings are: Start Capital 1.000$, leverage 25X, Commissions 0.1% (average Taker Fee on Exchanges for average users), Order Amount 200$ for Longs/150$ for Shorts, Slippage 4
-------------------------------------
Key Features
🔶 Multi-Exchange Support : Compatible with BINANCE, BYBIT, BITGET, GATEIO, and OKX USDT Perpetual markets (USDT.P)
🔶 Wide Asset Coverage : Simultaneously analyzes 180+ cryptocurrencies across 17 specialized crypto categories
🔶 Custom Category Option : Create your watchlist with up to 10 custom USDT Perpetual pairs
🔶 3Commas Integration : Seamlessly connects with 3Commas bots to automate trade entries and exits
🔶 Dual Strategy Approach : Identifies both "trend following" and "contrarian" potential setups
🔶 Confluence-Based Signals : Uses a combination of multiple technical factors - price spikes, price momentum, volume spikes, volume momentum, trend analysis, and volatility spikes - to generate potential trading setups
🔶 Risk Management : Adjustable sensitivity/risk levels, leverage settings, and budget allocation for each trade
🔶 Visual Indicators : Color-coded candles and trading signals provide visual feedback on market conditions
🔶 Trend Indication : Background colors showing ongoing uptrends/downtrends
🔶 Pivot Points & Daily Open : Optional display of pivot points and daily open price for additional context
🔶 Liquidity Analysis : Optional display of high/low liquidity timeframes throughout the trading week
🔶 Trade Control : Configurable limit for the maximum number of signals sent to 3Commas for execution (per bar close and category)
Available Exchanges
Categories
Custom Category
Trend following/contrarian signals
-------------------------------------
Methodology
The 3Commas Multicoin Scalper PRO utilizes a multi-faceted approach to identify potential trading setups:
1. Price Action Analysis : Detects abnormal price movements by comparing the current candle's range to historical averages and standard deviations, helping identify potential "pump and dump" scenarios or new-trends start
2. Price Momentum : Evaluates the relative strength of bullish vs. bearish price movements over time, indicating the build-up of buying or selling pressure.
3. Volume Analysis: Identifies unusual volume spikes by comparing current volume to historical averages, signaling strong market interest in a particular direction.
4. Volume Momentum : Measures the ratio of bullish to bearish volume, revealing the dominance of buyers or sellers over time.
5. Trend Analysis : Combines EMA slopes, RSI, and Stochastic RSI to determine overall trend direction and strength.
6. Volatility : Monitors the ATR (Average True Range) to detect periods of increased market volatility, which may indicate potential breakouts or reversals
7. Candle Wick Analysis : Evaluates upper and lower wick percentages to detect potential rejection patterns and reversals.
8. Pivot Point Analysis : Uses pivot points (PP, R1-R3, S1-S3) for identifying key support/resistance areas and potential breakout/breakdown levels.
9. Daily Open Reference: Analyzes price action relative to the daily open for potential setups related to price movement vs. the opening price
10. Market Timing/Liquidity : Evaluates high/low liquidity periods, specific days/times of heightened risk, and potential market manipulation timeframes.
11. Boost Factors : Applies additional weight to certain confluence patterns to adjust global scores
These factors are combined into a "Global Score" ranging from -1 to +1 , applied at bar close to the newly formed candles.
Scores above predefined thresholds (configurable via the Sensitivity Settings) indicate strong bullish or bearish conditions and trigger signals based on predefined patterns. The indicator then applies additional filters to generate specific "Trend Following" and "Contrarian" trading signals. The identified signals are packaged and sent to 3Commas for execution.
Pivot Points
Daily open
Market Trend
Liquidity patterns by weekday
-------------------------------------
Who This Strategy Is For?
The 3Commas Multicoin Scalper PRO may benefit:
Crypto Traders seeking to automate their trading across multiple coins simultaneously
3Commas Users looking to enhance their bot performance with advanced technical signals
Busy Traders who want to monitor many market opportunities without constant chart-watching
Multi-strategy traders interested in both trend-following and reversal trading approaches
Traders of Various Experience Levels from intermediate traders wanting to save time to advanced traders seeking to scale their operations
Perpetual Futures Traders on major exchanges (Binance, Bybit, OKX, Gate.io, Bitget)
Swing and Scalp Traders seeking to identify short to medium-term profit opportunities
-------------------------------------
Visual Indicators
The indicator provides visual feedback through:
1. Candlestick Colors :
* Lime: Strong bullish candle (High positive score)
* Blue: Moderate bullish candle (Medium positive score)
* Red: Strong bearish candle (High negative score)
* Purple: Moderate bearish candle (Medium negative score)
* Pale Green/Red: Mild bullish/bearish candle
2. Signal Markers :
* ↗: Trend Following Long signal
* ↘: Trend Following Short signal
* ⤴: Contrarian Long signal
* ⤵: Contrarian Short signal
3. Optional Elements :
* Pivot Points: Daily support/resistance levels (R1-R3, S1-S3, PP)
* Daily Open: Reference price level for the current trading day
* Trend Background: Color-coded background suggesting potential ongoing uptrend/downtrend
* Liquidity Highlighting: Background colors indicating typical high/low market liquidity periods
4. TradingView Strategy Plots and Backtesting Data : Standard performance metrics showing entry/exit points, equity curves, and trade statistics, based on the signals generated by the script.
-------------------------------------
Detailed Setup & Configuration
The indicator features a user-friendly input panel organized in sequential steps to guide you through the complete setup process. Tooltips for each step provide additional information to help you understand the actions required to get the strategy running.
Informative tables provide additional details and instructions for critical setup steps such as 3Commas bot configuration and TradingView alert creation (to activate trading on specific categories).
1. Choose Exchange, Crypto Category & Sensitivity
* Select your USDT Perpetual Exchange (BINANCE, BYBIT, BITGET, GATEIO, or OKX) - i.e. the same Exchange connected in your 3Commas account
* Browse and choose your preferred crypto category, or define your watchlist
* Choose from three sensitivity levels: Default, Aggressive, or Test Mode (test mode is designed to generate way more signals, a potentially helpful feature when you are testing the indicator and alerts)
2. Setup 3Commas Bots and integrate them with the algo
* Create both LONG and SHORT DCA Bots in 3Commas
* Configure bots to accept signals for 'All USDT Pairs' with "TradingView Custom Signal" as deal start condition
* Enter your Bot IDs and Email Token in the indicator settings
* Set a maximum budget for LONG and SHORT trades
* Choose whether to allow LONG trades, SHORT trades, or both, according to your preference and market analysis
* Set maximum trades per bar/category (i.e. the max. number of simultaneous signals that the algo may send to your 3Commas bots for execution at every bar close - every hour if you set the 1H timeframe)
* Access the detailed setup guide table for step-by-step 3Commas configuration instructions
3Commas integration
3. Choose Visuals
* Toggle various optional visual elements to add to the chart: category metrics, fired alerts, coin metrics, daily open, pivot points
* Select a color theme: Dark or Light
4. Activate Trading via Alerts
* Create TradingView alerts for each category you want to trade
* Set alert condition to "3Commas Multicoin Scalper" with "Any alert() function call"
* Set the content of the message filed to: {{Message}}, deleting the default content shown in this text field, to enable proper 3Commas integration (any other text than {{Message}}, would break the delivery trading signals from Tradingview to 3Commas)
* View the alerts setup instruction table for visual guidance on this critical step
Alerts
Fired Alerts
Important Configuration Notes
Ensure that the TradingView chart's exchange matches your selected exchange in the indicator settings and your 3Commas bot settings.
You must configure the same leverage in both the script and your 3Commas bots
Your 3Commas bots must be configured for All USDT pairs
You must enter the exact Bot IDs and Email Token from 3Commas (these remain confidential - no one, including us, has access to them)
If you activate multiple categories without sufficient capital, 3Commas will display " insufficient funds " errors - align your available capital with the number of categories you activate (each deal will use the budget amount specified in user inputs)
You are free to set your Take Profit % / trailing on 3Commas
We recommend not to use DCA orders (i.e. set the number of DCA orders at zero)
Legend of symbols
-------------------------------------
FAQs
General Questions
❓ Q: What is Global Score? A: The Global Score serves as a foundation for signal generation. When a candle's score exceeds certain thresholds (defined by your Risk Level setting), it becomes a candidate for signal generation. However, not all high-scoring candles generate trading signals - the indicator applies additional pattern recognition and contextual filters. For example, a strongly positive score (lime candle) in an established uptrend may trigger a "Trend Following" signal, while a strongly negative score (red candle) in a downtrend might generate a "Trend Following Short" signal. Similarly, contrarian signals are generated when specific reversal patterns occur alongside appropriate Global Score values, often involving wick analysis and pivot point interactions. This multi-layer approach helps filter out false positives and identify higher-probability trading setups.
❓ Q: What's the difference between "Trend following" and "Contrarian" signals in the script? A: "Trend Following" signals follow the identified trends while "Contrarian" signals anticipate potential trend reversals.
❓ Q: Why can't I configure all the parameters? A: We've designed the solution to be plug-and-play to prevent users from getting lost in endless configurations. The preset values have been tested against their trade-offs in terms of financial performance, average trade duration, and risk levels.
❓ Q: Why don't I see any signals on my chart? A: Make sure you're viewing a USDT Perpetual pair from your selected exchange that belongs to the crypto category you've chosen to analyze. For example, if you've selected the "Top Major Coins" category with Binance as your exchange, you need to view a chart of one of those specific pairs (like BINANCE:BTCUSDT.P) to see signals. If you switch exchanges, for example from Binance to Bybit, you need to pull a Bybit pair on the chart to see backtesting data and signals.
❓ Q: Does this indicator guarantee profits? A: No. Trading cryptocurrencies involves significant risk, and past performance is not indicative of future results. This indicator is a tool to help you identify potential trading setups, but it does not and cannot guarantee profits.
❓ Q: Does this indicator repaint or use lookahead bias? A: No. All trading signals generated by this indicator are based only on completed price data and do not repaint. The system is designed to ensure that backtesting results reflect as closely as possible what you should experience in live trading.
While reference levels like pivot points are kept stable throughout the day using lookahead on, the actual buy and sell signals are calculated using only historical data (lookahead off) that would have been available at that moment in time. This ensures reliability and consistency between backtesting and real-time trading performance.
Technical Setup
❓ Q: What exchanges are supported? A: The strategy supports BINANCE, BYBIT, BITGET, GATEIO, and OKX USDT Perpetual markets (i.e. all the Exchanges you can connect to your 3Commas account for USDT Perpetual trading, excluding Coinbase Perpetual that offers UDSC pairs, instead of USDT).
❓ Q: What timeframe should I use? A: The indicator is optimized for the 1-hour (1H) timeframe but may run on any timeframe.
❓ Q: How many coins can I trade at once? A: You can trade all coins within each selected category (up to 11 coins per category in standard categories). You can activate multiple categories by setting up multiple alerts.
❓ Q: How many alerts do I need to set up? A: You need to set up one alert for each crypto category you want to trade. For example, if you want to trade both the "Top Major Coins" and the "DeFi" categories, you'll need to create two separate alerts, one for each category. We recommend starting with one category, testing the results carefully, monitoring performance daily, and perhaps activating additional categories in a second stage.
❓ Q: Are there any specific risk management features built into the indicator? A: Yes, the indicator includes risk management features: adjustable maximum trades per hour/category, the ability to enable/disable long or short signals depending on market conditions, customizable trade size for both long and short positions, and different sensitivity/risk level settings.
❓ Q: What happens if 3Commas can't execute a signal? A: If 3Commas cannot execute a signal (due to insufficient funds, bot offline, etc.), the trade will be skipped. The indicator will continue sending signals for other valid setups, but it doesn't retry failed signals.
❓ Q: Can I run this indicator on multiple charts at once? A: Yes, but it's not necessary. The indicator analyzes all coins in your selected categories regardless of which chart you apply it to. For optimal resource usage, apply it to a single chart of a USDT Perpetual pair from your selected exchange. To stop trading a category delete the alert created for that category.
❓ Q: How frequently does the indicator scan for new signals? A: The indicator scans all coins in your selected categories at the close of each bar (every hour if you selected the 1H timeframe).
3Commas Integration
❓ Q: Do I need a 3Commas account? A: Yes, a 3Commas account with active DCA bots (both LONG and SHORT) is required for automated trade execution. A paid subscription is needed, as multipair Bots and multiple simultaneous deals are involved.
❓ Q: How do I set the leverage? A: Set the leverage identically in both the indicator settings and your 3Commas DCA bots (the max supported leverage is 50x). Always be careful about leverage, as it amplifies both profits and losses.
❓ Q: Where do I find my 3Commas Bot IDs and Email Token? A: Open your 3Commas DCA bot and scroll to the "Messages" section. You'll find the Bot ID and Email Token within any message (e.g., "Start Deal").
Display Settings
❓ Q: What does the Sensitivity setting do? A: It adjusts the sensitivity of signal generation. "Default" provides a balanced approach with moderate signal frequency. "Aggressive" lowers the thresholds for signal generation, potentially increasing trade frequency but may include more noise. "Test Mode" is the most sensitive setting, useful for testing alert configurations but not recommended for live trading. Higher risk levels may generate more signals but with potentially lower average quality, while lower risk levels produce fewer but potentially better signals.
❓ Q: What does "Show fired alerts" do? A: The "Show fired alerts" option displays a label on your chart showing which signals have been fired and sent to 3Commas during the most recent candle closes. This visual indicator helps you confirm that your alerts are working properly and shows which coins from your selected category have triggered signals. It's useful when setting up and testing the system, allowing you to verify that signals are being sent to 3Commas as expected and their frequency over time.
❓ Q: What does "Show coin/token metrics" do? A: This toggle displays detailed technical metrics for the specific coin/token currently shown on your chart. When enabled, it shows statistics for the last closed candle for that coin.
❓ Q: What does "Show most liquid days/times" do? A: This toggle displays color-coded background highlighting to indicate periods of varying market liquidity throughout the trading week. Green backgrounds show generally higher liquidity periods (typically weekday trading hours), yellow highlights potentially manipulative periods (often Sunday/Monday overnight), and gray indicates low liquidity periods (when major markets are closed or during late hours).
⚠️ Disclaimer
This indicator is for informational and educational purposes only and does not constitute financial advice. Trading cryptocurrencies involves significant risk, including the potential loss of all invested capital, and past performance is not indicative of future results.
Always conduct your own thorough research (DYOR) and understand the risks involved before making any trading decisions. Trading with leverage significantly amplifies both potential profits and losses - exercise extreme caution when using leverage and never risk more than you can afford to lose.
The Bot ID and Email Token information are transmitted directly from TradingView to 3Commas via secure connections. No third party or entity will ever have access to this data (including the Author). Do not share your 3Commas credentials with anyone.
This indicator is not affiliated with, endorsed by, or sponsored by TradingView or 3Commas.

Sniper Trade Pro (ES 15-Min) - Topstep Optimized🔹 Overview
Sniper Trade Pro is an advanced algorithmic trading strategy designed specifically for E-mini S&P 500 (ES) Futures on the 15-minute timeframe. This strategy is optimized for Topstep 50K evaluations, incorporating strict risk management to comply with their max $1,000 daily loss limit while maintaining a high probability of success.
It uses a multi-confirmation approach, integrating:
✅ Money Flow Divergence (MFD) → To track liquidity imbalances and institutional accumulation/distribution.
✅ Trend Confirmation (EMA + VWAP) → To identify strong trend direction and avoid choppy markets.
✅ ADX Strength Filter → To ensure entries only occur in trending conditions, avoiding weak setups.
✅ Break-Even & Dynamic Stop-Losses → To reduce drawdowns and protect profits dynamically.
This script automatically generates Buy and Sell signals and provides built-in risk management for automated trading execution through TradingView Webhooks.
🔹 How Does This Strategy Work?
📌 1. Trend Confirmation (EMA + VWAP)
The strategy uses:
✔ 9-EMA & 21-EMA: Fast-moving averages to detect short-term momentum.
✔ VWAP (Volume-Weighted Average Price): Ensures trades align with institutional volume flow.
How it works:
Bullish Condition: 9-EMA above 21-EMA AND price above VWAP → Confirms buy trend.
Bearish Condition: 9-EMA below 21-EMA AND price below VWAP → Confirms sell trend.
📌 2. Liquidity & Money Flow Divergence (MFD)
This indicator measures liquidity shifts by tracking momentum changes in price and volume.
✔ MFD Calculation:
Uses Exponential Moving Average (EMA) of Momentum (MOM) to detect changes in buying/selling pressure.
If MFD is above its moving average, it signals liquidity inflows → bullish strength.
If MFD is below its moving average, it signals liquidity outflows → bearish weakness.
Why is this important?
Detects when Smart Money is accumulating or distributing before major moves.
Filters out false breakouts by confirming momentum strength before entry.
📌 3. Trade Entry Triggers (Candlestick Patterns & ADX Filter)
To avoid random entries, the strategy waits for specific candlestick confirmations with ADX trend strength:
✔ Bullish Entry (Buy Signal) → Requires:
Bullish Engulfing Candle (Reversal confirmation)
ADX > 20 (Ensures strong trending conditions)
MFD above its moving average (Liquidity inflows)
9-EMA > 21-EMA & price above VWAP (Trend confirmation)
✔ Bearish Entry (Sell Signal) → Requires:
Bearish Engulfing Candle (Reversal confirmation)
ADX > 20 (Ensures strong trending conditions)
MFD below its moving average (Liquidity outflows)
9-EMA < 21-EMA & price below VWAP (Trend confirmation)
📌 4. Risk Management & Profit Protection
This strategy is built with strict risk management to maintain low drawdowns and maximize profits:
✔ Dynamic Position Sizing → Automatically adjusts trade size to risk a fixed $400 per trade.
✔ Adaptive Stop-Losses → Uses ATR-based stop-loss (0.8x ATR) to adapt to market volatility.
✔ Take-Profit Targets → Fixed at 2x ATR for a Risk:Reward ratio of 2:1.
✔ Break-Even Protection → Moves stop-loss to entry once price moves 1x ATR in profit, locking in gains.
✔ Max Daily Loss Limit (-$1,000) → Stops trading if total losses exceed $1,000, complying with Topstep rules.

Hierarchical + K-Means Clustering Strategy===== USER GUIDE =====
Hierarchical + K-Means Clustering Strategy
OVERVIEW:
This strategy combines hierarchical clustering and K-means algorithms to analyze market volatility patterns
and generate trading signals. It uses a modified SuperTrend indicator with ATR-based volatility clustering
to identify potential trend changes and market conditions.
KEY FEATURES:
- Advanced volatility analysis using hierarchical clustering and K-means algorithms
- Modified SuperTrend indicator for trend identification
- Multiple filter options including moving average and ADX trend strength
- Volume-based exit mechanism to protect profits
- Customizable appearance settings
SETTINGS EXPLANATION:
1. SuperTrend Settings:
- ATR Length: Period for ATR calculation (default: 11)
- SuperTrend Factor: Multiplier for ATR to determine trend bands (default: 3)
2. Hierarchical Clustering Settings:
- Training Data Length: Number of bars used for clustering analysis (default: 200)
3. Appearance Settings:
- Transparency 1 & 2: Control the opacity of trend lines and fills
- Bullish/Bearish Color: Colors for uptrend and downtrend visualization
4. Time Settings:
- Start Year/Month: Define when the strategy should start executing trades
5. Filter Settings:
- Moving Average Filter: Uses SMA to filter trades (only enter when price is on correct side of MA)
- Trend Strength Filter: Uses ADX to ensure trades are taken in strong trend conditions
6. Volume Stop Loss Settings:
- Volume Ratio Threshold: Controls sensitivity of volume-based exits
- Monitoring Delay Bars: Number of bars to wait before monitoring volume for exit signals
HOW TO USE:
1. Apply the indicator to your chart
2. Adjust settings according to your trading preferences and timeframe
3. Long signals appear when price crosses above the SuperTrend line (▲k marker)
4. Short signals appear when price crosses below the SuperTrend line (▼k marker)
5. The strategy automatically manages exits based on volume balance conditions
INTERPRETATION:
- Green line/area: Bullish trend - consider long positions
- Red line/area: Bearish trend - consider short positions
- Yellow line: Moving average for additional trend confirmation
- Volume balance exits occur when buying/selling pressure equalizes
RECOMMENDED TIMEFRAMES:
This strategy works best on 1H, 4H, and daily charts for most markets.
For highly volatile assets, shorter timeframes may also be effective.
RISK MANAGEMENT:
Always use proper position sizing and consider setting additional stop losses
beyond the strategy's built-in exit mechanisms.
===== END OF USER GUIDE =====

Divergence IQ [TradingIQ]Hello Traders!
Introducing "Divergence IQ"
Divergence IQ lets traders identify divergences between price action and almost ANY TradingView technical indicator. This tool is designed to help you spot potential trend reversals and continuation patterns with a range of configurable features.
Features
Divergence Detection
Detects both regular and hidden divergences for bullish and bearish setups by comparing price movements with changes in the indicator.
Offers two detection methods: one based on classic pivot point analysis and another that provides immediate divergence signals.
Option to use closing prices for divergence detection, allowing you to choose the data that best fits your strategy.
Normalization Options:
Includes multiple normalization techniques such as robust scaling, rolling Z-score, rolling min-max, or no normalization at all.
Adjustable normalization window lets you customize the indicator to suit various market conditions.
Option to display the normalized indicator on the chart for clearer visual comparison.
Allows traders to take indicators that aren't oscillators, and convert them into an oscillator - allowing for better divergence detection.
Simulated Trade Management:
Integrates simulated trade entries and exits based on divergence signals to demonstrate potential trading outcomes.
Customizable exit strategies with options for ATR-based or percentage-based stop loss and profit target settings.
Automatically calculates key trade metrics such as profit percentage, win rate, profit factor, and total trade count.
Visual Enhancements and On-Chart Displays:
Color-coded signals differentiate between bullish, bearish, hidden bullish, and hidden bearish divergence setups.
On-chart labels, lines, and gradient flow visualizations clearly mark divergence signals, entry points, and exit levels.
Configurable settings let you choose whether to display divergence signals on the price chart or in a separate pane.
Performance Metrics Table:
A performance table dynamically displays important statistics like profit, win rate, profit factor, and number of trades.
This feature offers an at-a-glance assessment of how the divergence-based strategy is performing.
The image above shows Divergence IQ successfully identifying and trading a bullish divergence between an indicator and price action!
The image above shows Divergence IQ successfully identifying and trading a bearish divergence between an indicator and price action!
The image above shows Divergence IQ successfully identifying and trading a hidden bullish divergence between an indicator and price action!
The image above shows Divergence IQ successfully identifying and trading a hidden bearish divergence between an indicator and price action!
The performance table is designed to provide a clear summary of simulated trade results based on divergence setups. You can easily review key metrics to assess the strategy’s effectiveness over different time periods.
Customization and Adaptability
Divergence IQ offers a wide range of configurable settings to tailor the indicator to your personal trading approach. You can adjust the lookback and lookahead periods for pivot detection, select your preferred method for normalization, and modify trade exit parameters to manage risk according to your strategy. The tool’s clear visual elements and comprehensive performance metrics make it a useful addition to your technical analysis toolbox.
The image above shows Divergence IQ identifying divergences between price action and OBV with no normalization technique applied.
While traders can look for divergences between OBV and price, OBV doesn't naturally behave like an oscillator, with no definable upper and lower threshold, OBV can infinitely increase or decrease.
With Divergence IQ's ability to normalize any indicator, traders can normalize non-oscillator technical indicators such as OBV, CVD, MACD, or even a moving average.
In the image above, the "Robust Scaling" normalization technique is selected. Consequently, the output of OBV has changed and is now behaving similar to an oscillator-like technical indicator. This makes spotting divergences between the indicator and price easier and more appropriate.
The three normalization techniques included will change the indicator's final output to be more compatible with divergence detection.
This feature can be used with almost any technical indicator.
Stop Type
Traders can select between ATR based profit targets and stop losses, or percentage based profit targets and stop losses.
The image above shows options for the feature.
Divergence Detection Method
A natural pitfall of divergence trading is that it generally takes several bars to "confirm" a divergence. This makes trading the divergence complicated, because the entry at time of the divergence might look great; however, the divergence wasn't actually signaled until several bars later.
To circumvent this issue, Divergence IQ offers two divergence detection mechanisms.
Pivot Detection
Pivot detection mode is the same as almost every divergence indicator on TradingView. The Pivots High Low indicator is used to detect market/indicator highs and lows and, consequently, divergences.
This method generally finds the "best looking" divergences, but will always take additional time to confirm the divergence.
Immediate Detection
Immediate detection mode attempts to reduce lag between the divergence and its confirmation to as little as possible while avoiding repainting.
Immediate detection mode still uses the Pivots Detection model to find the first high/low of a divergence. However, the most recent high/low does not utilize the Pivot Detection model, and instead immediately looks for a divergence between price and an indicator.
Immediate Detection Mode will always signal a divergence one bar after it's occurred, and traders can set alerts in this mode to be alerted as soon as the divergence occurs.
TradingView Backtester Integration
Divergence IQ is fully compatible with the TradingView backtester!
Divergence IQ isn’t designed to be a “profitable strategy” for users to trade. Instead, the intention of including the backtester is to let users backtest divergence-based trading strategies between the asset on their chart and almost any technical indicator, and to see if divergences have any predictive utility in that market.
So while the backtester is available in Divergence IQ, it’s for users to personally figure out if they should consider a divergence an actionable insight, and not a solicitation that Divergence IQ is a profitable trading strategy. Divergence IQ should be thought of as a Divergence backtesting toolkit, not a full-feature trading strategy.
Strategy Properties Used For Backtest
Initial Capital: $1000 - a realistic amount of starting capital that will resonate with many traders
Amount Per Trade: 5% of equity - a realistic amount of capital to invest relative to portfolio size
Commission: 0.02% - a conservative amount of commission to pay for trade that is standard in crypto trading, and very high for other markets.
Slippage: 1 tick - appropriate for liquid markets, but must be increased in markets with low activity.
Once more, the backtester is meant for traders to personally figure out if divergences are actionable trading signals on the market they wish to trade with the indicator they wish to use.
And that's all!
If you have any cool features you think can benefit Divergence IQ - please feel free to share them!
Thank you so much TradingView community!
