MTF FVG with Hit Counter HarmoniXTradeMain Purpose of the Indicator:
This indicator is designed to automatically identify Fair Value Gaps (FVG) across three different timeframes simultaneously. The primary goal is to display these key zones on the chart and provide detailed information about price interaction with these levels, enabling traders to make more informed decisions.
Key Features:
Multi-Timeframe FVG Identification:
By default, the indicator identifies and displays FVGs on the Weekly (W), Daily (D), and 4-Hour (240) timeframes.
Users can customize these timeframes in the settings to fit their preferences.
Detailed Hit Counter:
This indicator goes beyond simply showing FVGs; it accurately counts the number of times the price has touched each of the three key FVG levels:
Up: The top line of the FVG
Mid: The midline (equilibrium) of the FVG
Down: The bottom line of the FVG
This information is displayed in a clear label next to each FVG zone, helping traders assess the strength and validity of each level.
Extensive Customization:
Appearance: You can change the colors for bullish and bearish FVGs for each timeframe individually, modify the style of the main and mid lines, and adjust the label size.
Detection Logic: Users can define the minimum size of an FVG for detection based on a percentage or point value.
Mitigation Logic: Two methods are provided for FVG invalidation:
Percentage Mitigation: The FVG is considered mitigated after the price has penetrated it by a specific percentage (e.g., 50%).
Full Fill: The FVG remains valid until the price has completely filled the gap and closed beyond it.
Extend Lines Capability:
To prevent chart clutter and get a better view of future price action, you can extend the FVG lines and labels to the right by a specified number of bars, creating distance from the current candle.
How to Use This Indicator:
Identifying Support and Resistance Zones: FVG areas can act as strong support and resistance levels.
Confirming Entry Points: A price touch and reaction to one of the FVG levels (especially the midline) can be used as a confirmation for entering a trade.
Assessing Level Strength: The number of hits on each level (Up, Mid, Down) indicates which price point within the zone has been more attractive to the market. For example, repeated reactions to the top line of a bearish FVG might suggest strong selling pressure at that level.
Your Feedback for Improvement:
You are invited to use this indicator and share any suggestions, ideas for improvement, or reports of potential issues. Your feedback will be valuable for implementation in future versions.
Cmefutures

Real-Time Price Comparator→ La version française se trouve plus bas ←
Real-Time Price Spread Comparator
This indicator allows you to compare the real-time price difference (spread) between two assets. It is particularly useful for spotting arbitrage opportunities or price discrepancies between different markets.
💡 Why is this useful?
This tool is especially practical for monitoring the gap between CME futures and the spot market. If the spread becomes too large, we can expect the market to rebalance, which can help anticipate potential price movements.
📌 Features:
✅ Compare two assets of your choice (default: BTC CME vs. BTC OANDA).
✅ Displays the spread as a real-time value on the chart.
✅ Customizable threshold for alerts when the spread exceeds a certain value.
✅ Visual alert: The label changes color and an alert icon appears when the threshold is exceeded.
✅ Adjustable label position to avoid obstructing candlestick wicks.
🛠️ How to Use:
1️⃣ Choose the asset to compare (for example, BTC CME).
2️⃣ Select the main chart (the one you are currently viewing, such as BTC OANDA).
3️⃣ Set the alert threshold (the spread value that will trigger an alert).
4️⃣ Adjust the label position using the offset settings if needed.
5️⃣ When the spread exceeds the threshold, an alert will be displayed!
-------------------------------------------------
Comparateur de Spread en Temps Réel
Cet indicateur permet de comparer en temps réel la différence de prix (spread) entre deux actifs. Il est particulièrement utile pour détecter des opportunités d’arbitrage ou des écarts de prix entre différents marchés.
💡 Pourquoi c'est utile ?
Cet outil est pratique pour surveiller l’écart entre les contrats à terme CME et le marché spot. Si l’écart devient trop important, on peut s’attendre à ce que le marché s’équilibre, ce qui peut nous orienter sur les futurs mouvements du prix.
📌 Fonctionnalités :
✅ Comparez deux actifs de votre choix (par défaut : BTC CME vs. BTC OANDA).
✅ Affiche le spread en temps réel directement sur le graphique.
✅ Définissez un seuil d’alerte pour être notifié visuellement sur le graphique si le spread dépasse une certaine valeur.
✅ Alerte visuelle : le label change de couleur et une icône d’alerte apparaît en cas de dépassement.
✅ Ajustez la position du label pour éviter qu’il ne cache les mèches des bougies.
🛠️ Comment l’utiliser :
1️⃣ Choisissez l’actif à comparer (exemple : BTC CME).
2️⃣ Sélectionnez ensuite l’actif affiché sur votre graphique principal (exemple : BTC OANDA).
3️⃣ Définissez le seuil d’alerte (valeur du spread qui déclenchera une alerte).
4️⃣ Ajustez la position du label grâce aux options d’offset si nécessaire.
5️⃣ Si le spread dépasse le seuil, une alerte visuelle apparaîtra !

Celestial Pair Spread Hello friends, after a very long time!
Today, I tried to put into code an idea that came to my mind spontaneously and suddenly.
Note :
This script is experimental and improvable.
I haven't had a chance to try it yet.
TIMEFRAME : 1D (Daily Bars)
CELESTIAL SPREAD
The spread moves in a very limited area and is consistent within itself, especially on days far from the end of the contract.
That's why there is a reassuring sky atmosphere. That's why this name was given completely improvised.
Basic logic of the script
We enter the name of the CME Futures contract we want to enter:
Ex : CL1! , ES1! , ZC1! , NQ1!
The script creates us a pair trade parity divided into secondary contracts.
Example : ES1!/ES2!
What is pair trading?
I will explain briefly here.
For users who are wondering:
www.investopedia.com
Let's get back to our topic.
Now we have created a parity that does not actually exist.
This parity is the manifestation of the relative movements of two contracts.
When the parity rises, ES1! increased,ES2! has fallen.
In the opposite case, We can say: ES1! Contract has been dropped ES2! has increased.
Pair trading is generally a trade that needs to be kept in mind from time to time.
It is a method preferred by professionals who can process very quickly.
Market risk is minimal, but since 2 contracts are purchased, more money is paid and very low percentage profits are made.
It is very expensive to do pair trading, especially with oil and its derivatives and interest security derivatives.
The contract we are considering has micros. (small-item contracts tied to the same value)
So when we switch to our broker MES1!/MES2! We will trade.
For all CME futures :
www.cmegroup.com
Anyway, let's continue:
The script created the parity showing its relationship with the next contract and plotted it as bars.
Celestial bands are just like Bollinger bands, but they consist of 3 bands based on percentage changes rather than standard deviation.
The middle band is obtained from moving averages.
The upper and lower bands are the middle band subjected to a threshold value.
The threshold value can be changed.
0.15 percent was charged for this script.
CAUTION :
As can be seen in the example below;
The most important thing is not to make any transactions when the contract switch dates are approaching.
Therefore, it is recommended to use it just below the main chart.
The blue bars in the parity are
Values that outside the upper and lower threshold values are colored blue.
For this condition
Alerts has been added.
Don't forget to add alert and edit.
MAIN PURPOSE
It is aimed to start a pair trade when such conditions come and to quickly close the trades when the parity basis reaches the value.
OTHER IMPORTANT POINTS
Other issues are broker related issues.
Difference between initial margins and maintanence margins of contracts (between 1! and 2!)
It shouldn't be too high.
The commission should not be too high.
Leverage must be high because the profit percentage is very low.
To calculate leverage you must divide your contract size by the relevant margin requirement.
Sample margin requirement table:
www.interactivebrokers.com
RISKS
It is an experimental and intellectual script,
the risk of contract price differences (maybe it will not leave a profit except for very extreme values)
I remind you of the quickness risk that comes from a two-legged trade.
Alerts definitely synchronized with an audible alert sent to a smartphone as an e-mail notification and displayed on the locked screen for quick action.
Best regards!

iGapFinderHi everybody!
I decided to release this script to help traders keeping track of market gaps on the CME.
The script works in general for any market and at any timeframe.
The script allows the user to:
- Identify price gaps of a customized amplitude (Gap Width)
- Compute the probabilities of filling them (specific for bullish and bearish gaps or cumulative)
- Visualize gaps on the chart through red and green price areas.
- Visualize the last N unfilled bullish and bearish gaps together with their time of creation.

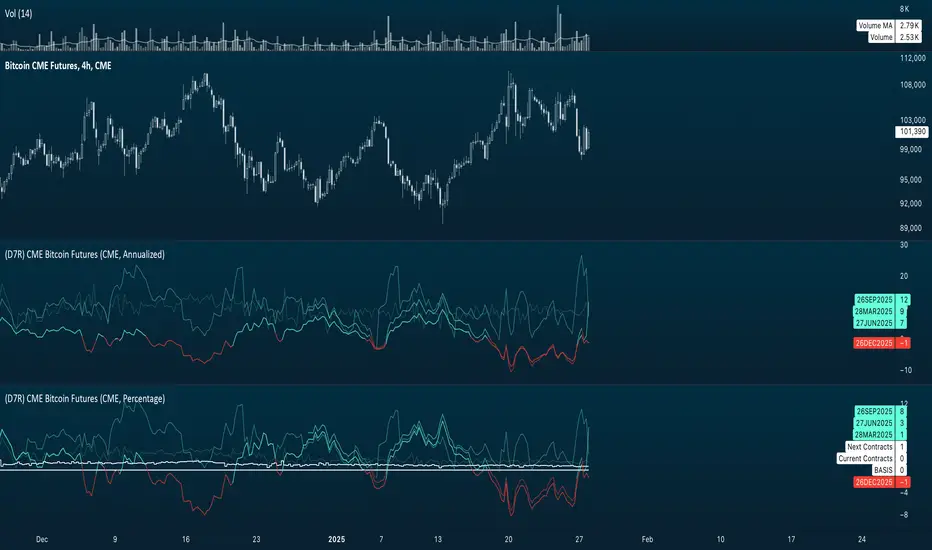
(D7R) CME Bitcoin FuturesCME Bitcoin Quarterly Contract Futures Price with 3 different display modes: (Percentage, Delta, Absolute).
This information can be used to understand when futures are trading at relative strong/weak premium or discount against each other.
This information can either be used for cash-n-carry arbitrage, inter-exchange arbitrage, hedging or directional price speculation.
BITCOIN CME FUTURES GAPSDisplays information about Bitcoin CME Futures Gaps over BTCUSD (or XBTUSD) charts.
You can configure a threshold percentage to only display gaps whose size is greater than that percentage. The gap precentage is calculated based on the current close price.
Gaps up are displayed in Orange, gaps down in Green

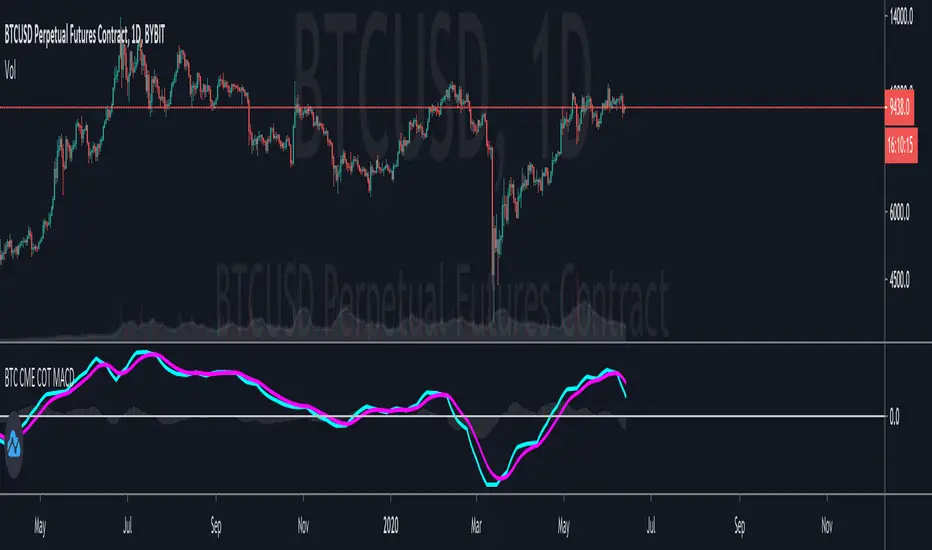
Bitcoin CME Retail vs Professionals MACD
This is an interesting study using the data provided by the Bitcoin CME Commitment of Traders report.
The MACD plot the difference between the Retail Traders positions and the Professional Traders positions.
The general idea is that Professional Traders have a better read on the market than Retail Traders.
The signal line helps to identify the trend that it is moving in.
I believe that this plot helps to visualize the overall market sentiment better than the raw COT data.
Try it out and let me know what you think!
Gap Trading Strategy: CME BitcoinI created a strategy which finds gaps on CME Futures market for Bitcoin, BTC1! and opens a long or short position on the crypto exchange depending on what kind of gap was found (up or down) on CME.
Up gap: today open price > previous day high price
Down gap: today open price < previous day low price
Two lines below the main chart show when gaps appear. The green line represents the size of up gaps, when it crosses zero it gives a long signal. The red line - represents the size of down gaps, when it crosses zero - short signal.
Instead of having to look between multiple charts, this simply overlays the past weeks open and close should a gap appear.
Usage:
Strategy flips long / short depending of indicator signals. It could cut the position by stop loss or take profit.
Features:
ability to set stop loss and take profit in %
ability to set delta for gaps (if you want to filter small ones)
ability to choose strategy type. Standart: Long Up/Short Down || Inverse: Short Up/Long Down.
Backtesting:
Backtested on BTCPERP ( FTX ) and XBTUSD (Bitmex).
It shows a low drawdown, a small number of trades and 50% of profit for the 2020.
For example, I set high delta for down gaps to filter small ones
Strategy doesn't repaint.

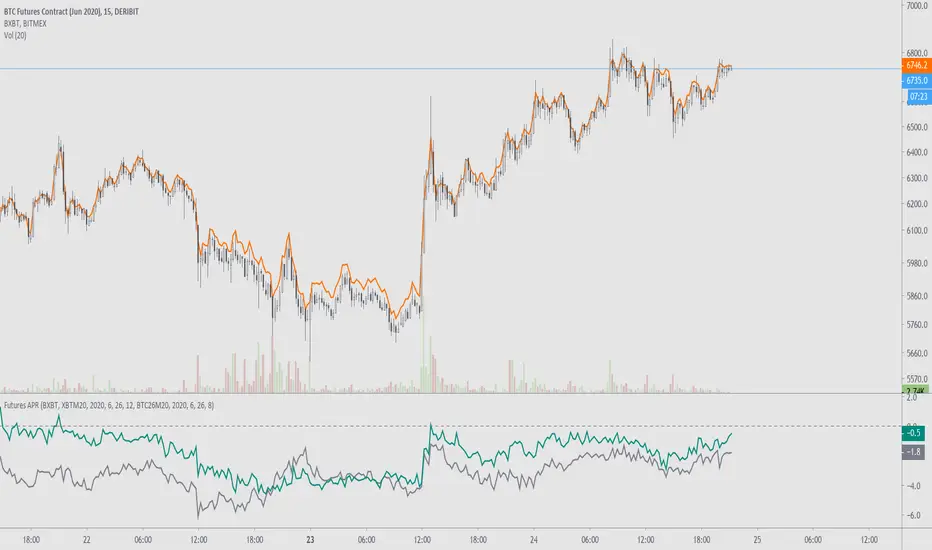
Futures APRFutures basis % for any ticker.
Requires: an index to compare against, the futures ticker, and the expiration year/month/day/hour. Optional second ticker to compare with.
Example explanation using bitcoin futures:
For Deribit, their futures expire at 0800UTC and the ticker will show the date of expiration. For example, BTC27H20's expiration is the 27th of March, 2020, at 0800UTC. For BitMEX, their futures expire at 1200UTC and have the same expiration dates.
www.deribit.com
"3 and 6 months quarterly of the March, June, September, December cycle; Quarterly futures expire the last Friday of each calendar quarter at 08.00 UTC."
www.bitmex.com
Archived page here: archive.is
"This contract settles on the .BXBT30M Index value as of the Jun 26, 5:00 AM (12:00:00 PM UTC)."
Once the June 2020 contract does expire you can always replace "XBTM20" with the currently running contract.
Notes on futures charts that never expire:
For OKEx, their futures charts are continuous, meaning that the indicator's values won't be accurate past prior expirations. This will be the same for other continuous futures charts such as BTC1!. This is because they are displaying previously expired contracts combined together.
CME Equity Futures Price Limits
Breakers for CME's futures contracts. Should work on CST/EST/UTC charts.
CME says it uses the last 30 seconds of the session to grab a reference price, so I took the open of the last session's candle because it's easier.
Out of session breakers: +/-5%
Limit downs: -7%/-13%/-20%
There are some minor nuances for the later part of the NY session but I don't really care to add that in right now.
Options:
- Input a manual reference price to override the selected price for accuracy.
- Show only the current/last session's limits. This breaks the in session limit down lines.
Live prices:
www.cmegroup.com
Month codes:
www.cmegroup.com
Reference:
www.cmegroup.com
It's best to check the last updated reference price to ensure it's correct.

CMEs Window (Beyond Candle)> Find window in CME Exchange
> Yellow Dot = Rising Window
> Yellow Dot = Falling Window

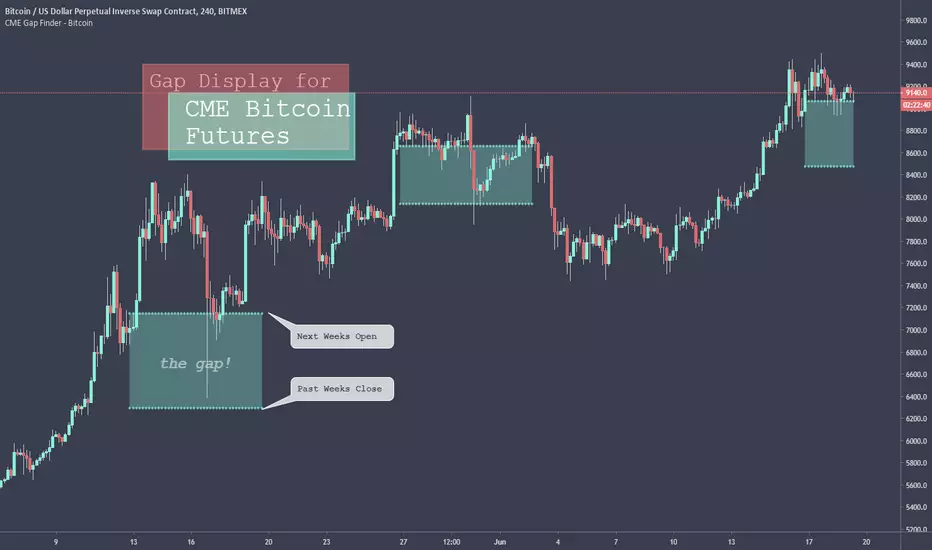
CME Gap Finder - BitcoinOnly for Bitcoin!
This indicator locates weekly gaps created by the CME Futures market for Bitcoin.
As you can see, Bitcoin tends to close the weekly gaps created in the futures market so I thought this could be a very useful tool.
Instead of having to look between multiple charts, this simply overlays the past weeks open and close should a gap appear.
I hope you find this indicator useful!
Cheers!