Color█ OVERVIEW
This library is a Pine Script® programming tool for advanced color processing. It provides a comprehensive set of functions for specifying and analyzing colors in various color spaces, mixing and manipulating colors, calculating custom gradients and schemes, detecting contrast, and converting colors to or from hexadecimal strings.
█ CONCEPTS
Color
Color refers to how we interpret light of different wavelengths in the visible spectrum . The colors we see from an object represent the light wavelengths that it reflects, emits, or transmits toward our eyes. Some colors, such as blue and red, correspond directly to parts of the spectrum. Others, such as magenta, arise from a combination of wavelengths to which our minds assign a single color.
The human interpretation of color lends itself to many uses in our world. In the context of financial data analysis, the effective use of color helps transform raw data into insights that users can understand at a glance. For example, colors can categorize series, signal market conditions and sessions, and emphasize patterns or relationships in data.
Color models and spaces
A color model is a general mathematical framework that describes colors using sets of numbers. A color space is an implementation of a specific color model that defines an exact range (gamut) of reproducible colors based on a set of primary colors , a reference white point , and sometimes additional parameters such as viewing conditions.
There are numerous different color spaces — each describing the characteristics of color in unique ways. Different spaces carry different advantages, depending on the application. Below, we provide a brief overview of the concepts underlying the color spaces supported by this library.
RGB
RGB is one of the most well-known color models. It represents color as an additive mixture of three primary colors — red, green, and blue lights — with various intensities. Each cone cell in the human eye responds more strongly to one of the three primaries, and the average person interprets the combination of these lights as a distinct color (e.g., pure red + pure green = yellow).
The sRGB color space is the most common RGB implementation. Developed by HP and Microsoft in the 1990s, sRGB provided a standardized baseline for representing color across CRT monitors of the era, which produced brightness levels that did not increase linearly with the input signal. To match displays and optimize brightness encoding for human sensitivity, sRGB applied a nonlinear transformation to linear RGB signals, often referred to as gamma correction . The result produced more visually pleasing outputs while maintaining a simple encoding. As such, sRGB quickly became a standard for digital color representation across devices and the web. To this day, it remains the default color space for most web-based content.
TradingView charts and Pine Script `color.*` built-ins process color data in sRGB. The red, green, and blue channels range from 0 to 255, where 0 represents no intensity, and 255 represents maximum intensity. Each combination of red, green, and blue values represents a distinct color, resulting in a total of 16,777,216 displayable colors.
CIE XYZ and xyY
The XYZ color space, developed by the International Commission on Illumination (CIE) in 1931, aims to describe all color sensations that a typical human can perceive. It is a cornerstone of color science, forming the basis for many color spaces used today. XYZ, and the derived xyY space, provide a universal representation of color that is not tethered to a particular display. Many widely used color spaces, including sRGB, are defined relative to XYZ or derived from it.
The CIE built the color space based on a series of experiments in which people matched colors they perceived from mixtures of lights. From these experiments, the CIE developed color-matching functions to calculate three components — X, Y, and Z — which together aim to describe a standard observer's response to visible light. X represents a weighted response to light across the color spectrum, with the highest contribution from long wavelengths (e.g., red). Y represents a weighted response to medium wavelengths (e.g., green), and it corresponds to a color's relative luminance (i.e., brightness). Z represents a weighted response to short wavelengths (e.g., blue).
From the XYZ space, the CIE developed the xyY chromaticity space, which separates a color's chromaticity (hue and colorfulness) from luminance. The CIE used this space to define the CIE 1931 chromaticity diagram , which represents the full range of visible colors at a given luminance. In color science and lighting design, xyY is a common means for specifying colors and visualizing the supported ranges of other color spaces.
CIELAB and Oklab
The CIELAB (L*a*b*) color space, derived from XYZ by the CIE in 1976, expresses colors based on opponent process theory. The L* component represents perceived lightness, and the a* and b* components represent the balance between opposing unique colors. The a* value specifies the balance between green and red , and the b* value specifies the balance between blue and yellow .
The primary intention of CIELAB was to provide a perceptually uniform color space, where fixed-size steps through the space correspond to uniform perceived changes in color. Although relatively uniform, the color space has been found to exhibit some non-uniformities, particularly in the blue part of the color spectrum. Regardless, modern applications often use CIELAB to estimate perceived color differences and calculate smooth color gradients.
In 2020, a new LAB-oriented color space, Oklab , was introduced by Björn Ottosson as an attempt to rectify the non-uniformities of other perceptual color spaces. Similar to CIELAB, the L value in Oklab represents perceived lightness, and the a and b values represent the balance between opposing unique colors. Oklab has gained widespread adoption as a perceptual space for color processing, with support in the latest CSS Color specifications and many software applications.
Cylindrical models
A cylindrical-coordinate model transforms an underlying color model, such as RGB or LAB, into an alternative expression of color information that is often more intuitive for the average person to use and understand.
Instead of a mixture of primary colors or opponent pairs, these models represent color as a hue angle on a color wheel , with additional parameters that describe other qualities such as lightness and colorfulness (a general term for concepts like chroma and saturation). In cylindrical-coordinate spaces, users can select a color and modify its lightness or other qualities without altering the hue.
The three most common RGB-based models are HSL (Hue, Saturation, Lightness), HSV (Hue, Saturation, Value), and HWB (Hue, Whiteness, Blackness). All three define hue angles in the same way, but they define colorfulness and lightness differently. Although they are not perceptually uniform, HSL and HSV are commonplace in color pickers and gradients.
For CIELAB and Oklab, the cylindrical-coordinate versions are CIELCh and Oklch , which express color in terms of perceived lightness, chroma, and hue. They offer perceptually uniform alternatives to RGB-based models. These spaces create unique color wheels, and they have more strict definitions of lightness and colorfulness. Oklch is particularly well-suited for generating smooth, perceptual color gradients.
Alpha and transparency
Many color encoding schemes include an alpha channel, representing opacity . Alpha does not help define a color in a color space; it determines how a color interacts with other colors in the display. Opaque colors appear with full intensity on the screen, whereas translucent (semi-opaque) colors blend into the background. Colors with zero opacity are invisible.
In Pine Script, there are two ways to specify a color's alpha:
• Using the `transp` parameter of the built-in `color.*()` functions. The specified value represents transparency (the opposite of opacity), which the functions translate into an alpha value.
• Using eight-digit hexadecimal color codes. The last two digits in the code represent alpha directly.
A process called alpha compositing simulates translucent colors in a display. It creates a single displayed color by mixing the RGB channels of two colors (foreground and background) based on alpha values, giving the illusion of a semi-opaque color placed over another color. For example, a red color with 80% transparency on a black background produces a dark shade of red.
Hexadecimal color codes
A hexadecimal color code (hex code) is a compact representation of an RGB color. It encodes a color's red, green, and blue values into a sequence of hexadecimal ( base-16 ) digits. The digits are numerals ranging from `0` to `9` or letters from `a` (for 10) to `f` (for 15). Each set of two digits represents an RGB channel ranging from `00` (for 0) to `ff` (for 255).
Pine scripts can natively define colors using hex codes in the format `#rrggbbaa`. The first set of two digits represents red, the second represents green, and the third represents blue. The fourth set represents alpha . If unspecified, the value is `ff` (fully opaque). For example, `#ff8b00` and `#ff8b00ff` represent an opaque orange color. The code `#ff8b0033` represents the same color with 80% transparency.
Gradients
A color gradient maps colors to numbers over a given range. Most color gradients represent a continuous path in a specific color space, where each number corresponds to a mix between a starting color and a stopping color. In Pine, coders often use gradients to visualize value intensities in plots and heatmaps, or to add visual depth to fills.
The behavior of a color gradient depends on the mixing method and the chosen color space. Gradients in sRGB usually mix along a straight line between the red, green, and blue coordinates of two colors. In cylindrical spaces such as HSL, a gradient often rotates the hue angle through the color wheel, resulting in more pronounced color transitions.
Color schemes
A color scheme refers to a set of colors for use in aesthetic or functional design. A color scheme usually consists of just a few distinct colors. However, depending on the purpose, a scheme can include many colors.
A user might choose palettes for a color scheme arbitrarily, or generate them algorithmically. There are many techniques for calculating color schemes. A few simple, practical methods are:
• Sampling a set of distinct colors from a color gradient.
• Generating monochromatic variants of a color (i.e., tints, tones, or shades with matching hues).
• Computing color harmonies — such as complements, analogous colors, triads, and tetrads — from a base color.
This library includes functions for all three of these techniques. See below for details.
█ CALCULATIONS AND USE
Hex string conversion
The `getHexString()` function returns a string containing the eight-digit hexadecimal code corresponding to a "color" value or set of sRGB and transparency values. For example, `getHexString(255, 0, 0)` returns the string `"#ff0000ff"`, and `getHexString(color.new(color.red, 80))` returns `"#f2364533"`.
The `hexStringToColor()` function returns the "color" value represented by a string containing a six- or eight-digit hex code. The `hexStringToRGB()` function returns a tuple containing the sRGB and transparency values. For example, `hexStringToColor("#f23645")` returns the same value as color.red .
Programmers can use these functions to parse colors from "string" inputs, perform string-based color calculations, and inspect color data in text outputs such as Pine Logs and tables.
Color space conversion
All other `get*()` functions convert a "color" value or set of sRGB channels into coordinates in a specific color space, with transparency information included. For example, the tuple returned by `getHSL()` includes the color's hue, saturation, lightness, and transparency values.
To convert data from a color space back to colors or sRGB and transparency values, use the corresponding `*toColor()` or `*toRGB()` functions for that space (e.g., `hslToColor()` and `hslToRGB()`).
Programmers can use these conversion functions to process inputs that define colors in different ways, perform advanced color manipulation, design custom gradients, and more.
The color spaces this library supports are:
• sRGB
• Linear RGB (RGB without gamma correction)
• HSL, HSV, and HWB
• CIE XYZ and xyY
• CIELAB and CIELCh
• Oklab and Oklch
Contrast-based calculations
Contrast refers to the difference in luminance or color that makes one color visible against another. This library features two functions for calculating luminance-based contrast and detecting themes.
The `contrastRatio()` function calculates the contrast between two "color" values based on their relative luminance (the Y value from CIE XYZ) using the formula from version 2 of the Web Content Accessibility Guidelines (WCAG) . This function is useful for identifying colors that provide a sufficient brightness difference for legibility.
The `isLightTheme()` function determines whether a specified background color represents a light theme based on its contrast with black and white. Programmers can use this function to define conditional logic that responds differently to light and dark themes.
Color manipulation and harmonies
The `negative()` function calculates the negative (i.e., inverse) of a color by reversing the color's coordinates in either the sRGB or linear RGB color space. This function is useful for calculating high-contrast colors.
The `grayscale()` function calculates a grayscale form of a specified color with the same relative luminance.
The functions `complement()`, `splitComplements()`, `analogousColors()`, `triadicColors()`, `tetradicColors()`, `pentadicColors()`, and `hexadicColors()` calculate color harmonies from a specified source color within a given color space (HSL, CIELCh, or Oklch). The returned harmonious colors represent specific hue rotations around a color wheel formed by the chosen space, with the same defined lightness, saturation or chroma, and transparency.
Color mixing and gradient creation
The `add()` function simulates combining lights of two different colors by additively mixing their linear red, green, and blue components, ignoring transparency by default. Users can calculate a transparency-weighted mixture by setting the `transpWeight` argument to `true`.
The `overlay()` function estimates the color displayed on a TradingView chart when a specific foreground color is over a background color. This function aids in simulating stacked colors and analyzing the effects of transparency.
The `fromGradient()` and `fromMultiStepGradient()` functions calculate colors from gradients in any of the supported color spaces, providing flexible alternatives to the RGB-based color.from_gradient() function. The `fromGradient()` function calculates a color from a single gradient. The `fromMultiStepGradient()` function calculates a color from a piecewise gradient with multiple defined steps. Gradients are useful for heatmaps and for coloring plots or drawings based on value intensities.
Scheme creation
Three functions in this library calculate palettes for custom color schemes. Scripts can use these functions to create responsive color schemes that adjust to calculated values and user inputs.
The `gradientPalette()` function creates an array of colors by sampling a specified number of colors along a gradient from a base color to a target color, in fixed-size steps.
The `monoPalette()` function creates an array containing monochromatic variants (tints, tones, or shades) of a specified base color. Whether the function mixes the color toward white (for tints), a form of gray (for tones), or black (for shades) depends on the `grayLuminance` value. If unspecified, the function automatically chooses the mix behavior with the highest contrast.
The `harmonyPalette()` function creates a matrix of colors. The first column contains the base color and specified harmonies, e.g., triadic colors. The columns that follow contain tints, tones, or shades of the harmonic colors for additional color choices, similar to `monoPalette()`.
█ EXAMPLE CODE
The example code at the end of the script generates and visualizes color schemes by processing user inputs. The code builds the scheme's palette based on the "Base color" input and the additional inputs in the "Settings/Inputs" tab:
• "Palette type" specifies whether the palette uses a custom gradient, monochromatic base color variants, or color harmonies with monochromatic variants.
• "Target color" sets the top color for the "Gradient" palette type.
• The "Gray luminance" inputs determine variation behavior for "Monochromatic" and "Harmony" palette types. If "Auto" is selected, the palette mixes the base color toward white or black based on its brightness. Otherwise, it mixes the color toward the grayscale color with the specified relative luminance (from 0 to 1).
• "Harmony type" specifies the color harmony used in the palette. Each row in the palette corresponds to one of the harmonious colors, starting with the base color.
The code creates a table on the first bar to display the collection of calculated colors. Each cell in the table shows the color's `getHexString()` value in a tooltip for simple inspection.
Look first. Then leap.
█ EXPORTED FUNCTIONS
Below is a complete list of the functions and overloads exported by this library.
getRGB(source)
Retrieves the sRGB red, green, blue, and transparency components of a "color" value.
getHexString(r, g, b, t)
(Overload 1 of 2) Converts a set of sRGB channel values to a string representing the corresponding color's hexadecimal form.
getHexString(source)
(Overload 2 of 2) Converts a "color" value to a string representing the sRGB color's hexadecimal form.
hexStringToRGB(source)
Converts a string representing an sRGB color's hexadecimal form to a set of decimal channel values.
hexStringToColor(source)
Converts a string representing an sRGB color's hexadecimal form to a "color" value.
getLRGB(r, g, b, t)
(Overload 1 of 2) Converts a set of sRGB channel values to a set of linear RGB values with specified transparency information.
getLRGB(source)
(Overload 2 of 2) Retrieves linear RGB channel values and transparency information from a "color" value.
lrgbToRGB(lr, lg, lb, t)
Converts a set of linear RGB channel values to a set of sRGB values with specified transparency information.
lrgbToColor(lr, lg, lb, t)
Converts a set of linear RGB channel values and transparency information to a "color" value.
getHSL(r, g, b, t)
(Overload 1 of 2) Converts a set of sRGB channels to a set of HSL values with specified transparency information.
getHSL(source)
(Overload 2 of 2) Retrieves HSL channel values and transparency information from a "color" value.
hslToRGB(h, s, l, t)
Converts a set of HSL channel values to a set of sRGB values with specified transparency information.
hslToColor(h, s, l, t)
Converts a set of HSL channel values and transparency information to a "color" value.
getHSV(r, g, b, t)
(Overload 1 of 2) Converts a set of sRGB channels to a set of HSV values with specified transparency information.
getHSV(source)
(Overload 2 of 2) Retrieves HSV channel values and transparency information from a "color" value.
hsvToRGB(h, s, v, t)
Converts a set of HSV channel values to a set of sRGB values with specified transparency information.
hsvToColor(h, s, v, t)
Converts a set of HSV channel values and transparency information to a "color" value.
getHWB(r, g, b, t)
(Overload 1 of 2) Converts a set of sRGB channels to a set of HWB values with specified transparency information.
getHWB(source)
(Overload 2 of 2) Retrieves HWB channel values and transparency information from a "color" value.
hwbToRGB(h, w, b, t)
Converts a set of HWB channel values to a set of sRGB values with specified transparency information.
hwbToColor(h, w, b, t)
Converts a set of HWB channel values and transparency information to a "color" value.
getXYZ(r, g, b, t)
(Overload 1 of 2) Converts a set of sRGB channels to a set of XYZ values with specified transparency information.
getXYZ(source)
(Overload 2 of 2) Retrieves XYZ channel values and transparency information from a "color" value.
xyzToRGB(x, y, z, t)
Converts a set of XYZ channel values to a set of sRGB values with specified transparency information
xyzToColor(x, y, z, t)
Converts a set of XYZ channel values and transparency information to a "color" value.
getXYY(r, g, b, t)
(Overload 1 of 2) Converts a set of sRGB channels to a set of xyY values with specified transparency information.
getXYY(source)
(Overload 2 of 2) Retrieves xyY channel values and transparency information from a "color" value.
xyyToRGB(xc, yc, y, t)
Converts a set of xyY channel values to a set of sRGB values with specified transparency information.
xyyToColor(xc, yc, y, t)
Converts a set of xyY channel values and transparency information to a "color" value.
getLAB(r, g, b, t)
(Overload 1 of 2) Converts a set of sRGB channels to a set of CIELAB values with specified transparency information.
getLAB(source)
(Overload 2 of 2) Retrieves CIELAB channel values and transparency information from a "color" value.
labToRGB(l, a, b, t)
Converts a set of CIELAB channel values to a set of sRGB values with specified transparency information.
labToColor(l, a, b, t)
Converts a set of CIELAB channel values and transparency information to a "color" value.
getOKLAB(r, g, b, t)
(Overload 1 of 2) Converts a set of sRGB channels to a set of Oklab values with specified transparency information.
getOKLAB(source)
(Overload 2 of 2) Retrieves Oklab channel values and transparency information from a "color" value.
oklabToRGB(l, a, b, t)
Converts a set of Oklab channel values to a set of sRGB values with specified transparency information.
oklabToColor(l, a, b, t)
Converts a set of Oklab channel values and transparency information to a "color" value.
getLCH(r, g, b, t)
(Overload 1 of 2) Converts a set of sRGB channels to a set of CIELCh values with specified transparency information.
getLCH(source)
(Overload 2 of 2) Retrieves CIELCh channel values and transparency information from a "color" value.
lchToRGB(l, c, h, t)
Converts a set of CIELCh channel values to a set of sRGB values with specified transparency information.
lchToColor(l, c, h, t)
Converts a set of CIELCh channel values and transparency information to a "color" value.
getOKLCH(r, g, b, t)
(Overload 1 of 2) Converts a set of sRGB channels to a set of Oklch values with specified transparency information.
getOKLCH(source)
(Overload 2 of 2) Retrieves Oklch channel values and transparency information from a "color" value.
oklchToRGB(l, c, h, t)
Converts a set of Oklch channel values to a set of sRGB values with specified transparency information.
oklchToColor(l, c, h, t)
Converts a set of Oklch channel values and transparency information to a "color" value.
contrastRatio(value1, value2)
Calculates the contrast ratio between two colors values based on the formula from version 2 of the Web Content Accessibility Guidelines (WCAG).
isLightTheme(source)
Detects whether a background color represents a light theme or dark theme, based on the amount of contrast between the color and the white and black points.
grayscale(source)
Calculates the grayscale version of a color with the same relative luminance (i.e., brightness).
negative(source, colorSpace)
Calculates the negative (i.e., inverted) form of a specified color.
complement(source, colorSpace)
Calculates the complementary color for a `source` color using a cylindrical color space.
analogousColors(source, colorSpace)
Calculates the analogous colors for a `source` color using a cylindrical color space.
splitComplements(source, colorSpace)
Calculates the split-complementary colors for a `source` color using a cylindrical color space.
triadicColors(source, colorSpace)
Calculates the two triadic colors for a `source` color using a cylindrical color space.
tetradicColors(source, colorSpace, square)
Calculates the three square or rectangular tetradic colors for a `source` color using a cylindrical color space.
pentadicColors(source, colorSpace)
Calculates the four pentadic colors for a `source` color using a cylindrical color space.
hexadicColors(source, colorSpace)
Calculates the five hexadic colors for a `source` color using a cylindrical color space.
add(value1, value2, transpWeight)
Additively mixes two "color" values, with optional transparency weighting.
overlay(fg, bg)
Estimates the resulting color that appears on the chart when placing one color over another.
fromGradient(value, bottomValue, topValue, bottomColor, topColor, colorSpace)
Calculates the gradient color that corresponds to a specific value based on a defined value range and color space.
fromMultiStepGradient(value, steps, colors, colorSpace)
Calculates a multi-step gradient color that corresponds to a specific value based on an array of step points, an array of corresponding colors, and a color space.
gradientPalette(baseColor, stopColor, steps, strength, model)
Generates a palette from a gradient between two base colors.
monoPalette(baseColor, grayLuminance, variations, strength, colorSpace)
Generates a monochromatic palette from a specified base color.
harmonyPalette(baseColor, harmonyType, grayLuminance, variations, strength, colorSpace)
Generates a palette consisting of harmonious base colors and their monochromatic variants.
Color

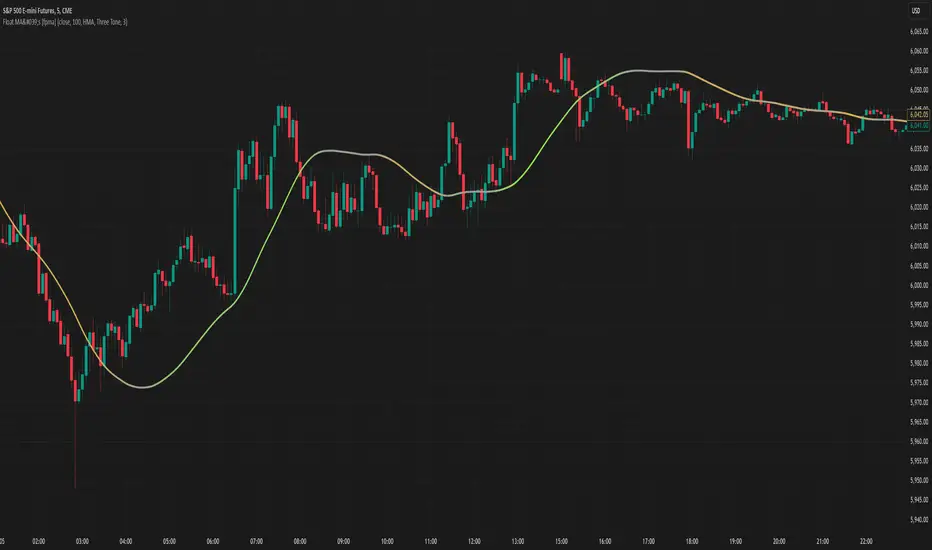
Moving Averages With Continuous Periods [macp]This script reimagines traditional moving averages by introducing floating-point period calculations, allowing for fractional lengths rather than being constrained to whole numbers. At its core, it provides SMA, WMA, and HMA variants that can work with any decimal length, which proves especially valuable when creating dynamic indicators or fine-tuning existing strategies.
The most significant improvement lies in the Hull Moving Average implementation. By properly handling floating-point mathematics throughout the calculation chain, this version reduces the overshoot tendencies that often plague integer-based HMAs. The result is a more responsive yet controlled indicator that better captures price action without excessive whipsaw.
The visual aspect incorporates a trend gradient system that can adapt to different trading styles. Rather than using fixed coloring, it offers several modes ranging from simple solid colors to more nuanced three-tone gradients that help identify trend transitions. These gradients are normalized against ATR to provide context-aware visual feedback about trend strength.
From a practical standpoint, the floating-point approach eliminates the subtle discontinuities that occur when integer-based moving averages switch periods. This makes the indicator particularly useful in systems where the MA period itself is calculated from market conditions, as it can smoothly transition between different lengths without artificial jumps.
At the heart of this implementation lies the concept of continuous weights rather than discrete summation. Traditional moving averages treat each period as a distinct unit with integer indexing. However, when we move to floating-point periods, we need to consider how fractional periods should behave. This leads us to some interesting mathematical considerations.
Consider the Weighted Moving Average kernel. The weight function is fundamentally a slope: -x + length where x represents the position in the averaging window. The normalization constant is calculated by integrating (in our discrete case, summing) this slope across the window. What makes this implementation special is how it handles the fractional component - when the length isn't a whole number, the final period gets weighted proportionally to its fractional part.
For the Hull Moving Average, the mathematics become particularly intriguing. The standard HMA formula HMA = WMA(2*WMA(price, n/2) - WMA(price, n), sqrt(n)) is preserved, but now each WMA calculation operates in continuous space. This creates a smoother cascade of weights that better preserves the original intent of the Hull design - to reduce lag while maintaining smoothness.
The Simple Moving Average's treatment of fractional periods is perhaps the most elegant. For a length like 9.7, it weights the first 9 periods fully and the 10th period at 0.7 of its value. This creates a natural transition between integer periods that traditional implementations miss entirely.
The Gradient Mathematics
The trend gradient system employs normalized angular calculations to determine color transitions. By taking the arctangent of price changes normalized by ATR, we create a bounded space between 0 and 1 that represents trend intensity. The formula (arctan(Δprice/ATR) + 90°)/180° maps trend angles to this normalized space, allowing for smooth color transitions that respect market volatility context.
This mathematical framework creates a more theoretically sound foundation for moving averages, one that better reflects the continuous nature of price movement in financial markets. The implementation recognizes that time in markets isn't truly discrete - our sampling might be, but the underlying process we're trying to measure is continuous. By allowing for fractional periods, we're creating a better approximation of this continuous reality.
This floating-point moving average implementation offers tangible benefits for traders and analysts who need precise control over their indicators. The ability to fine-tune periods and create smooth transitions makes it particularly valuable for automated systems where moving average lengths are dynamically calculated from market conditions. The Hull Moving Average calculation now accurately reflects its mathematical formula while maintaining responsiveness, making it a practical choice for both systematic and discretionary trading approaches. Whether you're building dynamic indicators, optimizing existing strategies, or simply want more precise control over your moving averages, this implementation provides the mathematical foundation to do so effectively.
ToClrToStrContains functions for conversion of color to string and vice versa:
method toClr( string this ) - converts string reperesentation of color (in hex format) to color
method toHex( color this ) - converts color to string (hex form)
method toRgb( color this ) - converts color to string ("rgb(11,11,11,0)" form)
Thanks to @ImmortalFreedom for his `color_tostring()` function from "RGB Color Fiddler"

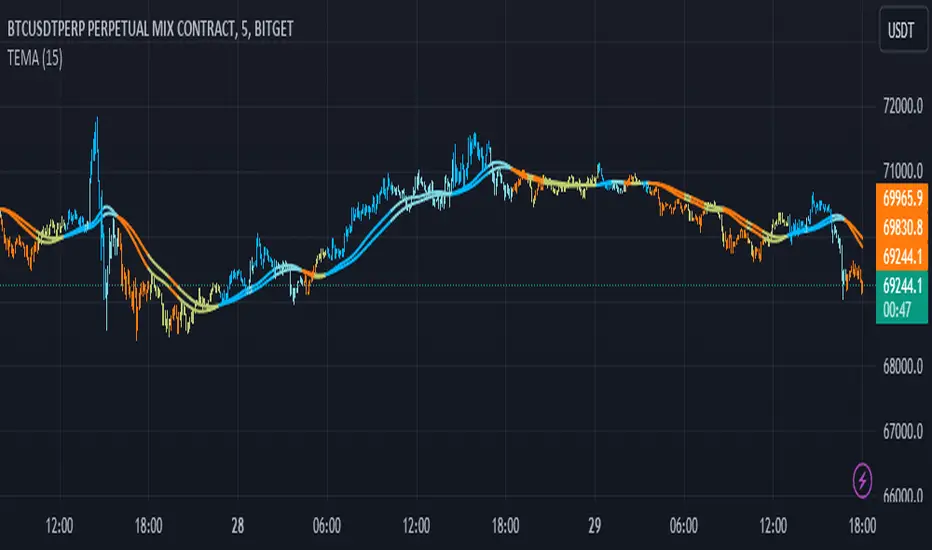
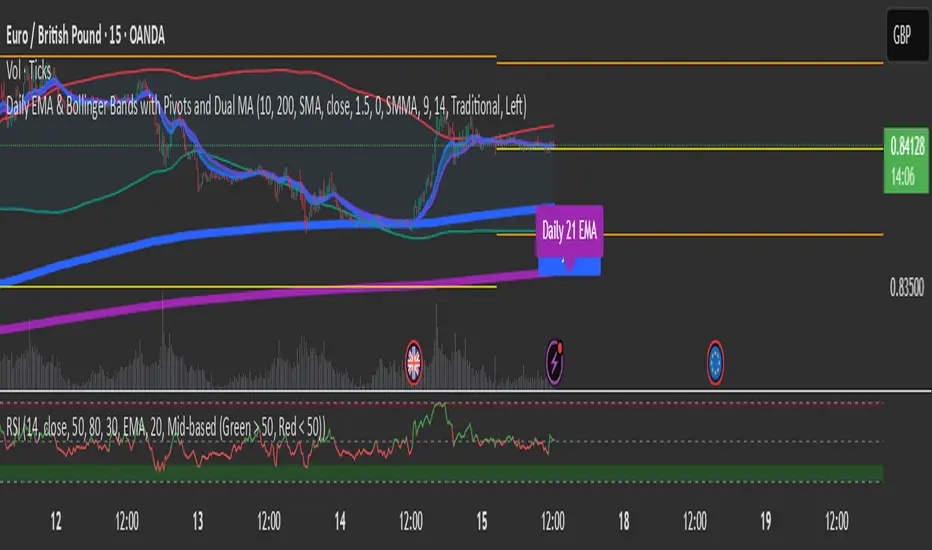
Triple EMA Distance IndicatorTriple EMA Distance Indicator
The Triple EMA Distance indicator comprises two sets of triple exponential moving averages (EMAs). One set uses the same smoothing length for all EMAs, while the other set doubles the length for the last EMA. This indicator provides visual cues based on the relationship between these EMAs and candlestick patterns.
Blue Condition:
Indicates when the fast EMA is above the slow EMA.
The distance between the two EMAs is increasing.
Candlesticks and EMAs are colored light blue.
Orange Condition:
Activates when the fast EMA is below the slow EMA.
The distance between the two EMAs is increasing.
Candlesticks and EMAs are colored orange.
Beige Condition:
Occurs when the fast EMA is below the slow EMA.
The distance between the two EMAs is decreasing.
Candlesticks and EMAs are colored beige.
Light Blue Condition:
Represents when the fast EMA is above the slow EMA.
The distance between the two EMAs is decreasing.
Candlesticks and EMAs are colored light blue.
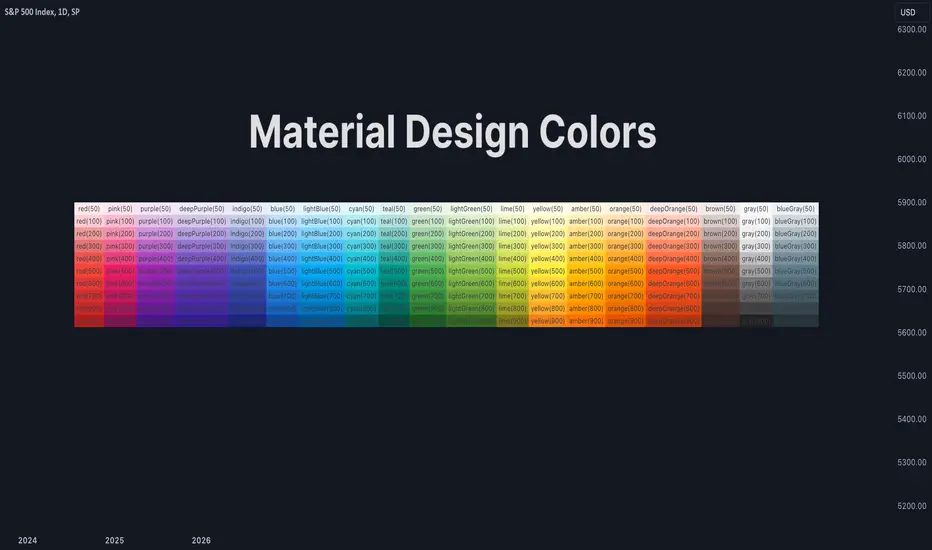
Material Design ColorsThis library provides a standard set of colors defined in Material Design 2.0.
🔵 API
Step 1: Import this library.
import algotraderdev/material/1
// remember to check the latest version of this library and replace the 1 above.
Step 2: Get the color you like. Check the source code or the screenshot above to see all the supported colors.
material.red()
Each color function (except for `black()` and `white()`) accepts an optional `variant` parameter. You can choose any of 50, 100, 200, 300, 400, 500, 600, 700, 800, and 900. By default, 500 is chosen if this parameter is not provided.
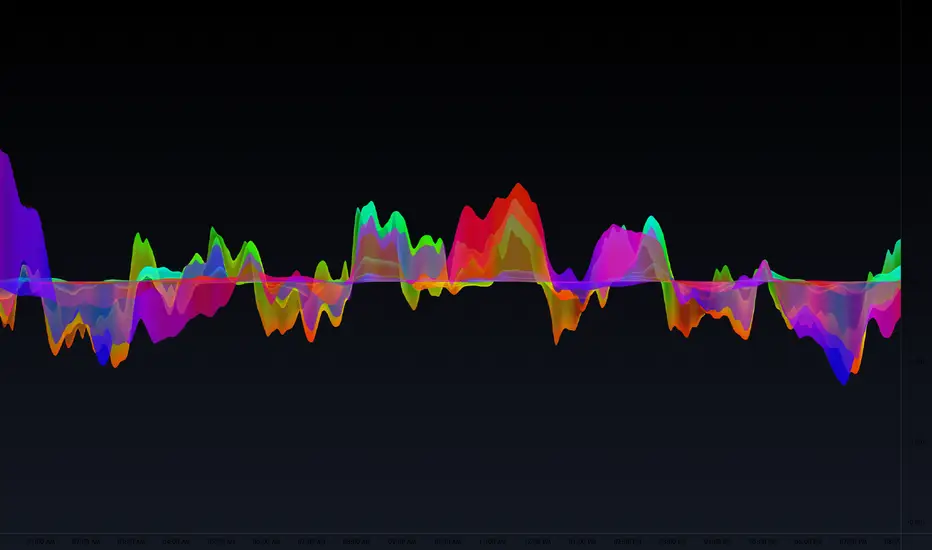
Gradient Value Overlay
This script helps with identifying certain conditions without cluttering too much of the candles.
Some use cases:
It helps identify rsi low and high values.
Directional price movement becoming difficult.
low and high volume.
it uses a percent rank to distinguish low and high values.
It then uses a gradient to match the percentile rank to heatmap type colors.
i.e. dark blue for lowest volume, white for highest volume.
Current options are:
max bars to use.
approximate color - This value will attempt to give an approximation of what the color might be for the candle close.
e.g. If you're on the 1-hour chart, and only 30 minutes have past, it will multiple the current volume by 1.5. As time passes, if no volume comes in eventually, it will multiply current volume by 1.
This approximate value is only set to work with volume-based options.
option - select the type of value you'd like to see the gradient for.
timeframe - get values from a different chart timeframe.
on/off - turns the gradient on or off.
Gradient type - color wheel or heatmap. Currently these are the only two gardient options.
color wheel's colors for low to high values:
color wheel's current colors:
dark blue
purple
pink
red
orange
yellow
green
teal
white
heatmap's current colors from low values to high values:
dark blue
purple
pink
red
orange
yellow
white
reverse gradient - will reverse the colors so dark blue will be the high value and white will be the low value. Some charts based on previous data; you might need to switch the gradient colors.
moving average length while inside timeframe - an exponential moving average is applied to the values. At 1, there is no moving average applied.
Use case for this is to smooth out the gradient.
An example use case - if your currently on the 1-hour chart, you can set the timeframe to 1 minute and then the moving average length inside timeframe to 60. You will then be seeing the color sixty 1-minute bars.
current timeframe moving average length - an exponential moving average applied to current gradient (helps with smoothing gradient).
Smooth, further smooths values.
There is no set rule for what moving average lengths to use. Adjust timeframe, and moving average lengths to get an insight.
Contrast Color LibraryThis lightweight library provides a utility method that analyzes any provided background color and automatically chooses the optimal black or white foreground color to ensure maximum visual contrast and readability.
🟠 Algorithm
The library utilizes the HSP Color Model to calculate the brightness of the background color. The formula for this calculation is as follows:
brightness = sqrt(0.299 * R^2 + 0.587 * G^2 + 0.114 * B^2 )
The library chooses black as the foreground color if the brightness exceeds the threshold (default 0.5), and white otherwise.

TICK Strength Background ShadeThis indicator shades the background of each candle based on the strength off the current TICK.US chart. User can define the strength levels, which are by default set to 1-299 (lightest), 300-599, and 600+ (darkest). Best used on lower timeframe charts to help identify whether or not to remain in a trend, or if a trend is possibly reversing when you start to see the opposite color begin to appear following a trend.

Plot background depending on Index EMA 10 and EMA 20This indicator gives the user an easy way to check the conditions of the market.
Up market should be good for breakout traders.
Down market should be good for breakdown shortsellers
The others should be good for pullback buyers.
This script automaticlly check which index should be used for the depending on which ticker is view. If no match is found indicator will use IXIC as reference.
The script works for Nordic and US stocks.
"OMXSPI"
"OBX"
"OMXSPI"
"OMXHPI"
"OMXCPI"
"IXIC"
It then alculated the EMA10 and EMA20 for the index and plots the background depending on 6 differnet conditions.
EMA10 below EMA20 and EMA10 and EMA20 is sloping down. //Down market
EMA10 above EMA20 and EMA10 and EMA20 is sloping up. //Up market
EMA10 below EMA20 and EMA10 sloping up and EMA20 is sloping down. //First indication by market to move up
EMA10 above EMA20 and EMA10 sloping down and EMA20 is sloping up. //First indication by market to move down
EMA10 below EMA20 and EMA10 sloping up and EMA20 is sloping up. //Possible MA cross over
EMA10 below EMA20 and EMA10 sloping down and EMA20 is sloping down. //Possible MA cross over

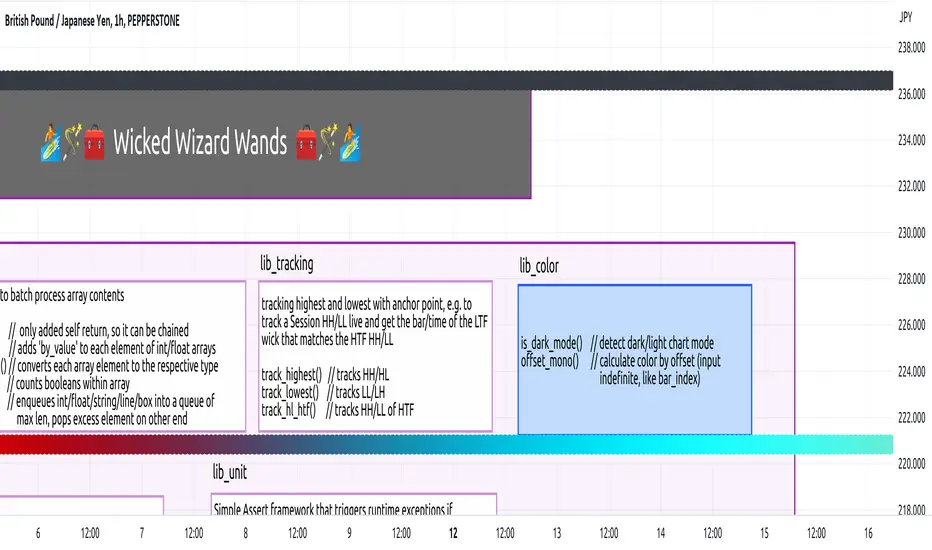
lib_colorLibrary "lib_color"
offset_mono(original, offset, transparency)
get offset color
Parameters:
original (simple color) : original color
offset (float) : offset for new color
transparency (float) : transparency for new color
Returns: offset color

lib_colorsLibrary "lib_colors"
offset_mono(original, offset, transparency)
get offset color
Parameters:
original (simple color) : original color
offset (float) : offset for new color
transparency (float) : transparency for new color
Returns: offset color
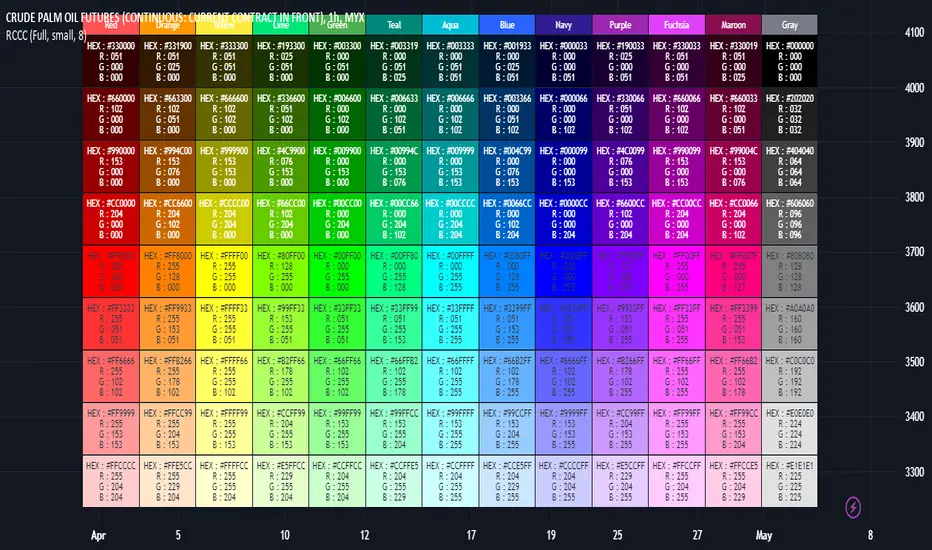
RGB Color Codes Chart█ OVERVIEW
This indicator is an educational indicator to make pine coders easier to input color code.
Color code displayed either in hex or rgb code or both.
█ INSPIRATIONS
RGB Color Codes Chart
Table Color For Pairing Black And White
█ FEATURES
Hover table cell to see all properties of color such as Hex code and RGB code via tooltip.
Cell can be show either Full, HEX, RGB, R, G, B or na.
█ LIMITATION
This code does not consider usage of color.new()
█ CONSIDERATION
Code consideration to be used such as color.r(), color.g(), color.b() and color.rgb()
█ EXAMPLE OF USAGE / EXPLAINATION
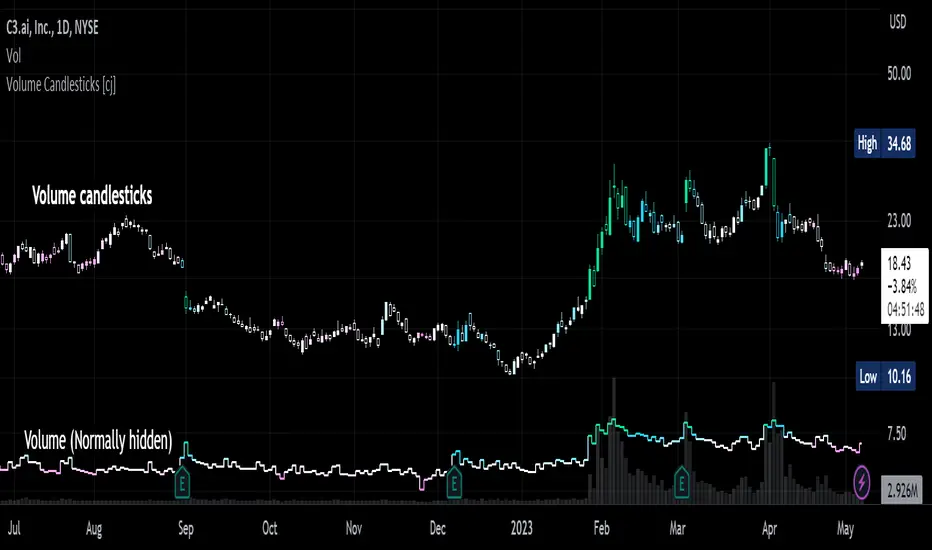
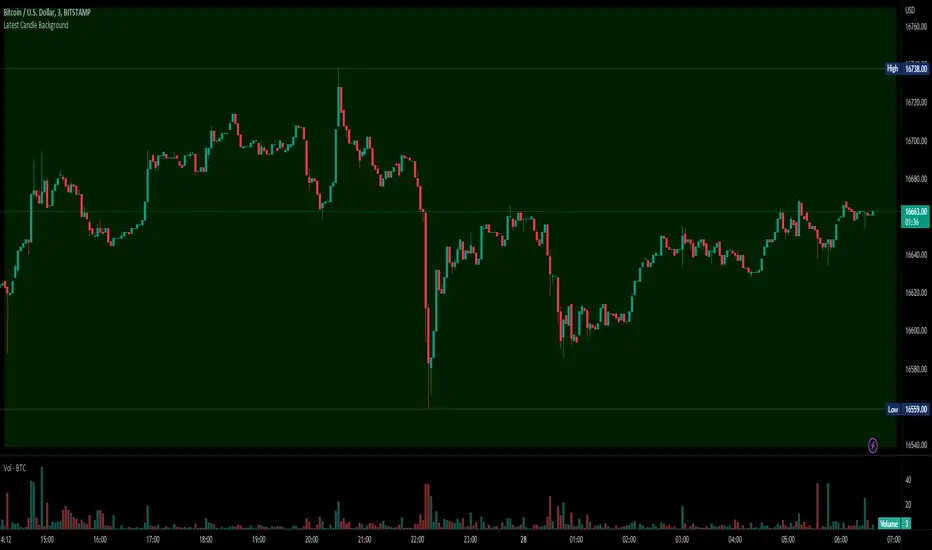
Volume Candlesticks [cajole]
This script lets you create the equivalent of "volume candlesticks" in TradingView.
"Volume candlesticks" normally vary their width according to the bar's volume. This script varies COLOUR instead of WIDTH.
Bar charts are also supported.
Candles/Bars are coloured by their distance from the average volume. You can also add a "huge volume" colour to further highlight the most extremely-high volume bars.
Note that volume is extrapolated for incomplete bars by default. So, if the average volume of the past 10 days is 5M shares, and 5M shares trade in the first 10% of today's session, that bar will be coloured as though 50M shares have traded. Set the "Extrapolate" option to 1.0 to disable this.
For this script to work properly, you should set TradingView's default candle/bar colours to be at least 20% transparent. By default, TradingView tends to overlay its own bars on top of indicators.
Nerdy details:
The script works best on a dark background, because it is easier to change the hue of white bars than of black bars. If you find a set of colours that work for white backgrounds, please comment with them!
The geometric mean is used instead of the arithmetic mean, to keep the 'average' from being strongly influenced by spikes. Bars are
then coloured by assuming a normal probability distribution and highlighting outliers. (This means that the first high-volume bars are coloured differently to later ones.)
toolsLibrary "tools"
A library of many helper methods, plus a comprehensive print method and a printer object.
This is a newer version of the helpers library. This script uses pinescripts v5 latest objects and methods.

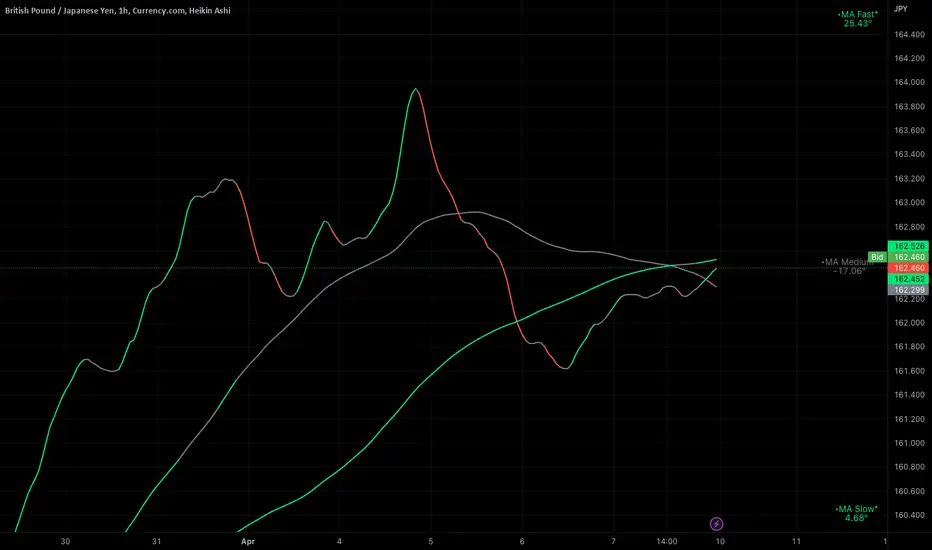
Ignition Cha Cha ChaIgnition Cha Cha Cha (ICCC) is a 3 color coded moving average indicator which numerically quantify the angle of their trends. I have labeled them as fast, medium and slow. The trend colors are Green for bullish, Red for bearish and Grey for sideways. The sideways movement can be user defined for all 3 in the settings under Threshold. If you regard for example anything under 10º as sideways then place 10 in the corresponding threshold and any angle under 10º will give a grey moving average and a grey labeled text. I use this chart in several ways. If you don't want moving averages all over your Chartistic Masterpiece you can turn off the plots and leave the numeric angles which will give you an overview of the trend. Conversely if you want to make the ultimate trend chart you can setup a 4 chart layout, Weekly, Daily, 12 hour and 4 hour and add the indicator with 200/50/25 moving averages and look for confluence. I find the best way for this is turn off the candles and use the moving averages with the numeric labels. You also have the ability to turn off and on different aspects of the indicator so that there is good control over its look. Also I have given the indicator lots of Alert presets for all 3 of the moving averages so you can avoid demented screen-stairing. Please forgive the name, my mother made me do Ballroom dancing lessons as a kid.
Colorize Large Candles// I have written a Pine Script to re-paint large candles in a different Color.
// You can set the value that you want to use to define what is 'Large', and the script will re-paint any candle whose size is equal to or greater than your value.
// The number can be an integer (8) or a decimal (7.5).
// You can enable the size measurement to be done in one of two ways: 1) either on the Body (Open-to-Close); 2) or on the Wicks (High-to-Low) of the candle.
// The color of the re-painted candle can be set independently for Up and for Down candles. You can also set any Opacity that you want for these candles.
// I usually set the limit for the Visibility to the Second- and Minute-timeframes, as the Script produces too many Colorized Bars when using the Hour- or Day- timeframes.

ColorUtility for working with colors.
Get the luminosity of a color and determine the optimal (black or white) foreground color.

HSV and HSL gradient Tools ( Built-in Drop-in replacement )Library "hsvColor"
HSV and HSL Gradient Tool Alternatives and helpers. Demo'd is built-in in the middle with HSL/HSV gradients on top/bottom
TODO: Solve for #000000 issue
rgbhsv(_col)
RGB Color to HSV Values
Parameters:
_col : Color input (#abc012 or color.name or color.rgb(0,0,0,0))
Returns: values
rgbhsv(_r, _g, _b, _t)
RGB Color to HSV Values
Parameters:
_r : Red 0 - 255
_g : Green 0 - 255
_b : Blue 0 - 255
_t : Transp 0 - 100
Returns: values
hsv(_h, _s, _v, _a)
HSV colors, Auto fix if past boundaries
Parameters:
_h : Hue Input (-360 - 360) or further
_s : Saturation 0.- 1.
_v : Value 0.- 1.
_a : Alpha 0.- 1.
Returns: Color output
hue(_col)
returns 0-359 hue on color wheel
Parameters:
_col :
Returns: 360 degree hue value
hsv_gradient(signal, _startVal, _endVal, _startCol, _endCol)
Color Gradient Replacement Function for HSV calculated Gradents
Parameters:
signal : Control signal
_startVal : start color limit
_endVal : end color limit
_startCol : start color
_endCol : end color
Returns: HSV calculated gradient
hsl_gradient(signal, _startVal, _endVal, _startCol, _endCol)
Color Gradient Replacement Function for HSV calculated Gradents
Parameters:
signal : Control signal
_startVal : start color limit
_endVal : end color limit
_startCol : start color
_endCol : end color
Returns: HSV calculated gradient
Consolidation Breakout [Indian Market Timing]OK let's get started ,
A Day Trading (Intraday) Consolidation Breakout Indication Strategy that explains time condition for Indian Markets .
The commission is also included in the strategy .
The basic idea is ,
1) Price crosses above upper band , indicated by a color change (green) is the Long condition .
2) Price crosses below lower band , indicated by a color change (red) is the Short condition .
3) ATR is used for trailing after entry
// ═══════════════════════════════//
// ————————> TIME CONDITION <————————— //
// ═══════════════════════════════//
The Indian Markets open at 9:15am and closes at 3:30pm.
The time_condition specifies the time at which Entries should happen .
"Close All" function closes all the trades at 2:57pm.
All open trades get closed at 2:57pm , because some brokers dont allow you to place fresh intraday orders after 3pm.
NSE:NIFTY1!
// ═══════════════════════════════════════════════ //
// ————————> BACKTEST RESULTS ( 114 CLOSED TRADES )<————————— //
// ═══════════════════════════════════════════════ //
LENGTH , MULT (factor) and ATR can be changed for better backtest results.
The strategy applied to NIFTY (3 min Time-Frame and contract size 5) gives us 60% profitability , as shown below
It was tested for a period a 8 months with a Profit Factor of 2.2 , avg Trade of 6000Rs profit and Sharpe Ratio : 0.67
The graph has a Linear Curve with consistent profits.
NSE:NIFTY1!
Save it favorites.
Apply it to your charts Now !!
Thank me later ;)

RSI mid partition color changeWhen RSI is above 50 our default bias is on buy side and when below 50 our bias is on sell side.
Therefore created 2 zones for easy identification.
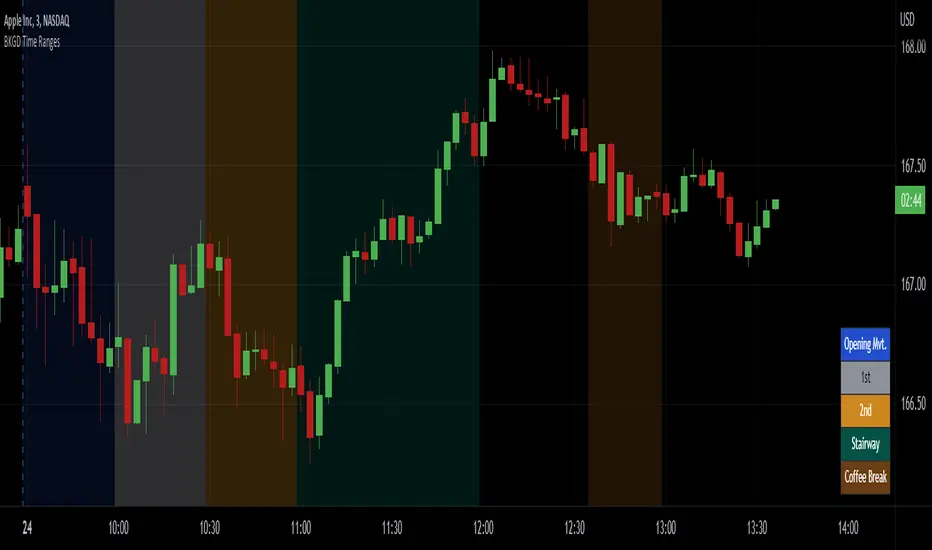
Intraday Background Time RangesThis simple script was written for studying recurring intraday behaviours of financial instruments. With it, you can highlight up to 13 customizable time ranges on your chart, filling the corresponding background space with colors you prefer. You can then write a note for each range and it will be shown in the optional related table.
The experience shows that every financial instrument has its own personality. With this in mind, the script can be useful to study intraday charts with the purpose of discovering recurring behaviours of specific instruments over a certain time range and under specific circumstances (normal days, earnings days, days with catalysts, etc.) This can help the trader to deeply understand the instrument personality, and therefore also to decide whether to enter or exit the market if its behaviour meets or not his expectations.
Please note that this script only works on minute/hourly charts.
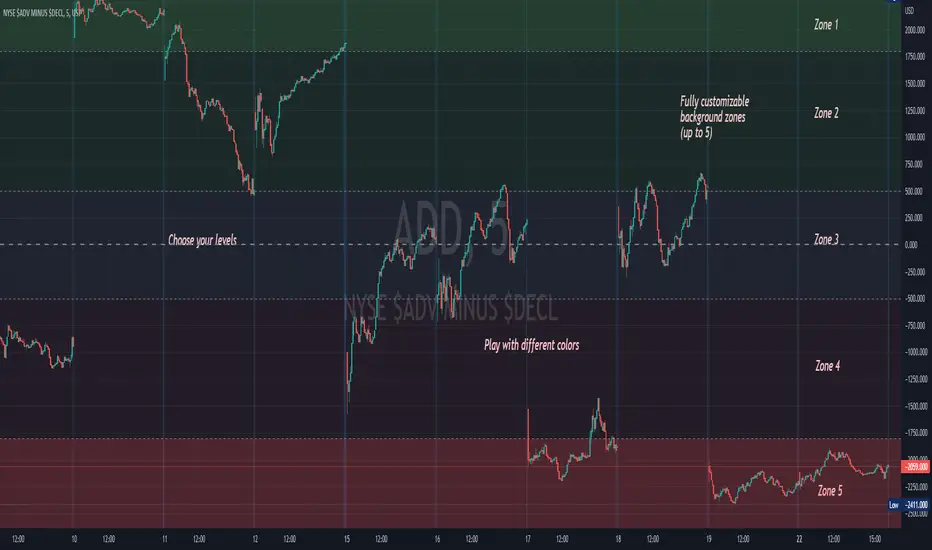
Background ZonesThis script provides up to 5 zones to apply background colors. This is especially useful for applying to indices such as USI:TICK , USI:ADD , and USI:VOLD , where certain levels provides significant meaning to market sentiment and directions. This script will give you the visual cue to help with your trading.
All levels and colors are fully customizable.
Enjoy~!!
Example: