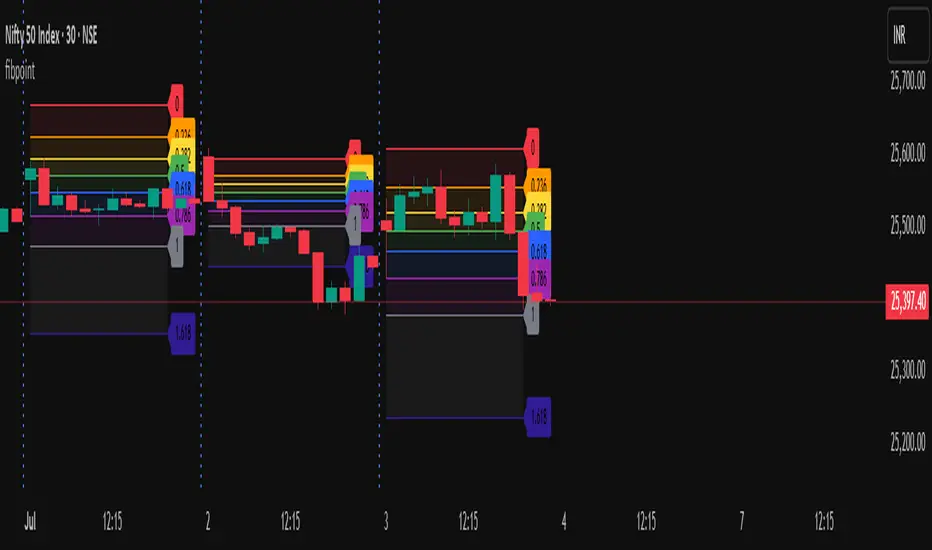
fibpointLibrary "fibpoint"
A library for generating Fibonacci retracement levels on a chart, including customizable lines, labels, and filled areas between levels. It provides functionality to plot Fibonacci levels based on given price points and bar indices, with options for custom levels and colors.
getFib(startPoint, endPoint, startIdx, endIdx, fibLevels, fibColors, tsp)
Calculates Fibonacci retracement levels between two price points and draws corresponding lines and labels on the chart.
Parameters:
startPoint (float) : The starting price point for the Fibonacci retracement.
endPoint (float) : The ending price point for the Fibonacci retracement.
startIdx (int) : The bar index where the Fibonacci retracement starts.
endIdx (int) : The bar index where the Fibonacci retracement ends.
fibLevels (array) : An optional array of custom Fibonacci levels (default is ).
fibColors (array) : An optional array of colors for each Fibonacci level (default is a predefined color array).
tsp (int) : The transparency level for the fill between Fibonacci levels (default is 90).
Returns: A tuple containing an array of fibItem objects (each with a line and label) and an array of linefill objects for the filled areas between levels.
fibItem
A custom type representing a Fibonacci level with its associated line and label.
Fields:
line (series line) : The line object drawn for the Fibonacci level.
label (series label) : The label object displaying the Fibonacci level value.
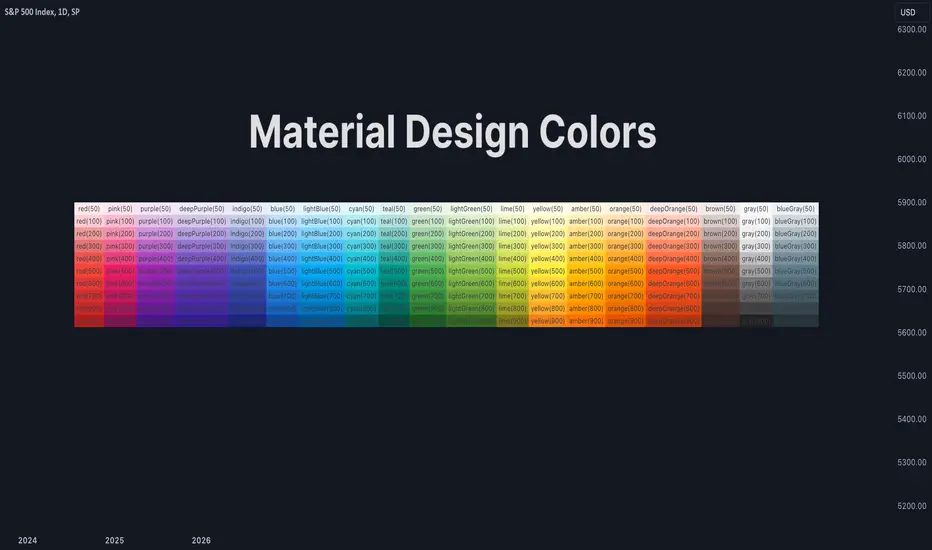
Colors
Color█ OVERVIEW
This library is a Pine Script® programming tool for advanced color processing. It provides a comprehensive set of functions for specifying and analyzing colors in various color spaces, mixing and manipulating colors, calculating custom gradients and schemes, detecting contrast, and converting colors to or from hexadecimal strings.
█ CONCEPTS
Color
Color refers to how we interpret light of different wavelengths in the visible spectrum . The colors we see from an object represent the light wavelengths that it reflects, emits, or transmits toward our eyes. Some colors, such as blue and red, correspond directly to parts of the spectrum. Others, such as magenta, arise from a combination of wavelengths to which our minds assign a single color.
The human interpretation of color lends itself to many uses in our world. In the context of financial data analysis, the effective use of color helps transform raw data into insights that users can understand at a glance. For example, colors can categorize series, signal market conditions and sessions, and emphasize patterns or relationships in data.
Color models and spaces
A color model is a general mathematical framework that describes colors using sets of numbers. A color space is an implementation of a specific color model that defines an exact range (gamut) of reproducible colors based on a set of primary colors , a reference white point , and sometimes additional parameters such as viewing conditions.
There are numerous different color spaces — each describing the characteristics of color in unique ways. Different spaces carry different advantages, depending on the application. Below, we provide a brief overview of the concepts underlying the color spaces supported by this library.
RGB
RGB is one of the most well-known color models. It represents color as an additive mixture of three primary colors — red, green, and blue lights — with various intensities. Each cone cell in the human eye responds more strongly to one of the three primaries, and the average person interprets the combination of these lights as a distinct color (e.g., pure red + pure green = yellow).
The sRGB color space is the most common RGB implementation. Developed by HP and Microsoft in the 1990s, sRGB provided a standardized baseline for representing color across CRT monitors of the era, which produced brightness levels that did not increase linearly with the input signal. To match displays and optimize brightness encoding for human sensitivity, sRGB applied a nonlinear transformation to linear RGB signals, often referred to as gamma correction . The result produced more visually pleasing outputs while maintaining a simple encoding. As such, sRGB quickly became a standard for digital color representation across devices and the web. To this day, it remains the default color space for most web-based content.
TradingView charts and Pine Script `color.*` built-ins process color data in sRGB. The red, green, and blue channels range from 0 to 255, where 0 represents no intensity, and 255 represents maximum intensity. Each combination of red, green, and blue values represents a distinct color, resulting in a total of 16,777,216 displayable colors.
CIE XYZ and xyY
The XYZ color space, developed by the International Commission on Illumination (CIE) in 1931, aims to describe all color sensations that a typical human can perceive. It is a cornerstone of color science, forming the basis for many color spaces used today. XYZ, and the derived xyY space, provide a universal representation of color that is not tethered to a particular display. Many widely used color spaces, including sRGB, are defined relative to XYZ or derived from it.
The CIE built the color space based on a series of experiments in which people matched colors they perceived from mixtures of lights. From these experiments, the CIE developed color-matching functions to calculate three components — X, Y, and Z — which together aim to describe a standard observer's response to visible light. X represents a weighted response to light across the color spectrum, with the highest contribution from long wavelengths (e.g., red). Y represents a weighted response to medium wavelengths (e.g., green), and it corresponds to a color's relative luminance (i.e., brightness). Z represents a weighted response to short wavelengths (e.g., blue).
From the XYZ space, the CIE developed the xyY chromaticity space, which separates a color's chromaticity (hue and colorfulness) from luminance. The CIE used this space to define the CIE 1931 chromaticity diagram , which represents the full range of visible colors at a given luminance. In color science and lighting design, xyY is a common means for specifying colors and visualizing the supported ranges of other color spaces.
CIELAB and Oklab
The CIELAB (L*a*b*) color space, derived from XYZ by the CIE in 1976, expresses colors based on opponent process theory. The L* component represents perceived lightness, and the a* and b* components represent the balance between opposing unique colors. The a* value specifies the balance between green and red , and the b* value specifies the balance between blue and yellow .
The primary intention of CIELAB was to provide a perceptually uniform color space, where fixed-size steps through the space correspond to uniform perceived changes in color. Although relatively uniform, the color space has been found to exhibit some non-uniformities, particularly in the blue part of the color spectrum. Regardless, modern applications often use CIELAB to estimate perceived color differences and calculate smooth color gradients.
In 2020, a new LAB-oriented color space, Oklab , was introduced by Björn Ottosson as an attempt to rectify the non-uniformities of other perceptual color spaces. Similar to CIELAB, the L value in Oklab represents perceived lightness, and the a and b values represent the balance between opposing unique colors. Oklab has gained widespread adoption as a perceptual space for color processing, with support in the latest CSS Color specifications and many software applications.
Cylindrical models
A cylindrical-coordinate model transforms an underlying color model, such as RGB or LAB, into an alternative expression of color information that is often more intuitive for the average person to use and understand.
Instead of a mixture of primary colors or opponent pairs, these models represent color as a hue angle on a color wheel , with additional parameters that describe other qualities such as lightness and colorfulness (a general term for concepts like chroma and saturation). In cylindrical-coordinate spaces, users can select a color and modify its lightness or other qualities without altering the hue.
The three most common RGB-based models are HSL (Hue, Saturation, Lightness), HSV (Hue, Saturation, Value), and HWB (Hue, Whiteness, Blackness). All three define hue angles in the same way, but they define colorfulness and lightness differently. Although they are not perceptually uniform, HSL and HSV are commonplace in color pickers and gradients.
For CIELAB and Oklab, the cylindrical-coordinate versions are CIELCh and Oklch , which express color in terms of perceived lightness, chroma, and hue. They offer perceptually uniform alternatives to RGB-based models. These spaces create unique color wheels, and they have more strict definitions of lightness and colorfulness. Oklch is particularly well-suited for generating smooth, perceptual color gradients.
Alpha and transparency
Many color encoding schemes include an alpha channel, representing opacity . Alpha does not help define a color in a color space; it determines how a color interacts with other colors in the display. Opaque colors appear with full intensity on the screen, whereas translucent (semi-opaque) colors blend into the background. Colors with zero opacity are invisible.
In Pine Script, there are two ways to specify a color's alpha:
• Using the `transp` parameter of the built-in `color.*()` functions. The specified value represents transparency (the opposite of opacity), which the functions translate into an alpha value.
• Using eight-digit hexadecimal color codes. The last two digits in the code represent alpha directly.
A process called alpha compositing simulates translucent colors in a display. It creates a single displayed color by mixing the RGB channels of two colors (foreground and background) based on alpha values, giving the illusion of a semi-opaque color placed over another color. For example, a red color with 80% transparency on a black background produces a dark shade of red.
Hexadecimal color codes
A hexadecimal color code (hex code) is a compact representation of an RGB color. It encodes a color's red, green, and blue values into a sequence of hexadecimal ( base-16 ) digits. The digits are numerals ranging from `0` to `9` or letters from `a` (for 10) to `f` (for 15). Each set of two digits represents an RGB channel ranging from `00` (for 0) to `ff` (for 255).
Pine scripts can natively define colors using hex codes in the format `#rrggbbaa`. The first set of two digits represents red, the second represents green, and the third represents blue. The fourth set represents alpha . If unspecified, the value is `ff` (fully opaque). For example, `#ff8b00` and `#ff8b00ff` represent an opaque orange color. The code `#ff8b0033` represents the same color with 80% transparency.
Gradients
A color gradient maps colors to numbers over a given range. Most color gradients represent a continuous path in a specific color space, where each number corresponds to a mix between a starting color and a stopping color. In Pine, coders often use gradients to visualize value intensities in plots and heatmaps, or to add visual depth to fills.
The behavior of a color gradient depends on the mixing method and the chosen color space. Gradients in sRGB usually mix along a straight line between the red, green, and blue coordinates of two colors. In cylindrical spaces such as HSL, a gradient often rotates the hue angle through the color wheel, resulting in more pronounced color transitions.
Color schemes
A color scheme refers to a set of colors for use in aesthetic or functional design. A color scheme usually consists of just a few distinct colors. However, depending on the purpose, a scheme can include many colors.
A user might choose palettes for a color scheme arbitrarily, or generate them algorithmically. There are many techniques for calculating color schemes. A few simple, practical methods are:
• Sampling a set of distinct colors from a color gradient.
• Generating monochromatic variants of a color (i.e., tints, tones, or shades with matching hues).
• Computing color harmonies — such as complements, analogous colors, triads, and tetrads — from a base color.
This library includes functions for all three of these techniques. See below for details.
█ CALCULATIONS AND USE
Hex string conversion
The `getHexString()` function returns a string containing the eight-digit hexadecimal code corresponding to a "color" value or set of sRGB and transparency values. For example, `getHexString(255, 0, 0)` returns the string `"#ff0000ff"`, and `getHexString(color.new(color.red, 80))` returns `"#f2364533"`.
The `hexStringToColor()` function returns the "color" value represented by a string containing a six- or eight-digit hex code. The `hexStringToRGB()` function returns a tuple containing the sRGB and transparency values. For example, `hexStringToColor("#f23645")` returns the same value as color.red .
Programmers can use these functions to parse colors from "string" inputs, perform string-based color calculations, and inspect color data in text outputs such as Pine Logs and tables.
Color space conversion
All other `get*()` functions convert a "color" value or set of sRGB channels into coordinates in a specific color space, with transparency information included. For example, the tuple returned by `getHSL()` includes the color's hue, saturation, lightness, and transparency values.
To convert data from a color space back to colors or sRGB and transparency values, use the corresponding `*toColor()` or `*toRGB()` functions for that space (e.g., `hslToColor()` and `hslToRGB()`).
Programmers can use these conversion functions to process inputs that define colors in different ways, perform advanced color manipulation, design custom gradients, and more.
The color spaces this library supports are:
• sRGB
• Linear RGB (RGB without gamma correction)
• HSL, HSV, and HWB
• CIE XYZ and xyY
• CIELAB and CIELCh
• Oklab and Oklch
Contrast-based calculations
Contrast refers to the difference in luminance or color that makes one color visible against another. This library features two functions for calculating luminance-based contrast and detecting themes.
The `contrastRatio()` function calculates the contrast between two "color" values based on their relative luminance (the Y value from CIE XYZ) using the formula from version 2 of the Web Content Accessibility Guidelines (WCAG) . This function is useful for identifying colors that provide a sufficient brightness difference for legibility.
The `isLightTheme()` function determines whether a specified background color represents a light theme based on its contrast with black and white. Programmers can use this function to define conditional logic that responds differently to light and dark themes.
Color manipulation and harmonies
The `negative()` function calculates the negative (i.e., inverse) of a color by reversing the color's coordinates in either the sRGB or linear RGB color space. This function is useful for calculating high-contrast colors.
The `grayscale()` function calculates a grayscale form of a specified color with the same relative luminance.
The functions `complement()`, `splitComplements()`, `analogousColors()`, `triadicColors()`, `tetradicColors()`, `pentadicColors()`, and `hexadicColors()` calculate color harmonies from a specified source color within a given color space (HSL, CIELCh, or Oklch). The returned harmonious colors represent specific hue rotations around a color wheel formed by the chosen space, with the same defined lightness, saturation or chroma, and transparency.
Color mixing and gradient creation
The `add()` function simulates combining lights of two different colors by additively mixing their linear red, green, and blue components, ignoring transparency by default. Users can calculate a transparency-weighted mixture by setting the `transpWeight` argument to `true`.
The `overlay()` function estimates the color displayed on a TradingView chart when a specific foreground color is over a background color. This function aids in simulating stacked colors and analyzing the effects of transparency.
The `fromGradient()` and `fromMultiStepGradient()` functions calculate colors from gradients in any of the supported color spaces, providing flexible alternatives to the RGB-based color.from_gradient() function. The `fromGradient()` function calculates a color from a single gradient. The `fromMultiStepGradient()` function calculates a color from a piecewise gradient with multiple defined steps. Gradients are useful for heatmaps and for coloring plots or drawings based on value intensities.
Scheme creation
Three functions in this library calculate palettes for custom color schemes. Scripts can use these functions to create responsive color schemes that adjust to calculated values and user inputs.
The `gradientPalette()` function creates an array of colors by sampling a specified number of colors along a gradient from a base color to a target color, in fixed-size steps.
The `monoPalette()` function creates an array containing monochromatic variants (tints, tones, or shades) of a specified base color. Whether the function mixes the color toward white (for tints), a form of gray (for tones), or black (for shades) depends on the `grayLuminance` value. If unspecified, the function automatically chooses the mix behavior with the highest contrast.
The `harmonyPalette()` function creates a matrix of colors. The first column contains the base color and specified harmonies, e.g., triadic colors. The columns that follow contain tints, tones, or shades of the harmonic colors for additional color choices, similar to `monoPalette()`.
█ EXAMPLE CODE
The example code at the end of the script generates and visualizes color schemes by processing user inputs. The code builds the scheme's palette based on the "Base color" input and the additional inputs in the "Settings/Inputs" tab:
• "Palette type" specifies whether the palette uses a custom gradient, monochromatic base color variants, or color harmonies with monochromatic variants.
• "Target color" sets the top color for the "Gradient" palette type.
• The "Gray luminance" inputs determine variation behavior for "Monochromatic" and "Harmony" palette types. If "Auto" is selected, the palette mixes the base color toward white or black based on its brightness. Otherwise, it mixes the color toward the grayscale color with the specified relative luminance (from 0 to 1).
• "Harmony type" specifies the color harmony used in the palette. Each row in the palette corresponds to one of the harmonious colors, starting with the base color.
The code creates a table on the first bar to display the collection of calculated colors. Each cell in the table shows the color's `getHexString()` value in a tooltip for simple inspection.
Look first. Then leap.
█ EXPORTED FUNCTIONS
Below is a complete list of the functions and overloads exported by this library.
getRGB(source)
Retrieves the sRGB red, green, blue, and transparency components of a "color" value.
getHexString(r, g, b, t)
(Overload 1 of 2) Converts a set of sRGB channel values to a string representing the corresponding color's hexadecimal form.
getHexString(source)
(Overload 2 of 2) Converts a "color" value to a string representing the sRGB color's hexadecimal form.
hexStringToRGB(source)
Converts a string representing an sRGB color's hexadecimal form to a set of decimal channel values.
hexStringToColor(source)
Converts a string representing an sRGB color's hexadecimal form to a "color" value.
getLRGB(r, g, b, t)
(Overload 1 of 2) Converts a set of sRGB channel values to a set of linear RGB values with specified transparency information.
getLRGB(source)
(Overload 2 of 2) Retrieves linear RGB channel values and transparency information from a "color" value.
lrgbToRGB(lr, lg, lb, t)
Converts a set of linear RGB channel values to a set of sRGB values with specified transparency information.
lrgbToColor(lr, lg, lb, t)
Converts a set of linear RGB channel values and transparency information to a "color" value.
getHSL(r, g, b, t)
(Overload 1 of 2) Converts a set of sRGB channels to a set of HSL values with specified transparency information.
getHSL(source)
(Overload 2 of 2) Retrieves HSL channel values and transparency information from a "color" value.
hslToRGB(h, s, l, t)
Converts a set of HSL channel values to a set of sRGB values with specified transparency information.
hslToColor(h, s, l, t)
Converts a set of HSL channel values and transparency information to a "color" value.
getHSV(r, g, b, t)
(Overload 1 of 2) Converts a set of sRGB channels to a set of HSV values with specified transparency information.
getHSV(source)
(Overload 2 of 2) Retrieves HSV channel values and transparency information from a "color" value.
hsvToRGB(h, s, v, t)
Converts a set of HSV channel values to a set of sRGB values with specified transparency information.
hsvToColor(h, s, v, t)
Converts a set of HSV channel values and transparency information to a "color" value.
getHWB(r, g, b, t)
(Overload 1 of 2) Converts a set of sRGB channels to a set of HWB values with specified transparency information.
getHWB(source)
(Overload 2 of 2) Retrieves HWB channel values and transparency information from a "color" value.
hwbToRGB(h, w, b, t)
Converts a set of HWB channel values to a set of sRGB values with specified transparency information.
hwbToColor(h, w, b, t)
Converts a set of HWB channel values and transparency information to a "color" value.
getXYZ(r, g, b, t)
(Overload 1 of 2) Converts a set of sRGB channels to a set of XYZ values with specified transparency information.
getXYZ(source)
(Overload 2 of 2) Retrieves XYZ channel values and transparency information from a "color" value.
xyzToRGB(x, y, z, t)
Converts a set of XYZ channel values to a set of sRGB values with specified transparency information
xyzToColor(x, y, z, t)
Converts a set of XYZ channel values and transparency information to a "color" value.
getXYY(r, g, b, t)
(Overload 1 of 2) Converts a set of sRGB channels to a set of xyY values with specified transparency information.
getXYY(source)
(Overload 2 of 2) Retrieves xyY channel values and transparency information from a "color" value.
xyyToRGB(xc, yc, y, t)
Converts a set of xyY channel values to a set of sRGB values with specified transparency information.
xyyToColor(xc, yc, y, t)
Converts a set of xyY channel values and transparency information to a "color" value.
getLAB(r, g, b, t)
(Overload 1 of 2) Converts a set of sRGB channels to a set of CIELAB values with specified transparency information.
getLAB(source)
(Overload 2 of 2) Retrieves CIELAB channel values and transparency information from a "color" value.
labToRGB(l, a, b, t)
Converts a set of CIELAB channel values to a set of sRGB values with specified transparency information.
labToColor(l, a, b, t)
Converts a set of CIELAB channel values and transparency information to a "color" value.
getOKLAB(r, g, b, t)
(Overload 1 of 2) Converts a set of sRGB channels to a set of Oklab values with specified transparency information.
getOKLAB(source)
(Overload 2 of 2) Retrieves Oklab channel values and transparency information from a "color" value.
oklabToRGB(l, a, b, t)
Converts a set of Oklab channel values to a set of sRGB values with specified transparency information.
oklabToColor(l, a, b, t)
Converts a set of Oklab channel values and transparency information to a "color" value.
getLCH(r, g, b, t)
(Overload 1 of 2) Converts a set of sRGB channels to a set of CIELCh values with specified transparency information.
getLCH(source)
(Overload 2 of 2) Retrieves CIELCh channel values and transparency information from a "color" value.
lchToRGB(l, c, h, t)
Converts a set of CIELCh channel values to a set of sRGB values with specified transparency information.
lchToColor(l, c, h, t)
Converts a set of CIELCh channel values and transparency information to a "color" value.
getOKLCH(r, g, b, t)
(Overload 1 of 2) Converts a set of sRGB channels to a set of Oklch values with specified transparency information.
getOKLCH(source)
(Overload 2 of 2) Retrieves Oklch channel values and transparency information from a "color" value.
oklchToRGB(l, c, h, t)
Converts a set of Oklch channel values to a set of sRGB values with specified transparency information.
oklchToColor(l, c, h, t)
Converts a set of Oklch channel values and transparency information to a "color" value.
contrastRatio(value1, value2)
Calculates the contrast ratio between two colors values based on the formula from version 2 of the Web Content Accessibility Guidelines (WCAG).
isLightTheme(source)
Detects whether a background color represents a light theme or dark theme, based on the amount of contrast between the color and the white and black points.
grayscale(source)
Calculates the grayscale version of a color with the same relative luminance (i.e., brightness).
negative(source, colorSpace)
Calculates the negative (i.e., inverted) form of a specified color.
complement(source, colorSpace)
Calculates the complementary color for a `source` color using a cylindrical color space.
analogousColors(source, colorSpace)
Calculates the analogous colors for a `source` color using a cylindrical color space.
splitComplements(source, colorSpace)
Calculates the split-complementary colors for a `source` color using a cylindrical color space.
triadicColors(source, colorSpace)
Calculates the two triadic colors for a `source` color using a cylindrical color space.
tetradicColors(source, colorSpace, square)
Calculates the three square or rectangular tetradic colors for a `source` color using a cylindrical color space.
pentadicColors(source, colorSpace)
Calculates the four pentadic colors for a `source` color using a cylindrical color space.
hexadicColors(source, colorSpace)
Calculates the five hexadic colors for a `source` color using a cylindrical color space.
add(value1, value2, transpWeight)
Additively mixes two "color" values, with optional transparency weighting.
overlay(fg, bg)
Estimates the resulting color that appears on the chart when placing one color over another.
fromGradient(value, bottomValue, topValue, bottomColor, topColor, colorSpace)
Calculates the gradient color that corresponds to a specific value based on a defined value range and color space.
fromMultiStepGradient(value, steps, colors, colorSpace)
Calculates a multi-step gradient color that corresponds to a specific value based on an array of step points, an array of corresponding colors, and a color space.
gradientPalette(baseColor, stopColor, steps, strength, model)
Generates a palette from a gradient between two base colors.
monoPalette(baseColor, grayLuminance, variations, strength, colorSpace)
Generates a monochromatic palette from a specified base color.
harmonyPalette(baseColor, harmonyType, grayLuminance, variations, strength, colorSpace)
Generates a palette consisting of harmonious base colors and their monochromatic variants.

juan_dibujosLibrary "juan_dibujos"
extend_line(lineId, labelId)
: Extend specific line with its label
Parameters:
lineId (line)
labelId (label)
update_line_coordinates(lineId, labelId, x1, y1, x2, y2)
: Update specific line coordinates with its label
Parameters:
lineId (line)
labelId (label)
x1 (int)
y1 (float)
x2 (int)
y2 (float)
update_label_coordinates(labelId, value)
: Update coordinates of a label
Parameters:
labelId (label)
value (float)
delete_line(lineId, labelId)
: Delete specific line with its label
Parameters:
lineId (line)
labelId (label)
update_box_coordinates(boxId, labelId, left, top, right, bottom)
: Update specific box coordinates with its label
Parameters:
boxId (box)
labelId (label)
left (int)
top (float)
right (int)
bottom (float)
delete_box(boxId, labelId)
: Delete specific box with its label
Parameters:
boxId (box)
labelId (label)
FvgTypes█ OVERVIEW
This library serves as a foundational module for Pine Script™ projects focused on Fair Value Gaps (FVGs). Its primary purpose is to define and centralize custom data structures (User-Defined Types - UDTs) and enumerations that are utilized across various components of an FVG analysis system. By providing standardized types for FVG characteristics and drawing configurations, it promotes code consistency, readability, and easier maintenance within a larger FVG indicator or strategy.
█ CONCEPTS
The library introduces several key data structures (User-Defined Types - UDTs) and an enumeration to organize Fair Value Gap (FVG) related data logically. These types are central to the functioning of FVG analysis tools built upon this library.
Timeframe Categorization (`tfType` Enum)
To manage and differentiate FVGs based on their timeframe of origin, the `tfType` enumeration is defined. It includes:
`LTF`: Low Timeframe (typically the current chart).
`MTF`: Medium Timeframe.
`HTF`: High Timeframe.
This allows for distinct logic and visual settings to be applied depending on the FVG's source timeframe.
FVG Data Encapsulation (`fvgObject` UDT)
The `fvgObject` is a comprehensive UDT designed to encapsulate all pertinent information and state for an individual Fair Value Gap throughout its lifecycle. Instead of listing every field, its conceptual structure can be understood as holding:
Core Definition: The FVG's fundamental price levels (top, bottom) and its formation time (`startTime`).
Classification Attributes: Characteristics such as its direction (`isBullish`) and whether it qualifies as a Large Volume FVG (`isLV`), along with its originating timeframe category (`tfType`).
Lifecycle State: Current status indicators including full mitigation (`isMitigated`, `mitigationTime`), partial fill levels (`currentTop`, `currentBottom`), midline interaction (`isMidlineTouched`), and overall visibility (`isVisible`).
Drawing Identifiers: References (`boxId`, `midLineId`, `mitLineLabelId`, etc.) to the actual graphical objects drawn on the chart to represent the FVG and its components.
Optimization Cache: Previous-bar state values (`prevIsMitigated`, `prevCurrentTop`, etc.) crucial for optimizing drawing updates by avoiding redundant operations.
This comprehensive structure facilitates easy access to all FVG-related information through a single object, reducing code complexity and improving manageability.
Drawing Configuration (`drawSettings` UDT)
The `drawSettings` UDT centralizes all user-configurable parameters that dictate the visual appearance of FVGs across different timeframes. It's typically populated from script inputs and conceptually groups settings for:
General Behavior: Global FVG classification toggles (e.g., `shouldClassifyLV`) and general display rules (e.g., `shouldHideMitigated`).
FVG Type Specific Colors: Colors for standard and Large Volume FVGs, both active and mitigated (e.g., `lvBullColor`, `mitigatedBearBoxColor`).
Timeframe-Specific Visuals (LTF, MTF, HTF): Detailed parameters for each timeframe category, covering FVG boxes (visibility, colors, extension, borders, labels), midlines (visibility, style, color), and mitigation lines (visibility, style, color, labels, persistence after mitigation).
Contextual Information: The current bar's time (`currentTime`) for accurate positioning of time-dependent drawing elements and timeframe display strings (`tfString`, `mtfTfString`, `htfTfString`).
This centralized approach allows for extensive customization of FVG visuals and simplifies the management of drawing parameters within the main script. Such centralization also enhances the maintainability of the visual aspects of the FVG system.
█ NOTES
User-Defined Types (UDTs): This library extensively uses UDTs (`fvgObject`, `drawSettings`) to group related data. This improves code organization and makes it easier to pass complex data between functions and libraries.
Mutability and Reference Behavior of UDTs: When UDT instances are passed to functions or methods in other libraries (like `fvgObjectLib`), those functions might modify the fields of the passed object if they are not explicitly designed to return new instances. This is because UDTs are passed by reference and are mutable in Pine Script™. Users should be aware of this standard behavior to prevent unintended side effects.
Optimization Fields: The `prev_*` fields in `fvgObject` are crucial for performance optimization in the drawing logic. They help avoid unnecessary redrawing of FVG elements if their state or relevant settings haven't changed.
No Direct Drawing Logic: `FvgTypes` itself does not contain any drawing logic. It solely defines the data structures. The actual drawing and manipulation of these objects are handled by other libraries (e.g., `fvgObjectLib`).
Centralized Definitions: By defining these types in a separate library, any changes to the structure of FVG data or settings can be made in one place, ensuring consistency across all dependent scripts and libraries.
█ EXPORTED TYPES
fvgObject
fvgObject Represents a Fair Value Gap (FVG) object.
Fields:
top (series float) : The top price level of the FVG.
bottom (series float) : The bottom price level of the FVG.
startTime (series int) : The start time (timestamp) of the bar where the FVG formed.
isBullish (series bool) : Indicates if the FVG is bullish (true) or bearish (false).
isLV (series bool) : Indicates if the FVG is a Large Volume FVG.
tfType (series tfType) : The timeframe type (LTF, MTF, HTF) to which this FVG belongs.
isMitigated (series bool) : Indicates if the FVG has been fully mitigated.
mitigationTime (series int) : The time (timestamp) when the FVG was mitigated.
isVisible (series bool) : The current visibility status of the FVG, typically managed by drawing logic based on filters.
isMidlineTouched (series bool) : Indicates if the price has touched the FVG's midline (50% level).
currentTop (series float) : The current top level of the FVG after partial fills.
currentBottom (series float) : The current bottom level of the FVG after partial fills.
boxId (series box) : The drawing ID for the main FVG box.
mitigatedBoxId (series box) : The drawing ID for the box representing the partially filled (mitigated) area.
midLineId (series line) : The drawing ID for the FVG's midline.
mitLineId (series line) : The drawing ID for the FVG's mitigation line.
boxLabelId (series label) : The drawing ID for the FVG box label.
mitLineLabelId (series label) : The drawing ID for the mitigation line label.
testedBoxId (series box) : The drawing ID for the box of a fully mitigated (tested) FVG, if kept visible.
keptMitLineId (series line) : The drawing ID for a mitigation line that is kept after full mitigation.
prevIsMitigated (series bool) : Stores the isMitigated state from the previous bar for optimization.
prevCurrentTop (series float) : Stores the currentTop value from the previous bar for optimization.
prevCurrentBottom (series float) : Stores the currentBottom value from the previous bar for optimization.
prevIsVisible (series bool) : Stores the visibility status from the previous bar for optimization (derived from isVisibleNow passed to updateDrawings).
prevIsMidlineTouched (series bool) : Stores the isMidlineTouched status from the previous bar for optimization.
drawSettings
drawSettings A structure containing settings for drawing FVGs.
Fields:
shouldClassifyLV (series bool) : Whether to classify FVGs as Large Volume (LV) based on ATR.
shouldHideMitigated (series bool) : Whether to hide FVG boxes once they are fully mitigated.
currentTime (series int) : The current bar's time, used for extending drawings.
lvBullColor (series color) : Color for Large Volume Bullish FVGs.
mitigatedLvBullColor (series color) : Color for mitigated Large Volume Bullish FVGs.
lvBearColor (series color) : Color for Large Volume Bearish FVGs.
mitigatedLvBearColor (series color) : Color for mitigated Large Volume Bearish FVGs.
shouldShowBoxes (series bool) : Whether to show FVG boxes for the LTF.
bullBoxColor (series color) : Color for LTF Bullish FVG boxes.
mitigatedBullBoxColor (series color) : Color for mitigated LTF Bullish FVG boxes.
bearBoxColor (series color) : Color for LTF Bearish FVG boxes.
mitigatedBearBoxColor (series color) : Color for mitigated LTF Bearish FVG boxes.
boxLengthBars (series int) : Length of LTF FVG boxes in bars (if not extended).
shouldExtendBoxes (series bool) : Whether to extend LTF FVG boxes to the right.
shouldShowCurrentTfBoxLabels (series bool) : Whether to show labels on LTF FVG boxes.
shouldShowBoxBorder (series bool) : Whether to show a border for LTF FVG boxes.
boxBorderWidth (series int) : Border width for LTF FVG boxes.
boxBorderStyle (series string) : Border style for LTF FVG boxes (e.g., line.style_solid).
boxBorderColor (series color) : Border color for LTF FVG boxes.
shouldShowMidpoint (series bool) : Whether to show the midline (50% level) for LTF FVGs.
midLineWidthInput (series int) : Width of the LTF FVG midline.
midpointLineStyleInput (series string) : Style of the LTF FVG midline.
midpointColorInput (series color) : Color of the LTF FVG midline.
shouldShowMitigationLine (series bool) : Whether to show the mitigation line for LTF FVGs.
(Line always extends if shown)
mitLineWidthInput (series int) : Width of the LTF FVG mitigation line.
mitigationLineStyleInput (series string) : Style of the LTF FVG mitigation line.
mitigationLineColorInput (series color) : Color of the LTF FVG mitigation line.
shouldShowCurrentTfMitLineLabels (series bool) : Whether to show labels on LTF FVG mitigation lines.
currentTfMitLineLabelOffsetX (series float) : The horizontal offset value for the LTF mitigation line's label.
shouldKeepMitigatedLines (series bool) : Whether to keep showing mitigation lines of fully mitigated LTF FVGs.
mitigatedMitLineColor (series color) : Color for kept mitigation lines of mitigated LTF FVGs.
tfString (series string) : Display string for the LTF (e.g., "Current TF").
shouldShowMtfBoxes (series bool) : Whether to show FVG boxes for the MTF.
mtfBullBoxColor (series color) : Color for MTF Bullish FVG boxes.
mtfMitigatedBullBoxColor (series color) : Color for mitigated MTF Bullish FVG boxes.
mtfBearBoxColor (series color) : Color for MTF Bearish FVG boxes.
mtfMitigatedBearBoxColor (series color) : Color for mitigated MTF Bearish FVG boxes.
mtfBoxLengthBars (series int) : Length of MTF FVG boxes in bars (if not extended).
shouldExtendMtfBoxes (series bool) : Whether to extend MTF FVG boxes to the right.
shouldShowMtfBoxLabels (series bool) : Whether to show labels on MTF FVG boxes.
shouldShowMtfBoxBorder (series bool) : Whether to show a border for MTF FVG boxes.
mtfBoxBorderWidth (series int) : Border width for MTF FVG boxes.
mtfBoxBorderStyle (series string) : Border style for MTF FVG boxes.
mtfBoxBorderColor (series color) : Border color for MTF FVG boxes.
shouldShowMtfMidpoint (series bool) : Whether to show the midline for MTF FVGs.
mtfMidLineWidthInput (series int) : Width of the MTF FVG midline.
mtfMidpointLineStyleInput (series string) : Style of the MTF FVG midline.
mtfMidpointColorInput (series color) : Color of the MTF FVG midline.
shouldShowMtfMitigationLine (series bool) : Whether to show the mitigation line for MTF FVGs.
(Line always extends if shown)
mtfMitLineWidthInput (series int) : Width of the MTF FVG mitigation line.
mtfMitigationLineStyleInput (series string) : Style of the MTF FVG mitigation line.
mtfMitigationLineColorInput (series color) : Color of the MTF FVG mitigation line.
shouldShowMtfMitLineLabels (series bool) : Whether to show labels on MTF FVG mitigation lines.
mtfMitLineLabelOffsetX (series float) : The horizontal offset value for the MTF mitigation line's label.
shouldKeepMtfMitigatedLines (series bool) : Whether to keep showing mitigation lines of fully mitigated MTF FVGs.
mtfMitigatedMitLineColor (series color) : Color for kept mitigation lines of mitigated MTF FVGs.
mtfTfString (series string) : Display string for the MTF (e.g., "MTF").
shouldShowHtfBoxes (series bool) : Whether to show FVG boxes for the HTF.
htfBullBoxColor (series color) : Color for HTF Bullish FVG boxes.
htfMitigatedBullBoxColor (series color) : Color for mitigated HTF Bullish FVG boxes.
htfBearBoxColor (series color) : Color for HTF Bearish FVG boxes.
htfMitigatedBearBoxColor (series color) : Color for mitigated HTF Bearish FVG boxes.
htfBoxLengthBars (series int) : Length of HTF FVG boxes in bars (if not extended).
shouldExtendHtfBoxes (series bool) : Whether to extend HTF FVG boxes to the right.
shouldShowHtfBoxLabels (series bool) : Whether to show labels on HTF FVG boxes.
shouldShowHtfBoxBorder (series bool) : Whether to show a border for HTF FVG boxes.
htfBoxBorderWidth (series int) : Border width for HTF FVG boxes.
htfBoxBorderStyle (series string) : Border style for HTF FVG boxes.
htfBoxBorderColor (series color) : Border color for HTF FVG boxes.
shouldShowHtfMidpoint (series bool) : Whether to show the midline for HTF FVGs.
htfMidLineWidthInput (series int) : Width of the HTF FVG midline.
htfMidpointLineStyleInput (series string) : Style of the HTF FVG midline.
htfMidpointColorInput (series color) : Color of the HTF FVG midline.
shouldShowHtfMitigationLine (series bool) : Whether to show the mitigation line for HTF FVGs.
(Line always extends if shown)
htfMitLineWidthInput (series int) : Width of the HTF FVG mitigation line.
htfMitigationLineStyleInput (series string) : Style of the HTF FVG mitigation line.
htfMitigationLineColorInput (series color) : Color of the HTF FVG mitigation line.
shouldShowHtfMitLineLabels (series bool) : Whether to show labels on HTF FVG mitigation lines.
htfMitLineLabelOffsetX (series float) : The horizontal offset value for the HTF mitigation line's label.
shouldKeepHtfMitigatedLines (series bool) : Whether to keep showing mitigation lines of fully mitigated HTF FVGs.
htfMitigatedMitLineColor (series color) : Color for kept mitigation lines of mitigated HTF FVGs.
htfTfString (series string) : Display string for the HTF (e.g., "HTF").

StrategyUtilsLibrary "StrategyUtils"
getHeikinAshi(open, high, low, close)
getHeikinAshi
Parameters:
open (float) : float: Raw open price
high (float) : float: Raw high price
low (float) : float: Raw low price
close (float) : float: Raw close price
Returns: tuple of haOpen, haClose, haHigh, haLow
getFibExtensions(high, low)
getFibExtensions
Parameters:
high (float) : float: Highest point before trade
low (float) : float: Lowest point before trade
Returns: tuple of extension levels
inBacktestWindow(time, start, end)
inBacktestWindow
Parameters:
time (int) : int: Current bar time
start (int) : int: Start timestamp
end (int) : int: End timestamp
Returns: bool: true if within Fbrange
getCurrentState(buy, sell)
getCurrentState
Parameters:
buy (bool) : bool: Buy signal condition
sell (bool) : bool: Sell signal condition
Returns: string: "Buy", "Sell", or "None"
formatPrice(price)
formatPrice
Parameters:
price (float) : float: Input price value
Returns: string: Formatted price string
getColorByProfit(netprofit, initial, green, red)
getColorByProfit
Parameters:
netprofit (float) : float: Strategy net profit
initial (float) : float: Initial capital
green (color) : color: Positive color
red (color) : color: Negative color
Returns: color: Display color based on PnL
UTSConvenienceToolsLibrary "UTSConvenienceTools"
Convenience tool library containing helper functions for drawing and charting.
isDarkColor(color)
Determines on base of the luminance of the given color if the color can be considered a 'dark' color. Usefull for determining the readable font color for arbitrary colored backgrounds. Credits out to:
Parameters:
color (color) : (color): The actual color value.
Returns: (bool): A boolean value.
smallLabelLowerRight(txt, yPos, bgColor)
Displays the specified `txt` in a small label at the `yPos` of the current bar. The label points to the lower right.
Parameters:
txt (string)
yPos (float) : (float): The y-position value. To have it positioned above the candle pass 'high'.
bgColor (color) : (color): The background color value.
Returns: (bool): A boolean value.
smallLabelUpperRight(txt, yPos, bgColor)
Displays the specified `txt` in a small label at the `yPos` of the current bar. The label points to the upper right.
Parameters:
txt (string)
yPos (float) : (float): The y-position value. To have it positioned below the candle pass 'low'.
bgColor (color) : (color): The background color value.
Returns: (bool): A boolean value.
smallLabelCenter(txt, yPos, bgColor)
Displays the specified `txt` in a small label at the `yPos` of the current bar. The label points to the center.
Parameters:
txt (string)
yPos (float) : (float): The y-position value. To have it positioned above the candle pass 'high'. To have it positioned below the candle pass 'low'.
bgColor (color) : (color): The background color value.
Returns: (bool): A boolean value.
smallLabelDown(txt, yPos, bgColor)
Displays the specified `txt` in a small label at the `yPos` of the current bar. The label points down.
Parameters:
txt (string)
yPos (float) : (float): The y-position value. To have it positioned above the candle pass 'high'.
bgColor (color) : (color): The background color value.
Returns: (bool): A boolean value.
smallLabelUp(txt, yPos, bgColor)
Displays the specified `txt` in a small label at the `yPos` of the current bar. The label points down.
Parameters:
txt (string)
yPos (float) : (float): The y-position value. To have it positioned below the candle pass 'low'.
bgColor (color) : (color): The background color value.
Returns: (bool): A boolean value.
normalLabelLowerRight(txt, yPos, bgColor)
Displays the specified `txt` in a normal label at the `yPos` of the current bar. The label points to the lower right.
Parameters:
txt (string)
yPos (float) : (float): The y-position value. To have it positioned above the candle pass 'high'.
bgColor (color) : (color): The background color value.
Returns: (bool): A boolean value.
normalLabelUpperRight(txt, yPos, bgColor)
Displays the specified `txt` in a normal label at the `yPos` of the current bar. The label points to the upper right.
Parameters:
txt (string)
yPos (float) : (float): The y-position value. To have it positioned below the candle pass 'low'.
bgColor (color) : (color): The background color value.
Returns: (bool): A boolean value.
normalLabelCenter(txt, yPos, bgColor)
Displays the specified `txt` in a normal label at the `yPos` of the current bar. The label points to the center.
Parameters:
txt (string)
yPos (float) : (float): The y-position value. To have it positioned above the candle pass 'high'. To have it positioned below the candle pass 'low'.
bgColor (color) : (color): The background color value.
Returns: (bool): A boolean value.
normalLabelDown(txt, yPos, bgColor)
Displays the specified `txt` in a normal label at the `yPos` of the current bar. The label points down.
Parameters:
txt (string)
yPos (float) : (float): The y-position value. To have it positioned above the candle pass 'high'.
bgColor (color) : (color): The background color value.
Returns: (bool): A boolean value.
normalLabelUp(txt, yPos, bgColor)
Displays the specified `txt` in a normal label at the `yPos` of the current bar. The label points down.
Parameters:
txt (string)
yPos (float) : (float): The y-position value. To have it positioned below the candle pass 'low'.
bgColor (color) : (color): The background color value.
Returns: (bool): A boolean value.
largeLabelLowerRight(txt, yPos, bgColor)
Displays the specified `txt` in a large label at the `yPos` of the current bar. The label points to the lower right.
Parameters:
txt (string)
yPos (float) : (float): The y-position value. To have it positioned above the candle pass 'high'.
bgColor (color) : (color): The background color value.
Returns: (bool): A boolean value.
largeLabelUpperRight(txt, yPos, bgColor)
Displays the specified `txt` in a large label at the `yPos` of the current bar. The label points to the upper right.
Parameters:
txt (string)
yPos (float) : (float): The y-position value. To have it positioned below the candle pass 'low'.
bgColor (color) : (color): The background color value.
Returns: (bool): A boolean value.
largeLabelCenter(txt, yPos, bgColor)
Displays the specified `txt` in a large label at the `yPos` of the current bar. The label points to the center.
Parameters:
txt (string)
yPos (float) : (float): The y-position value. To have it positioned above the candle pass 'high'. To have it positioned below the candle pass 'low'.
bgColor (color) : (color): The background color value.
Returns: (bool): A boolean value.
largeLabelDown(txt, yPos, bgColor)
Displays the specified `txt` in a large label at the `yPos` of the current bar. The label points down.
Parameters:
txt (string)
yPos (float) : (float): The y-position value. To have it positioned above the candle pass 'high'.
bgColor (color) : (color): The background color value.
Returns: (bool): A boolean value.
largeLabelUp(txt, yPos, bgColor)
Displays the specified `txt` in a large label at the `yPos` of the current bar. The label points down.
Parameters:
txt (string)
yPos (float) : (float): The y-position value. To have it positioned below the candle pass 'low'.
bgColor (color) : (color): The background color value.
Returns: (bool): A boolean value.
autoLabelLowerRight(txt, yPos, bgColor)
Displays the specified `txt` in a auto label at the `yPos` of the current bar. The label points to the lower right.
Parameters:
txt (string)
yPos (float) : (float): The y-position value. To have it positioned above the candle pass 'high'.
bgColor (color) : (color): The background color value.
Returns: (bool): A boolean value.
autoLabelUpperRight(txt, yPos, bgColor)
Displays the specified `txt` in a auto label at the `yPos` of the current bar. The label points to the upper right.
Parameters:
txt (string)
yPos (float) : (float): The y-position value. To have it positioned below the candle pass 'low'.
bgColor (color) : (color): The background color value.
Returns: (bool): A boolean value.
autoLabelCenter(txt, yPos, bgColor)
Displays the specified `txt` in a auto label at the `yPos` of the current bar. The label points to the center.
Parameters:
txt (string)
yPos (float) : (float): The y-position value. To have it positioned above the candle pass 'high'. To have it positioned below the candle pass 'low'.
bgColor (color) : (color): The background color value.
Returns: (bool): A boolean value.
autoLabelDown(txt, yPos, bgColor)
Displays the specified `txt` in a auto label at the `yPos` of the current bar. The label points down.
Parameters:
txt (string)
yPos (float) : (float): The y-position value. To have it positioned above the candle pass 'high'.
bgColor (color) : (color): The background color value.
Returns: (bool): A boolean value.
autoLabelUp(txt, yPos, bgColor)
Displays the specified `txt` in a auto label at the `yPos` of the current bar. The label points down.
Parameters:
txt (string)
yPos (float) : (float): The y-position value. To have it positioned below the candle pass 'low'.
bgColor (color) : (color): The background color value.
Returns: (bool): A boolean value.

position_toolLibrary "position_tool"
Trying to turn TradingView's position tool into a library from which you can draw position tools for your strategies on the chart. Not sure if this is going to work
calcBaseUnit()
Calculates the chart symbol's base unit of change in asset prices.
Returns: (float) A ticks or pips value of base units of change.
calcOrderPipsOrTicks(orderSize, unit)
Converts the `orderSize` to ticks.
Parameters:
orderSize (float) : (series float) The order size to convert to ticks.
unit (simple float) : (simple float) The basic units of change in asset prices.
Returns: (int) A tick value based on a given order size.
calcProfitLossSize(price, entryPrice, isLongPosition)
Calculates a difference between a `price` and the `entryPrice` in absolute terms.
Parameters:
price (float) : (series float) The price to calculate the difference from.
entryPrice (float) : (series float) The price of entry for the position.
isLongPosition (bool)
Returns: (float) The absolute price displacement of a price from an entry price.
calcRiskRewardRatio(profitSize, lossSize)
Calculates a risk to reward ratio given the size of profit and loss.
Parameters:
profitSize (float) : (series float) The size of the profit in absolute terms.
lossSize (float) : (series float) The size of the loss in absolute terms.
Returns: (float) The ratio between the `profitSize` to the `lossSize`
createPosition(entryPrice, entryTime, tpPrice, slPrice, entryColor, tpColor, slColor, textColor, showExtendRight)
Main function to create a position visualization with entry, TP, and SL
Parameters:
entryPrice (float) : (float) The entry price of the position
entryTime (int) : (int) The entry time of the position in bar_time format
tpPrice (float) : (float) The take profit price
slPrice (float) : (float) The stop loss price
entryColor (color) : (color) Color for entry line
tpColor (color) : (color) Color for take profit zone
slColor (color) : (color) Color for stop loss zone
textColor (color) : (color) Color for text labels
showExtendRight (bool) : (bool) Whether to extend lines to the right
Returns: (bool) Returns true when position is closed
vidya_calculateLibrary "vidya_calculate"
:
Calculates the Variable Index Dynamic Average (VIDYA).
Computes the VIDYA, which adjusts the degree of smoothing based on the strength of price momentum (absolute value of CMO),
and then returns the 15-period(variable) Simple Moving Average (SMA) of that VIDYA.
VIDYA tends to follow prices more closely when price fluctuations are large, and is smoothed more when fluctuations are small.
CMO = Chande Momentum Oscillator.
vidya(src, vidyaLength, vidyaMomentum, vidyaTrendPeriod)
: Calculates the Variable Index Dynamic Average (VIDYA)
Parameters:
src (float) : : Source
vidyaLength (int) : : VIDYA Length
vidyaMomentum (int) : : VIDYA Momentum
vidyaTrendPeriod (int) : : VIDYA Trend Period (Display)
Returns: : the 15-period(variable) Simple Moving Average (SMA) of that VIDYA

MyRenkoLibraryLibrary "MyRenkoLibrary"
calcRenko(real_break_size)
Parameters:
real_break_size (float)

Milvetti_TraderPost_LibraryLibrary "Milvetti_TraderPost_Library"
This library has methods that provide practical signal transmission for traderpost.Developed By Milvetti
cancelOrders(symbol)
This method generates a signal in JSON format that cancels all orders for the specified pair. (If you want to cancel stop loss and takeprofit orders together, use the “exitOrder” method.
Parameters:
symbol (string)
exitOrders(symbol)
This method generates a signal in JSON format that close all orders for the specified pair.
Parameters:
symbol (string)
createOrder(ticker, positionType, orderType, entryPrice, signalPrice, qtyType, qty, stopLoss, stopType, stopValue, takeProfit, profitType, profitValue, timeInForce)
This function is designed to send buy or sell orders to traderpost. It can create customized orders by flexibly specifying parameters such as order type, position type, entry price, quantity calculation method, stop-loss, and take-profit. The purpose of the function is to consolidate all necessary details for opening a position into a single structure and present it as a structured JSON output. This format can be sent to trading platforms via webhooks.
Parameters:
ticker (string) : The ticker symbol of the instrument. Default value is the current chart's ticker (syminfo.ticker).
positionType (string) : Determines the type of order (e.g., "long" or "buy" for buying and "short" or "sell" for selling).
orderType (string) : Defines the order type for execution. Options: "market", "limit", "stop". Default is "market"
entryPrice (float) : The price level for entry orders. Only applicable for limit or stop orders. Default is 0 (market orders ignore this).
signalPrice (float) : Optional. Only necessary when using relative take profit or stop losses, and the broker does not support fetching quotes to perform the calculation. Default is 0
qtyType (string) : Determines how the order quantity is calculated. Options: "fixed_quantity", "dollar_amount", "percent_of_equity", "percent_of_position".
qty (float) : Quantity value. Can represent units of shares/contracts or a dollar amount, depending on qtyType.
stopLoss (bool) : Enable or disable stop-loss functionality. Set to `true` to activate.
stopType (string) : Specifies the stop-loss calculation type. Options: percent, "amount", "stopPrice", "trailPercent", "trailAmount". Default is "stopPrice"
stopValue (float) : Stop-loss value based on stopType. Can be a percentage, dollar amount, or a specific stop price. Default is "stopPrice"
takeProfit (bool) : Enable or disable take-profit functionality. Set to `true` to activate.
profitType (string) : Specifies the take-profit calculation type. Options: "percent", "amount", "limitPrice". Default is "limitPrice"
profitValue (float) : Take-profit value based on profitType. Can be a percentage, dollar amount, or a specific limit price. Default is 0
timeInForce (string) : The time in force for your order. Options: day, gtc, opg, cls, ioc and fok
Returns: Return result in Json format.
addTsl(symbol, stopType, stopValue, price)
This method adds trailing stop loss to the current position. “Price” is the trailing stop loss starting level. You can leave price blank if you want it to start immediately
Parameters:
symbol (string)
stopType (string) : Specifies the trailing stoploss calculation type. Options: "trailPercent", "trailAmount".
stopValue (float) : Stop-loss value based on stopType. Can be a percentage, dollar amount.
price (float) : The trailing stop loss starting level. You can leave price blank if you want it to start immediately. Default is current price.
utilsLibrary "utils"
Few essentials captured together (subset of arrayutils)
timer(timeStart, timeEnd)
finds difference between two timestamps
Parameters:
timeStart (int) : start timestamp
timeEnd (int)
Returns:
method check_overflow(pivots, barArray, dir)
finds difference between two timestamps
Namespace types: array
Parameters:
pivots (array) : pivots array
barArray (array) : pivot bar array
dir (int) : direction for which overflow need to be checked
Returns: bool overflow
method get_trend_series(pivots, length, highLow, trend)
finds series of pivots in particular trend
Namespace types: array
Parameters:
pivots (array) : pivots array
length (int) : length for which trend series need to be checked
highLow (int) : filter pivot high or low
trend (int) : Uptrend or Downtrend
Returns: int trendIndexes
method get_trend_series(pivots, firstIndex, lastIndex)
finds series of pivots in particular trend
Namespace types: array
Parameters:
pivots (array) : pivots array
firstIndex (int) : First index of the series
lastIndex (int) : Last index of the series
Returns: int trendIndexes
getConsolidatedLabel(include, labels, separator)
Consolidates labels into single string by concatenating it with given separator
Parameters:
include (array) : array of conditions to include label or not
labels (array) : string array of labels
separator (string) : Separator for concatenating labels
Returns: string labelText
method getColors(theme)
gets array of colors based on theme
Namespace types: series Theme
Parameters:
theme (series Theme) : dark or light theme
Returns: color themeColors

yptestrsilibLibrary "RSIBackgroundLib"
RSI 배경색 라이브러리
rsi_background(_symbol, _timeframe)
RSI 계산 및 배경색 반환
Parameters:
_symbol (simple string) : string 심볼
_timeframe (simple string) : string 타임프레임
Returns: RSI, RSI MA, RSI MA10, 배경색
NumberOfVisibleBarsLibrary "NumberOfVisibleBars"
TODO: add library description here
NumberOfVisibleBars()
Calculates the number of visible bars on the user screen
Returns: The numbers of visible bars on the user screen (int)
Color Library // AlgoFyreAlgoFyre's Color Library is a Pine Script v5 library offering fire-themed palettes with light and dark modes. It helps traders easily integrate consistent, visually appealing color schemes into TradingView indicators. Used in AlgoFyre's Scripts and Indicators.
Color Overview
The AlgoFyreColorLibrary includes a comprehensive set of colors inspired by fire, ranging from light reds and oranges to dark browns and deep reds. The library is divided into two main themes:
Light Theme:
Includes lighter shades of red, orange, and brown, suitable for use on light backgrounds.
Dark Theme:
Includes darker shades of red, orange, and brown, suitable for use on dark backgrounds.
How to Use
To use the AlgoFyreColorLibrary in your Pine Script indicators and strategies, follow these steps:
Import the Library:
Import the AlgoFyreColorLibrary at the beginning of your script.
Call the getColor Function:
Use the getColor function to retrieve the desired color with the specified transparency.
Example
//@version=5
import "AF-L-0001" as af
// Example usage of getColor function
color primaryColor = af.getColor("af_primary1", 50)
color signalColor = af.getColor("af_green", 80)
// Plotting example
plot(close, color=primaryColor, linewidth=2, title="Primary Color Line")
plot(close, color=signalColor, linewidth=2, title="Signal Color Line")
The library AF-L-0001 is imported with the alias af.
The getColor function is used to get colors with specified transparency.
The colors are then used to plot lines on the chart.

ToClrToStrContains functions for conversion of color to string and vice versa:
method toClr( string this ) - converts string reperesentation of color (in hex format) to color
method toHex( color this ) - converts color to string (hex form)
method toRgb( color this ) - converts color to string ("rgb(11,11,11,0)" form)
Thanks to @ImmortalFreedom for his `color_tostring()` function from "RGB Color Fiddler"

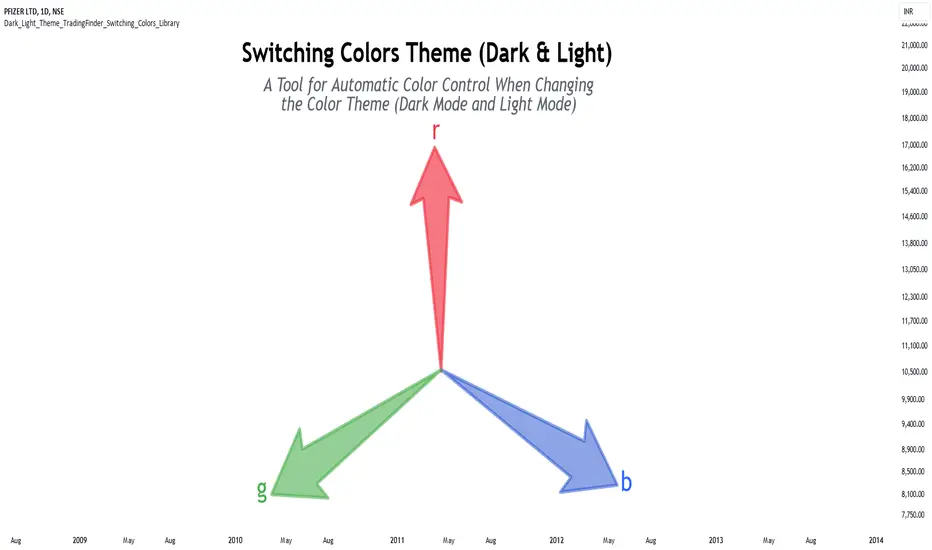
Dark & Light Theme [TradingFinder] Switching Colors Library🔵 Introduction
One of the challenges of script users is matching the colors used in indicators or strategies. By default, colors are chosen to display based on either the dark theme or the light theme.
In scripts with a large number of colors used, changing all colors to better display in dark mode or light mode can be a difficult and tedious process.
This library provides developers with the ability to adjust the colors used in their scripts based on the theme of the display.
🔵 Logic
To categorize the color spectrum, the range from 0 to 255 of all three main colors red, green and blue was divided into smaller ranges.
Blue color, which is more effective in darkening or lightening colors, is divided into 8 categories, red color into 5 categories, and green color into 3 categories, because it has little effect on darkening or brightening colors.
The combination of these categories creates 120 different modes for the color range, which leads to a more accurate identification of the color and its brightness, and helps to decide how to change it.
Except for these 120 modes, there are 2 other modes that are related to colors almost white or black, which makes a total of 122 modes.
🔵 How to Use
First, you can add the library to your code as shown in the example below.
import TFlab/Dark_Light_Theme_TradingFinder_Switching_Colors_Library/1 as SC
🟣 Parameters
SwitchingColorMode(Color, Mode) =>
Parameters:
Color (color)
Mode (string)
Color : In this parameter, enter the color you want to adjust based on light mode and dark mode.
Mode : Three modes "Off", "Light" and "Dark" are included in this parameter. "Light" mode is for color adjustment for use in "Light Mode".
"Dark" mode is for color adjustment for use in "Dark Mode" and "Off" mode turns off the color adjustment function and the input color to the function is the same as the output color.
🔵 Function Outputs
OriginalColor = input.color(color.red)
= SC.SwitchingColorMode(OriginalColor, Mode)
ChartUtilsLibrary "ChartUtils"
Library for chart utilities, including managing tables
initTable(rows, cols, bgcolor)
Initializes a table with specific dimensions and color
Parameters:
rows (int) : (int) Number of rows in the table
cols (int) : (int) Number of columns in the table
bgcolor (color) : (color) Background color of the table
Returns: (table) The initialized table
updateTable(tbl, is_price_below_avg, current_investment_USD, strategy_position_size, strategy_position_avg_price, strategy_openprofit, strategy_opentrades, isBullishRate, isBearishRate, mlRSIOverSold, mlRSIOverBought)
Updates the trading table
Parameters:
tbl (table) : (table) The table to update
is_price_below_avg (bool) : (bool) If the current price is below the average price
current_investment_USD (float) : (float) The current investment in USD
strategy_position_size (float) : (float) The size of the current position
strategy_position_avg_price (float) : (float) The average price of the current position
strategy_openprofit (float) : (float) The current open profit
strategy_opentrades (int) : (int) The number of open trades
isBullishRate (bool) : (bool) If the current rate is bullish
isBearishRate (bool) : (bool) If the current rate is bearish
mlRSIOverSold (bool) : (bool) If the ML RSI is oversold
mlRSIOverBought (bool) : (bool) If the ML RSI is overbought
updateTableNoPosition(tbl)
Updates the table when there is no position
Parameters:
tbl (table) : (table) The table to update

SessionBoxLibrary "SessionBox"
This library provides functions to manage and visualize session boxes and labels on chart. A session box is a visual representation of a trading session with properties like time, name, color and the ability to track the high and low price within that session.
SessionBox
SessionBox: stores session data and provides methods to manage that data and visualize it on the chart.
Fields:
session_time (series bool)
session_name (series string)
session_color (series color)

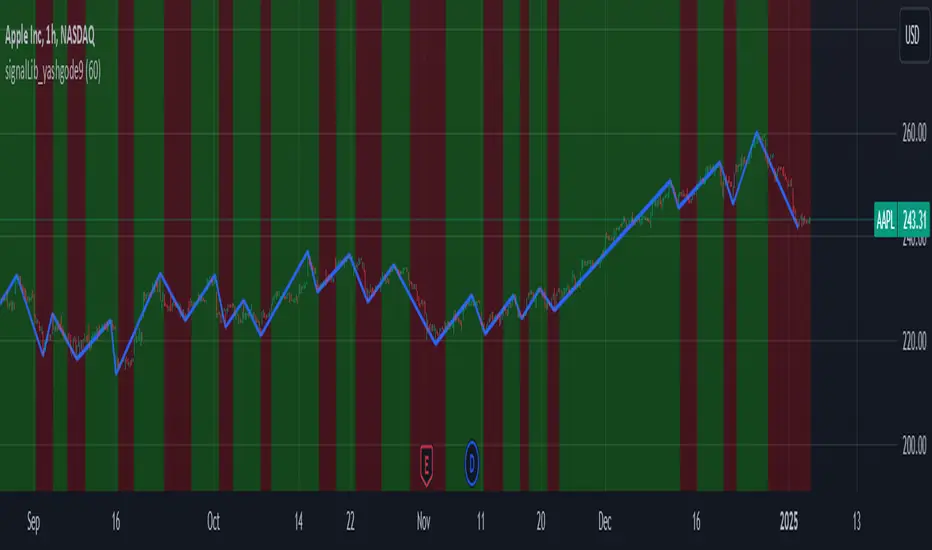
signalLib_yashgode9Signal Generation Library = "signalLib_yashgode9"
This library, named "signalLib_yashgode9", is designed to generate buy and sell signals based on the price action of a financial instrument. It utilizes various technical indicators and parameters to determine the market direction and provide actionable signals for traders.
Key Features:-
1.Trend Direction Identification: The library calculates the trend direction by comparing the number of bars since the highest and lowest prices within a specified depth. This allows the library to determine the overall market direction, whether it's bullish or bearish.
2.Dynamic Price Tracking: The library maintains two chart points, zee1 and zee2, which dynamically track the price levels based on the identified market direction. These points serve as reference levels for generating buy and sell signals.
3.Customizable Parameters: The library allows users to adjust several parameters, including the depth of the price analysis, the deviation threshold, and the number of bars to consider for the trend direction. This flexibility enables users to fine-tune the library's behavior to suit their trading strategies.
4.Visual Representation: The library provides a visual representation of the buy and sell signals by drawing a line between the zee1 and zee2 chart points. The line's color changes based on the identified market direction, with red indicating a bearish signal and green indicating a bullish signal.
Usage and Integration:
To use this library, you can call the "signalLib_yashgode9" function and pass in the necessary parameters, such as the lower and higher prices, the depth of the analysis, the deviation threshold, and the number of bars to consider for the trend direction. The function will return the direction of the market (1 for bullish, -1 for bearish), as well as the zee1 and zee2 chart points.You can then use these values to generate buy and sell signals in your trading strategy. For example, you could use the direction value to determine when to enter or exit a trade, and the zee1 and zee2 chart points to set stop-loss or take-profit levels.
Potential Use Cases:
This library can be particularly useful for traders who:
1.Trend-following Strategies: The library's ability to identify the market direction can be beneficial for traders who employ trend-following strategies, as it can help them identify the dominant trend and time their entries and exits accordingly.
2.Swing Trading: The dynamic price tracking provided by the zee1 and zee2 chart points can be useful for swing traders, who aim to capture medium-term price movements.
3.Automated Trading Systems: The library's functionality can be integrated into automated trading systems, allowing for the development of more sophisticated and rule-based trading strategies.
4.Educational Purposes: The library can also be used for educational purposes, as it provides a clear and concise way to demonstrate the application of technical analysis concepts in a trading context.
Important Notice:- This library effectively work on timeframe of 5-minute and 15-minute.
ColourUtilitiesLibrary "ColourUtilities"
Utility functions for colour manipulation
adjust_colour(rgb, desaturation_amount, transparency_amount)
to reduce saturation or increase transparency of an RGB colour
Parameters:
rgb (color)
desaturation_amount (float) : 0 means no desaturation (colours remains as-is), and 1 means full desaturation (colour turns grey). Can also be used inversely with negative numbers
transparency_amount (float) : How much more transparent the default transparency should become. E.g. with a value of 0.5, a transparency of 0 becomes 50 and 40 becomes 70. A value of 1 makes it fully transparent, en -1 fully opaque.
Returns: color with adjusted saturation and transparency
method apply_default_palette(self, palette_name)
Some nice looking colour palettes, consisting of 6 gradient colours, are already defined here and can be quickly applied to the Palette class
Namespace types: Palette
Parameters:
self (Palette)
palette_name (string) : Currently there are 4 6-coloured palettes available: "GYTS flux signal", "GYTS purple", "GYTS flux filter" and "GYTS maroon"
Returns: None, as it populates the Palette class with pre-defined colours
method get_colour(self, colour_no, transparency)
Retrieves colour from the palette and possibly changes transparency if set
Namespace types: Palette
Parameters:
self (Palette)
colour_no (int) : from the palette
transparency (int) : to possibly change the default transparency of the palette
Returns: colour
method get_dynamic_colour(self, x, mid_point, colour_lb, colour_ub, trend_lookback, use_rate)
Retrieves a colour based on strength and direction of the passed series
Namespace types: Palette
Parameters:
self (Palette)
x (float) : the input data series
mid_point (float) : value as a cutoff point where the bullish/bearish colour scenario
colour_lb (float) : value (lower bound) where to apply the bearish colour at full strength
colour_ub (float) : value (upper bound) where to apply the bullish colour at full strength
trend_lookback (int) : how much bars back to check if there was a consistent move into a certain direction, otherwise a the neutral colour from the centre of the palette will be used.
use_rate (bool) : whether to use the rate (proportional difference with previous `x` value) or the input series `x` directly
Returns: colour
Palette
Fields:
transparency (series__integer)
palette (array__color)

colorLabLibrary "colorLab"
The ColorLab library presents an essential solution for color optimization, leveraging color terms and philosophy. Through its capabilities, it furnishes the necessary versatility to attain optimal color representation and coherence by integrating functions.
tint_level(colour, level)
Determines a Tinted color
Parameters:
colour (color) : (series color) Pure color.
level (float) : (series float) Optional argument, default = 50. A level of tent color. 0 is entered color and 100 is white color.
Returns: (series color) A color Computed from a linear "Tint" gradient.
shade_level(colour, level)
Determines a Shaded color.
Parameters:
colour (color) : (series color) Pure color.
level (float) : (series float) Optional argument, default = 50. A level of tent color. 0 is entered color and 100 is Black color.
Returns: (series color) A color Computed from a linear "Shade" gradient.
tone_level(colour, level)
Determines a Tone color.
Parameters:
colour (color) : (series color) Pure color.
level (float) : (series float) Optional argument, default = 50. A level of tent color. 0 is entered color and 100 is Gray color.
Returns: (series color) A color Computed from a linear "Tone" gradient.
lightness_gradient(colour, value, bottom_value, top_value, bottom_lightness, top_lightness)
Determines a color from a "Lightness" gradient, based on the position of an entered value within a defined range.
Parameters:
colour (color) : (series color) Pure color.
value (float) : (series float) Value.
bottom_value (float) : (series float) Bottom Value.
top_value (float) : (series float) Top Value.
bottom_lightness (simple float) : (simple float) Optional argument, default = 70. Lightness Percentage. 100% is lightest and 0% is darkest
top_lightness (simple float) : (simple float) Optional argument, default = 30. Lightness Percentage. 100% is lightest and 0% is darkest
Returns: (series color) A color Computed a the linear "Lightness" gradient.
saturation_gradient(colour, value, bottom_value, top_value, bottom_saturated, top_saturated)
Determines a color from a "Saturation" gradient, based on the position of an entered value within a defined range.
Parameters:
colour (color) : (series color) Pure color.
value (float) : (series float) Value.
bottom_value (float) : (series float) Bottom Value.
top_value (float) : (series float) Top Value.
bottom_saturated (simple float) : (simple float) Optional argument, default = 15. Low Saturated Percentage.
top_saturated (simple float) : (simple float) Optional argument, default = 80. High Saturated Percentage.
Returns: (series color) A color Computed from a linear "Saturation" gradient.
hue_gradient(colour, value, bottom_value, top_value, bottom_hue, top_hue)
Determines a color from a "Hue" gradient, based on the position of an entered value within a defined range.
Parameters:
colour (color) : (series color) Pure color.
value (float) : (series float) Value.
bottom_value (float) : (series float) Bottom Value.
top_value (float) : (series float) Top Value.
bottom_hue (simple float) : (simple float) Optional argument, Default = 0. Low Hue is a degree where value in range 0 to 360 degrees.
top_hue (simple float) : (simple float) Optional argument, default = 300. High Hue is a degree where value in range 0 to 360 degrees.
Returns: (series color) A color Computed from a linear "Saturation" gradient.
opposColor(colour)
Generates the opposite color of inputted color.
Parameters:
colour (color) : (series color) Pure color.
Returns: (series color) An opposite color.
randColor(seed)
Generates a random color.
Parameters:
seed (simple int) : (simple int) Optional argument. With identifying seed, it will generate similar color sequence.
Returns: (series color) A random color.
bk_or_wh(colour, lightness)
Determines a white or back fits with an inputted color.
Parameters:
colour (color) : (series color) Pure color.
lightness (float) : (series float) Optional argument, default = 50. If the lightness percentage of inputted color is higher, the output is white; otherwise, it's black.
Returns: (series color) white or back color.
monochrome(colour, lightness, saturation)
Generates a monochromatic color scheme.
Parameters:
colour (color) : (series color) Pure color.
lightness (float) : (series float) Optional argument, default = NA. To custom Lightness percentage manually, 100% is lightest and 0% is darkest.
saturation (float) : (series float) Optional argument, default = NA. To custom Saturation percentage manually, 100% is highest and 0% is lowest saturated.
Returns: (tuple of two color series) .
complementary(colour)
Generates a complementary color scheme.
Parameters:
colour (color) : (series color) Pure color.
Returns: (tuple of two color series) .
analogous(colour)
Generates an analogous color scheme.
Parameters:
colour (color) : (series color) Pure color.
Returns: (tuple of three color series) .
triadic(colour)
Generates an Triadic color scheme.
Parameters:
colour (color) : (series color) Pure color.
Returns: (tuple of three color series) .
tetradic(colour)
Generates an Tetradic color scheme.
Parameters:
colour (color) : (series color) Main color.
Returns: (tuple of four color series) .
tst_scheme(colour, size, _type)
Generates an array of requested type (tint, shade, or tone) scheme colors.
Parameters:
colour (simple color) : (simple color) Pure color.
size (simple int) : (simple input) Number of elements in color array.
_type (simple string) : (simple string) Type of color scheme, possible input "tint", "shade", and "tone".
Returns: (simple array) An array contains elements of the requested type scheme colors.
lsh_scheme(colour, size, _type, topLevel, botLevel)
Generates an array of requested type (lightness, saturation or hue) scheme colors.
Parameters:
colour (simple color) : (simple color) Pure color.
size (simple int) : (simple input) Number of elements in color array.
_type (simple string) : (simple string) Type of color scheme, possible input "lightness", "saturation" and "hue".
topLevel (simple float) : (simple float) Optional argument, default = NA.
1. if "lightness", in a percentage where value in range 0 to 100, 100% lightest.
2. if "saturation", in a percentage where value in range 0 to 100, 100% highest saturated.
3. if "hue", in a degree where value in range 0 to 360 degrees.
botLevel (simple float) : (simple float) Optional argument, default = NA.
1. if "lightness", in a percentage where value in range 0 to 100, 0% darkest.
2. if "saturation", in a percentage where value in range 0 to 100, 0% lowest saturated.
3. if "hue", in a degree where value in range 0 to 360 degrees.
Returns: (simple array) An array contains elements of the requested type scheme colors.
display_color(colour, location)
Displays color including RGB and HSL.
Parameters:
colour (simple color) : (simple color) Pure color.
location (simple string) : (simple string) Optional argument, default = "top_right". cell location.
Returns: (simple table) A table cell contains RGB and HSL of entered color.
display_scheme(arrayColour, location)
Displays Scheme colors including RGB and HSL.
Parameters:
arrayColour (array)
location (simple string) : (simple string) Optional argument, default = "top_right". cell location.
Returns: (simple table) A table cells contain RGB and HSL of entered color.

utilsLibrary "utils"
Provides a set of utility functions for use in strategies or indicators.
colorGreen(opacity)
Parameters:
opacity (int)
colorRed(opacity)
Parameters:
opacity (int)
colorTeal(opacity)
Parameters:
opacity (int)
colorBlue(opacity)
Parameters:
opacity (int)
colorOrange(opacity)
Parameters:
opacity (int)
colorPurple(opacity)
Parameters:
opacity (int)
colorPink(opacity)
Parameters:
opacity (int)
colorYellow(opacity)
Parameters:
opacity (int)
colorWhite(opacity)
Parameters:
opacity (int)
colorBlack(opacity)
Parameters:
opacity (int)
trendChangingUp(emaShort, emaLong)
Signals when the trend is starting to change in a positive direction.
Parameters:
emaShort (float)
emaLong (float)
Returns: bool
trendChangingDown(emaShort, emaLong)
Signals when the trend is starting to change in a negative direction.
Parameters:
emaShort (float)
emaLong (float)
Returns: bool
percentChange(start, end)
Returns the percent change between a start number and end number. A positive change returns a positive value and vice versa.
Parameters:
start (float)
end (float)
Returns: float
percentOf(percent, n)
Returns the number that's the percentage of the provided value.
Parameters:
percent (float) : Use 0.2 for 20 percent, 0.35 for 35 percent, etc.
n (float) : The number to calculate the percentage of.
Returns: float
targetPriceByPercent(percent, n)
Parameters:
percent (float)
n (float)
hasNegativeSlope(start, end)
Parameters:
start (float)
end (float)
timeinrange(resolution, session, timezone)
Returns true when the current time is within a given session window. Note, the time is calculated in the "America/New_York" timezone.
Parameters:
resolution (simple string) : The time interval to use to start/end the background color. Use "1" for the coloring the background up to the minute.
session (simple string) : The session string to use to identify the time window. Example: "0930-1600:23456" means normal market hours on weekdays.
timezone (simple string)
Returns: series bool
barsSinceLastEntry()
Returns the number of bars since the last entry order.
Returns: series int
barsSinceLastExit()
Returns the number of bars since the last exit order.
Returns: series int
calcSlope(ln, lookback)
Calculates the slope of the provided line based on its x,y coordinates in the previous bar to the current bar.
Parameters:
ln (float)
lookback (int)
Returns: series float
openPL()
Returns slope of the line given the start and end x,y coordinates.
Returns: series float
hasConsecutiveNegativeCandles(lookbackInput)
Returns true if the number of consecutive red candles matches the provided count.
Parameters:
lookbackInput (int) : The amount of bars to look back to check for consecutive negative bars. Default = 1.
Returns: series bool
stdevPercent(stdev, price)
Returns the standard deviation as a percentage of price.
Parameters:
stdev (float) : The standard deviation value
price (float) : The current price of the target ticker.
Returns: series float
Material Design ColorsThis library provides a standard set of colors defined in Material Design 2.0.
🔵 API
Step 1: Import this library.
import algotraderdev/material/1
// remember to check the latest version of this library and replace the 1 above.
Step 2: Get the color you like. Check the source code or the screenshot above to see all the supported colors.
material.red()
Each color function (except for `black()` and `white()`) accepts an optional `variant` parameter. You can choose any of 50, 100, 200, 300, 400, 500, 600, 700, 800, and 900. By default, 500 is chosen if this parameter is not provided.