Multi-Timeframe Confluence IndicatorThe Multi-Timeframe Confluence Indicator strategically combines multiple timeframes with technical tools like EMA and RSI to provide robust, high-probability trading signals. This combination is grounded in the principles of technical analysis and market behavior, tailored for traders across all styles—whether intraday, swing, or positional.
1. The Power of Multi-Timeframe Confluence
Markets are influenced by participants operating on different time horizons:
• Intraday traders act on short-term price fluctuations.
• Swing traders focus on intermediate trends lasting days or weeks.
• Position traders aim to capture multi-month or long-term trends.
By aligning signals from a higher timeframe (macro trend) with a lower timeframe (micro trend), the indicator ensures that short-term entries are in harmony with the broader market direction. This multi-timeframe approach significantly reduces false signals caused by temporary market noise or counter-trend moves.
Example: A bullish trend on the daily chart (higher timeframe) combined with a bullish RSI and EMA alignment on the 15-minute chart (lower timeframe) provides a stronger confirmation than relying on the 15-minute chart alone.
2. Why EMA and RSI Are Essential
Each element of the indicator serves a unique role in ensuring accuracy and reliability:
• EMA (Exponential Moving Average):
• A dynamic trend filter that adjusts quickly to price changes.
• On the higher timeframe, it establishes the overall trend direction (e.g., bullish or bearish).
• On the lower timeframe, it identifies precise entry/exit zones within the trend.
• RSI (Relative Strength Index):
• Adds a momentum-based perspective, confirming whether a trend is backed by strong buying or selling pressure.
• Ensures that signals occur in areas of strength (RSI > 55 for bullish signals, RSI < 45 for bearish signals), filtering out weak or uncertain price movements.
By combining EMA (trend) and RSI (momentum), the indicator delivers confluence-based validation, where both trend and momentum align, making signals more reliable.
3. Cooldown Period for Signal Optimization
Trading in choppy or sideways markets often leads to overtrading and false signals. The cooldown period ensures that once a signal is generated, subsequent signals are suppressed for a defined number of bars. This prevents traders from entering low-probability trades during indecisive market phases, improving overall signal quality.
Example: After a bullish confluence signal, the cooldown period prevents a bearish signal from being triggered prematurely if the market enters a temporary retracement.
4. Use Cases Across Trading Styles
This indicator caters to various trading styles, each benefiting from the confluence of timeframes and technical elements:
• Intraday Trading:
• Use a 1-hour chart as the higher timeframe and a 5-minute chart as the lower timeframe.
• Benefit: Align intraday entries with the hourly trend for higher win rates.
• Swing Trading:
• Use a daily chart as the higher timeframe and a 1-hour chart as the lower timeframe.
• Benefit: Capture multi-day moves while avoiding counter-trend entries.
• Scalping:
• Use a 30-minute chart as the higher timeframe and a 1-minute chart as the lower timeframe.
• Benefit: Enhance scalping efficiency by ensuring short-term trades align with broader intraday trends.
• Position Trading:
• Use a weekly chart as the higher timeframe and a daily chart as the lower timeframe.
• Benefit: Time long-term entries more precisely, maximizing profit potential.
5. Robustness Through Customization
The indicator allows traders to customize:
• Timeframes for higher and lower analysis.
• EMA lengths for trend filtering.
• RSI settings for momentum confirmation.
• Cooldown periods to adapt to market volatility.
This flexibility ensures that the indicator can be tailored to suit individual trading preferences, market conditions, and asset classes, making it a comprehensive tool for any trading strategy.
Why This Mashup Stands Out
The Multi-Timeframe Confluence Indicator is more than a sum of its parts. It leverages:
• EMA’s ability to identify trends, combined with RSI’s insight into momentum, ensuring each signal is well-supported.
• A multi-timeframe perspective that incorporates both macro and micro trends, filtering out noise and improving reliability.
• A cooldown mechanism that prevents overtrading, a common pitfall for traders in volatile markets.
This integration results in a powerful, adaptable indicator that provides actionable, high-confidence signals, reducing uncertainty and enhancing trading performance across all styles.
Customtradingsystem

Multiple Instrument Automation ScreenerI have developed a Pine Script indicator on TradingView designed to demonstrate how to automate execution for ten instruments. This example utilizes a straightforward, Simple Moving Average (SMA) indicator. You can use it as a template, but use your indicator.
The indicator computes long/short signals based on the crossing of the SMA using the security function
It acts as a screener, presenting calculation results in an organized table format.
Utilizing the varip variable, the indicator sends alerts for multiple instruments sequentially rather than simultaneously.
For every generated signal, the indicator builds and sends a JSON execution command to a third-party tool, ensuring seamless integration and automation. You can use your own format.
Sent alerts look like this:
{"ticker": "DOGEBTC","action": "buy","price": "0.00000199","time": "1719754620658"}
Details and Limitations
Instrument Limit: The example is configured for ten instruments for simplicity. However, it can be expanded to handle up to 40 instruments.
Alert Rate Limit: There is a rate limit of 15 alerts in 3 minutes. Exceeding this limit may cause some alerts to be stopped. This can be managed by tracking the alert times and delaying some alerts, though this may affect the entry prices.
Timing of Signal Generation : The indicator processes signals at the bar close to the active instrument. Due to its computational complexity, there is a slight delay in collecting all records, potentially causing signals to reflect a few seconds before the bar closes. Care should be taken when executing based on these signals.
Disclaimer
Please remember that past performance may not be indicative of future results.
Due to various factors, including changing market conditions, the strategy may no longer perform as well as in historical backtesting.
This post and the script don’t provide any financial advice.

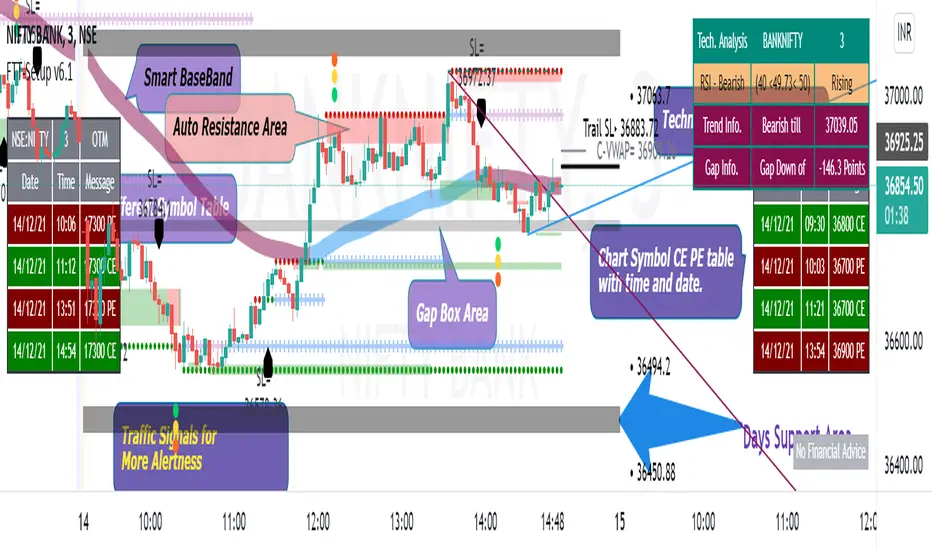
Fishing The Trend - SetupFishing The Trend - Setup
HOW Does it work ?
The name itself says we must have a trading setup for ease of trading for getting the most from the market.
i.e. Combining the most useful indicator under one roof...
Fishing The Trend - Setup have following ::-
1) IntraDay Range.
2) Four Friends.
3) Fishing The Trend.
4) Multi Time Frame - Custom VWAP.
5) RSI based SMA.
1) Intraday Range
HOW Does it work ?
For calculating the average most probable range for any plotted security, it plots 2 bands higher band and a lower band for a particular range using the default ADR. This indicator is on - as default.
# Upper and Lower band act as support and resistance , user may see a reversal in trend from these bands
# If the price breaks these bands, don't take a trade expecting a reversal
# These bands are calculated by averaging the previous x number of days' highs and lows of the security.
2) Four Friends
HOW Does it work ?
Plotting different EMA for finding the direction of Trend / Market, There are actually 5 EMAs- F1 = 20 EMA, F2 = 50 EMA, F3 = 100EMA, F4= 150, and Trend = 200-EMA. Usually 200 EMA is used to find the trend of market whether bearish / bullish, if market is above 200 ema than we may say its bullish and below 200 ema its bearish. The 50 EMA and 100 EMA works as best pullbacks in the trending market, user can configure as per his trading style and method. This indicator can be changed to multi timeframe as required. User can plot lower time frame data onto higher time or vice-versa for finding better opportunities for early trend detection, also the user have the option to use feature of non-repainting or vice versa. The default Color MA option is un=ticked, means plotting 5 different color EMAs, If the user ticks this feature, the whole 5 EMA color will change into red or orange as per direction of closing candle, user can change color as per his / her color combination. Default plotting time is of 1 min. This second indicator is off by default - user have to tick-it to activate it
3) Fishing The Trend
HOW Does it work ?
The code uses dynamic current levels to identify trend, This indicator is using SuperTrend, ATR and relatively Smoothened ATR for
early trend reversal detection to determine the trend and direction so that a fruitful decision can be made.
To Indicate the strength of the trendline, The standard calculations of SuperTrend, along with multiple smoothen ATR results are clubbed determine the direction, a step ahead. However, the indicator is not appropriate for all the situations. It works when the market is trending. Hence it is best to use for short-term technical analysis . SuperTrend uses only the two parameters of ATR and multiplier which are not sufficient under certain conditions to predict the accurate direction of the market. Here in this indicator ATR value is not editable and after long backtests the best ATR value is kept that helps the indicator working very well.
The default setting is best for use, but user can customize the Multiplier for his own fine tunings, So once the Levels are matched, a Long / Short suggestion is plotted. Best Time Frames to use : starting from 1, 3, 5, 15, 30 Mins and so on... to determine Trend.
Long = L and Short = S.
Where and how to use?
The main use of this indicator is quick scalping and Intra-day trading. The Indicator shows the option to show Long/Short Signals which the use can be turned on or off. The indicator shows a very useful option for early detection of the ongoing trend whether there will be reversal of trend or not ?
Stop Loss - That should be done by following ones risk appetite, Ideally the High of the Previous Candle should be the stop loss for
the Long / Short but everyone has their own Risk Management Strategies based on the capital deployed.
by default this comes on..
4) Multi Time Frame - Custom VWAP.
HOW Does it work ?
VWAP = The volume weighted average price (VWAP) is a trading benchmark used by traders that gives the average price a
security has traded at throughout the day, based on both volume and price. It is important because it provides traders with insight into both the trend and value of a security.
This indicator is programmed for using vwap for spot indices / securities not having volume calculations but have futures, specially banknifty and nifty of Indian markets. User has option to change the plotting timeframe as per his requirements for checking the trend under vwap or over vwap. The user have to type the equivalent script symbol in the space provided to calculate the vwap of that particular security and plot on the non-volume script. Seems confusing !!!! have a look
at example..
eg. - if you have chart of banknifty spot and u want to place vwap on in then just write security name in the blank field banknifty future of continuous contract running month " BANKNIFTY1! " Futures Chart... that's it and u will have futures vwap plotting on spot chart... this can give user a definite idea about the vwap line. User have option to change color of bar and change color of the
vwap line which is plotted.
By default this comes off..
Note = This indicator changes bar color
5) RSI based SMA
HOW Does it work ?
# This indicator is for user using RSI, The twist is that not only it uses RSI but also simple moving average, So this makes the user more safe as it is a combination of RSI and SMA.
# Multi-colored ----> Green/Red/Yellow user can change ..moving average of choice
# user can change overbought / over sold values of RSI as required. The time frame here is fixed.
* There is an On/Off Option for each Indicator.
Disclaimer : There could be scenarios when the candle is shown as a long or short and then the candle turns into opposite direction red/green. In such scenarios , Please refer to the just preceding candle and the early detection signal and if this candle is moving into positive direction only then go for long, Similarly opposite for Short, the value of multiplier 1.0 is determined using series of back test across various assets with different time frames.
User Options : Choice of turning on / off the Long / Short Labels and early detection/StopLoss Option can also be activated or deactivated.
Visual Checks - The user could manually validate the back test results on various assets they would like to use this strategy on before putting it live.
Usage/Markets : Index Trading / Equities and also well with Commodities and Currencies
How to get access
Please click on the link / email available in the signature or send me a private message to get access.
Feedback
Please click on the link/email in the signature or send me a private message for suggestions/feedbacks.
Entry FactorFind the most relevant price direction changes with ease, with this geometry-based indicator.
Stop wasting your time with moves that don't offer a satisfactory range for good profits.

Predictive channelsWith this powerful and simple indicator, you can easily see where the micro-trend is moving and also find the best entry and exit points for your strategies with one look.
It has 5 behavior options from aggressive to ultra-conservative. It's plug and play, it's really that easy.

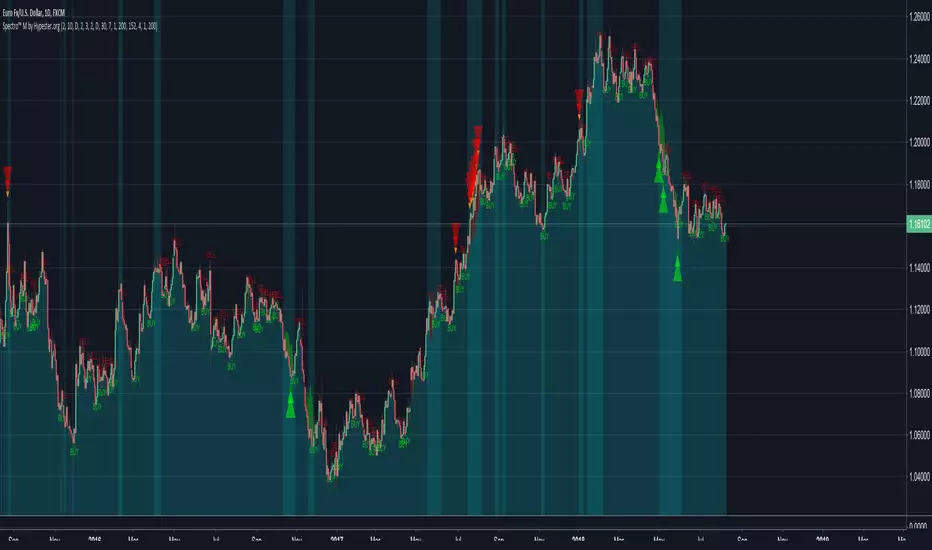
Spectro™ M3 by Hypester [Beta Testing]Hang in there guys! Time to debug, config the new alarms, improve the coloring, and other small fixes.
Spectro is easier and stronger than ever.
Extraordinarily flexible and adjustable to ANY trading style.

Spectro™ O by HypesterAre you ready for Hypester's leading technology, the Spectro™ Algorithm?
Many people ask what indicators Spectro™ uses, as a matter of fact, it doesn’t use any. Long story short, we used neural network techniques to find patterns studying previous successful movements, and from that, we extracted a formula that has been working out like a charm!
It's the brain of our big success Spectro™ M indicator, but now we turned it into an oscillator with MANY options so you can trade anything at any timeframe, no matter what trading style you follow while executing your trades.
The brand new Spectro™ Oscillator offers five types of data processing so you can change its behavior to fit your needs best. From scalping to positions that could last months.
Symmetric Weight
True Strength
Normalized
Pure
Volume Based
Also, we offer four types for pivotal leveling, so you can easily find tops, bottoms and trend reversals.
Murrey
BB Fibonacci
Classic
Fibonacci
It's simple. It's powerful. It's flexible.
Trade with Spectro™ and dramatically boost your profits!

TB!G-Scalp Strategy [Alert]Scalping Crypto Assets Made Easy
TB!G-Scalp is a TradingView based alert and accompanying strategy PineV3 Script.
Backtest vs Realtime
When designing the algorithms for this strategy our focus was primarily on ease of use.This results in a beautiful yet easy to use scalping strategy. As input it takes a chart period and only one extra parameter for fine tuning. The backtest results are an accurate representation of it’s real-time behaviour.
What makes it tick?
Over the last 2 years we collected a lot of market data regarding Bull and Bear behaviours. This previous market behaviour echo’s into the current market trend.
By recognising these echo’s we are able to anticipate an upcoming micro reversal which eventually end up being a scalping strategy.
Interested
Access is provided to a limited amount of people and for the duration that is determined by it’s Alpha Decay Rate.
This ADR is expected to become problematic after 2.3 year of usage on a lot of 150 users.

Spectro™ ScreenerNow Spectro™ technology helps you find and trade several assets with one look.
08/08/18 - Beta test v1 is published