Supertrend Long-Only Strategy for QQQThis strategy is meant to use Micro Momentum to give good Buy and Sell signals in trending markets
Cycles

ALFA ATC LondonThis indicator is a data indicator focused on the algorithmic opening prices of stock exchanges and shows these areas. Bias can be obtained from these areas. Trades can be executed by taking advantage of the price's ability to test and hold these areas. The indicator, AS ATC5, includes opening information for the CM New York, London, Frankfurt, and Tokyo stock exchanges. This indicator is designed solely for London and Frankfurt.

Weekly % Change Screener (5% Sell Threshold)This is a weekly screener for a 5% change in the stock value. If it increases by 5%, we sell and if it decreases by 5% we buy the stock. Good for stable high value stocks. Buy before testing.
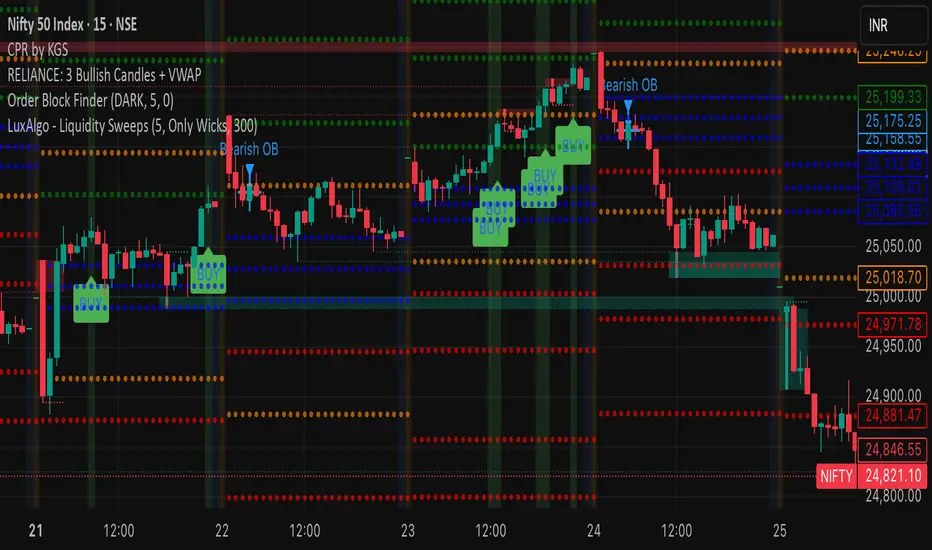
RELIANCE: 3 Bullish Candles + VWAPIts a script to track 3 consecutive candles of any stock. This helps understand the trends and makes up for buy signals. Please test before buying.
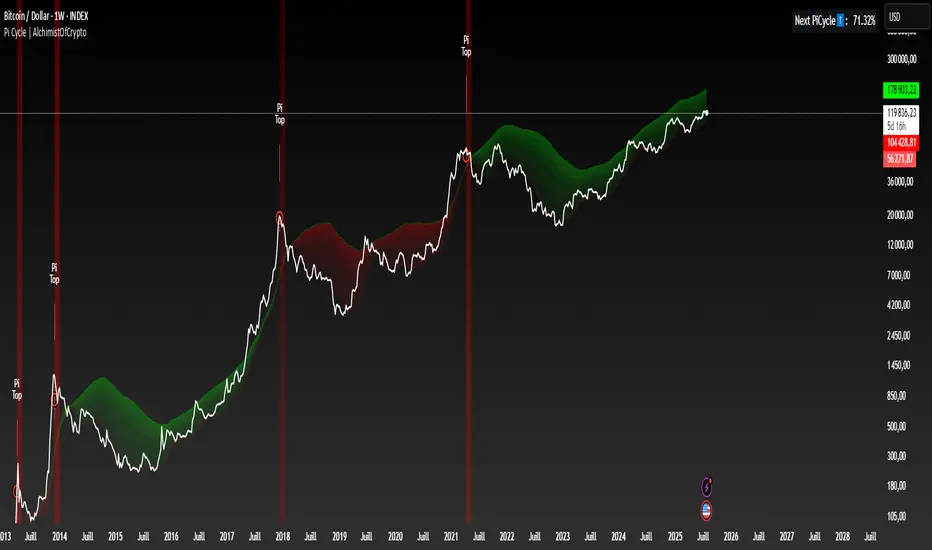
Pi Cycle | AlchimistOfCryptoPi Cycle Top Indicator - A Powerful Market Phase Detector
Developed by AlchimistOfCrypto
🧪 The Pi Cycle uses mathematical harmony to identify Bitcoin market cycle tops
with remarkable precision. Just as elements react at specific temperatures,
Bitcoin price behaves predictably when these two moving averages converge! 🧬
⚗️ The formula measures when the 111-day SMA crosses below the 350-day SMA × 2,
creating a perfect alchemical reaction that has successfully identified the
major cycle tops in 2013, 2017, and 2021.
🔬 Like the Golden Ratio in nature, this indicator reveals the hidden
mathematical structure within Bitcoin's chaotic price movements.
🧮 When the reaction occurs, prepare for molecular breakdown! 🔥
ZFT ClassicThis is the classic ZFT MAs that can be used by ZFT students to determine if a chart is in an uptrend, downtrend, or sideways movement within a short, medium, or long term timeframe.

Zeefreaks Predator Mask CryptoMade by Zeefreaks, for his dear students so when they see a chart, they can easily identify if it is a buy or sell within a minute.

Divergence Indicator with Multi-Length Pivot DetectionThis Pine Script, titled “Divergence Indicator with Multi-Length Pivot Detection”, tool that detects both regular and hidden divergences between price action and an oscillator (defaulting to close, but configurable). It features multi-length pivot logic, angle-based validation, no-cross filtering, and OB/OS region filtering, making it a robust and precise divergence engine. Below is a detailed breakdown:
⸻
🔧 Inputs and Configuration
• osc_src: Oscillator source (e.g. close, RSI, MACD).
• show_hidden: Toggles detection of hidden divergences.
• min_*_angle settings: Control the minimum angle thresholds (in degrees) for confirming valid divergences (ensures momentum is strong enough).
• validate_no_cross: Ensures oscillator and price slopes don’t “cross” the actual values (i.e. filters out invalid or messy trends).
• oversold_level, overbought_level: Used when use_ob_os_filter is enabled to require oscillator to be in OS/OB zones for regular divergence.
• min_div_length: Minimum distance in bars between previous and current pivot points.
⸻
🔁 Internal Engine Mechanics
1. Pivot Detection Engine (Phase 1: Historical Memory)
• For all combinations of left1 and right1 in the range :
• Records all valid pivot lows and pivot highs.
• Stores their:
• bar index
• price value
• oscillator value
This forms a “memory buffer” of past pivots that future price pivots are compared against.
2. Current Pivot Detection (Phase 2: Scanning)
• Loops through larger pivot configurations (left2 ∈ , right2 = 1) to detect new current pivots.
• For each new pivot, it compares against the historical pivots from phase 1.
⸻
📐 Slope and Angle Calculation
For each matching pivot pair (historical vs current):
• Price and Oscillator Slopes are calculated via linear regression, producing:
• price_angle
• osc_angle
• These are converted using math.atan() and math.todegrees() to get proper angular direction and intensity of trend.
⸻
🧠 Divergence Logic
✅ Bullish Divergence
• Regular Bullish: Price makes a lower low, oscillator makes a higher low.
• Hidden Bullish: Price makes a higher low, oscillator makes a lower low.
• Conditions:
• Must meet minimum angle thresholds.
• Optional: Must be in oversold region (osc_src < oversold_level).
• If validate_no_cross is enabled, linearly interpolated slope must not be violated.
✅ Bearish Divergence
• Regular Bearish: Price makes a higher high, oscillator makes a lower high.
• Hidden Bearish: Price makes a lower high, oscillator makes a higher high.
• Conditions mirror the bullish case (with polarity reversed).
⸻
🖍️ Visualization
• Draws colored lines between pivots for visual clarity:
• Green: Regular Bullish
• Lime: Hidden Bullish
• Red: Regular Bearish
• Maroon: Hidden Bearish
• Uses plotshape() to mark divergence bars:
• Triangle-up for bullish
• Triangle-down for bearish
The lines and shapes help quickly identify divergence zones with strong momentum structure.
⸻
🧪 Filtering Enhancements
• No Cross Slope Filter: Checks that oscillator and price values stay above/below their respective slope lines throughout the interval.
• OB/OS Filter: Restricts divergence signals to occur only in oversold/overbought conditions for regular divergences.
• Signal Thinning: Keeps line count to 100 using array.shift() and line.delete().
⸻
🧬 Design Philosophy
• Built to mimic institutional-grade divergence detection, avoiding common false positives.
• Uses adaptive pivots, rigorous angle validation, and noise filtering.

ADR Tracker Version 2Description
The **ADR Tracker** plots a customizable panel on your chart that monitors the Average Daily Range (ADR) and shows how today’s price action compares to that average. It calculates the daily high–low range for each of the past 14 days (can be adjusted) and then takes a simple moving average of those ranges to determine the ADR.
**Features:**
* **Current ADR value:** Shows the 14‑day ADR in price units.
* **ADR status:** Indicates whether today’s range has reached or exceeded the ADR.
* **Ticks remaining:** Calculates how many minimum price ticks remain before the ADR would be met.
* **Real‑time tracking:** Monitors the intraday high and low to update the range continuously.
* **Customizable panel:** Uses TradingView’s table object to display the information. You can set the table’s horizontal and vertical position (top/middle/bottom and left/centre/right) with inputs. The script also lets you change the text and background colours, as well as the width and height of each row. Table cells use explicit width and height percentages, which Pine supports in v6. Each call to `table.cell()` defines the text, colours and dimensions for its cell, so the panel resizes automatically based on your settings.
**Usage:**
Apply the indicator to any chart. For the most accurate real‑time tracking, use it on intraday timeframes (e.g. 5‑min or 1‑hour) so the current day’s range updates as new bars arrive. Adjust the inputs in the settings panel to reposition the list or change its appearance.
---
This description explains what the indicator does and highlights its customizable table display, referencing the Pine Script table features used.

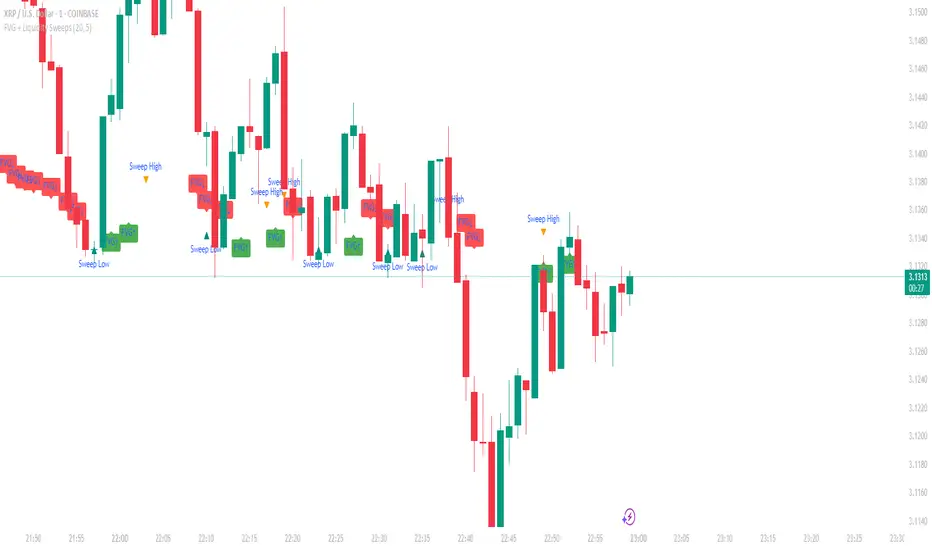
FVG + Liquidity Sweepsthis is a test and i don't know if it is gonna actually work but let me know if it does.
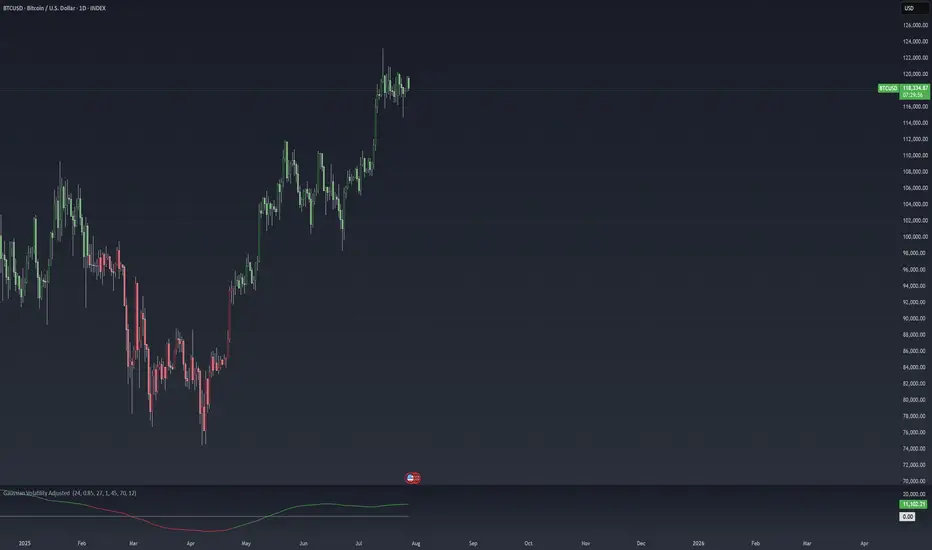
Gaussian Volatility Adjusted Gaussian Volatility Adjusted Indicator
The Gaussian Volatility Adjusted indicator is a powerful tool designed to identify trend direction and momentum by combining a Gaussian-filtered moving average with volatility-based thresholds. By smoothing price data with a Gaussian filter and adjusting for market volatility using Average True Range (ATR) and Standard Deviation (SD), this indicator generates clear bullish and bearish signals. The Exponential Moving Average (EMA) of the momentum difference and price bars are dynamically colored to highlight trend strength, making it easier for traders to identify potential entry and exit points in various market conditions.
How It Works
Gaussian Filter Calculations
Gaussian Filter: Applies a Gaussian smoothing filter to a user-defined price source, typically an EMA of the closing price, over a configurable length (default: 70) with a specified sigma (default: 12). The Gaussian filter uses a weighted sum based on a Gaussian distribution to reduce noise while preserving significant price trends. Weights are calculated using the Gaussian formula and normalized to ensure accurate smoothing.
Base Moving Average: Optionally applies an EMA (default: enabled, length: 45) to the closing price before Gaussian filtering, providing a smoother input for the Gaussian calculation to enhance signal reliability.
Volatility Adjustments
ATR-Based Bands: Calculates the Average True Range (ATR) over a user-defined period (default: 24), scaled by a sensitivity factor (default: 1) and an ATR factor (default: 0.85). These form volatility-adjusted bands around the Gaussian-filtered value:
Upper Band: Gaussian value + (ATR × ATR Factor).
Lower Band: Gaussian value - (ATR × ATR Factor).
Standard Deviation Bands: Computes the Standard Deviation (SD) of the closing price over a user-defined period (default: 27), scaled by the sensitivity factor. These form additional bands:
Upper SD Band: Gaussian value + SD.
Lower SD Band: Gaussian value - SD.
Trend and Momentum SignalsTrend
Detection:Bullish Trend: Triggered when the closing price exceeds the upper SD band, setting the trend to +1.
Bearish Trend: Triggered when the closing price falls below the upper ATR-based band, setting the trend to -1.
Momentum Calculation: Computes a momentum difference (Diff) based on the trend:
For a bullish trend (+1), Diff = Close - Upper ATR Band.
For a bearish trend (-1), Diff = Close - (Gaussian + SD).
EMA of Momentum: Applies an EMA (default length: 45) to the momentum difference to smooth the momentum signal.
Final Trend with EMA Confluences:
If EMA confluence is enabled (default: true), a bullish signal (+1) is confirmed when the trend is +1 and Diff exceeds the EMA of Diff. A bearish signal (-1) is confirmed when the trend is -1 and Diff is below the EMA of Diff.
If EMA confluence is disabled, the final trend follows the initial trend direction (±1).
Visual Representation
The indicator provides a clear and intuitive visual interface:
EMA Line: Plots the EMA of the momentum difference, colored based on the final trend:
Green: Bullish trend (Final_Trend = +1).
Red: Bearish trend (Final_Trend = -1).
Gray: Neutral or no trend.
Zero Line: A dashed line at zero (semi-transparent) serves as a reference for the EMA plot.
Bar Coloring: Price bars are colored to reflect the trend:
Green: Bullish trend (Final_Trend = +1).
Red: Bearish trend (Final_Trend = -1).
No Color: Neutral or no trend.
Volatility Bands: While not plotted in the provided script, the ATR and SD bands are calculated and could be plotted for additional context, marking key levels for trend detection.
Customization & Parameters
The Gaussian Volatility Adjusted indicator offers flexible parameters to suit various trading styles:
Volatility Parameters:
ATR Length: Period for ATR calculation (default: 24).
ATR Factor: Multiplier for ATR-based bands (default: 0.85).
SD Length: Period for Standard Deviation calculation (default: 27).
Sensitivity: Scales ATR and SD for band sensitivity (default: 1).
Moving Average Parameters:
Use EMA Confluence: Enable/disable EMA confluence for trend confirmation (default: true).
EMA Length: Period for EMA calculations (default: 45).
Gaussian Parameter:
Gaussian Length: Period for Gaussian filter (default: 70).
Sigma: Controls the Gaussian filter’s smoothness (default: 12).
Color Settings: EMA line and bars use green for bullish signals, red for bearish signals, and gray for neutral states, with customizable transparency for the zero line.
Trading Applications
This indicator is versatile and can be applied across various markets and strategies:
Trend Following:
Use the final trend signals and bar coloring to identify and follow bullish or bearish trends, with the Gaussian filter reducing noise for clearer trend detection.
Momentum Trading: The EMA of the momentum difference highlights strong momentum shifts, ideal for entering or exiting trades based on trend strength.
Reversal Detection: Monitor price crossings of the ATR and SD bands to identify potential trend reversals, especially when confirmed by the EMA confluence.
Scalping and Swing Trading: Adjust parameters (e.g., ATR length, Gaussian length, or sensitivity) to suit short-term scalping or longer-term swing trading strategies.
Final Note
The Gaussian Volatility Adjusted indicator is a robust tool for traders seeking to leverage smoothed price data and volatility-adjusted thresholds for trend and momentum analysis. Its combination of Gaussian filtering, ATR and SD-based bands, and EMA confluence provides a comprehensive framework for identifying trading opportunities. The dynamic coloring of the EMA line and price bars enhances visual clarity, making it easier to act on signals. As with all indicators, backtest thoroughly and integrate into a comprehensive trading strategy for optimal results.
Kalman VWMA For LoopKalman VWMA For Loop Indicator
The Kalman VWMA For Loop indicator is a sophisticated tool designed to smooth price data using a Kalman filter applied to a Volume Weighted Moving Average (VWMA). By combining the VWMA’s volume-weighted price sensitivity with the adaptive noise reduction of a Kalman filter, this indicator provides traders with a robust momentum and trend-following signal. The indicator includes a customizable for-loop mechanism to potentially iterate over a range of calculations or parameters, enhancing flexibility for advanced trading strategies. Visual outputs are plotted to help traders identify trends and potential trading opportunities with reduced noise.
How It Works
VWMA Calculations
Volume Weighted Moving Average (VWMA): Computes a VWMA based on a user-selected price source (default: Close) over a configurable period (default: 14). The VWMA weights price data by trading volume, providing a more accurate representation of market activity compared to a simple moving average.
Kalman Filter Calculation
Kalman Filter: Applies a Kalman filter to the price source to smooth price movements and reduce noise.
The filter uses:
Process Noise: Controls the adaptability of the filter to price changes (default: 0.01).
Measurement Noise: Adjusts sensitivity to price fluctuations (default: 3).
Filter Order (N): Defines the number of states in the Kalman filter (default: 3), allowing for multi-state modeling of price dynamics.
The Kalman filter iteratively predicts and updates the price estimate using state estimates and error covariances stored in arrays. This process minimizes noise while preserving significant price trends.
For-Loop Mechanism
The script includes a for-loop structure with user-defined parameters (from and to_, defaulting to 1 and 25, respectively). While the provided code does not fully implement the for-loop’s functionality, it is intended to allow iterative calculations or parameter sweeps, such as testing multiple periods or thresholds within the specified range. This feature enhances the indicator’s flexibility for optimization or multi-scenario analysis.
Visual Representations
The indicator plots the VWMA as a red line on the chart, providing a clear visual reference for the volume-weighted trend.
The Kalman-filtered price is calculated but not plotted in the provided code. When plotted, it would appear as a smoothed price line, highlighting the underlying trend with reduced noise.
The for-loop parameters suggest potential for additional visual outputs (e.g., multiple VWMA lines or signals) if fully implemented, but the current script only plots the VWMA.
Customization & Parameters
The Kalman VWMA For Loop indicator offers flexible parameters to suit various trading styles:
Moving Average Parameters:
Price Source: Select the input price (default: Close; options: Close, High, Low, Open).
MA Period: Adjust the VWMA calculation period (default: 14).
Kalman Parameters:
Process Noise: Adjusts the filter’s adaptability to price changes (default: 0.01).
Measurement Noise: Controls sensitivity to price fluctuations (default: 3).
Filter Order (N): Sets the number of states for the Kalman filter (default: 3).
For-Loop Parameters:
From: Starting value for the for-loop (default: 1).
To: Ending value for the for-loop (default: 25).
Color Settings: The VWMA is plotted in red, with potential for additional customizable colors if the for-loop is expanded to plot multiple outputs.
Trading Applications
This indicator is versatile and can be applied across various markets and strategies:
Trend Following:
Use the Kalman-filtered price and VWMA to identify the direction and strength of trends, with the smoothed output reducing false signals in volatile markets.
Momentum Trading: The VWMA highlights volume-driven price movements, allowing traders to enter or exit based on momentum shifts.
Parameter Optimization: The for-loop structure (if fully implemented) enables testing multiple VWMA periods or Kalman parameters, aiding in strategy optimization.
Scalping and Swing Trading: Adjust the MA period and Kalman parameters to suit short-term (scalping) or longer-term (swing trading) strategies.
Final Note
The Kalman VWMA For Loop indicator is a powerful tool for traders seeking to combine volume-weighted price analysis with advanced noise reduction via a Kalman filter. Its customizable parameters and potential for iterative calculations through the for-loop make it adaptable to various trading styles. While the for-loop functionality is not fully implemented in the provided code, completing it could enable dynamic parameter testing or signal generation. As with all indicators, backtest thoroughly and integrate into a comprehensive trading strategy for optimal results.

Super-Elliptic BandsThe core of the "Super-Elliptic Bands" indicator lies in its use of a super-ellipse mathematical model to create dynamic price bands around a central Simple Moving Average (SMA). Here's a concise breakdown of its essential components:
Central Moving Average (MA):
A Simple Moving Average (ta.sma(close, maLen)) serves as the baseline, anchoring the bands to the average price over a user-defined period (default: 50 bars).
Super-Ellipse Formula:
The bands are generated using the super-ellipse equation: |y/b| = (1 - |x/a|^p)^(1/p), where:
x is a normalized bar index based on a user-defined cycle period (periodBase, default: 64), scaled to range from -1 to +1.
a = 1 (fixed semi-major axis).
b is the volatility-based semi-minor axis, calculated as volRaw * mult, where volRaw comes from ta.stdev, ta.atr, or ta.tr (user-selectable).
p (shapeP, default: 2.0) controls the band shape:
p = 2: Elliptical bands.
p < 2: Pointier, diamond-like shapes.
p > 2: Flatter, rectangular-like shapes.
This formula creates bands that dynamically adjust their width and shape based on price volatility and a cyclical component.
enjoy....

Flexi MA Heat ZonesOverview
Flexi MA Heat Zones is a powerful multi-timeframe visualization tool that helps traders easily identify trend strength, direction, and potential zones of confluence using multiple moving averages and dynamic heatmaps. The indicator plots up to three pairs of customizable moving averages, with color-coded heat zones to highlight bullish and bearish conditions at a glance.
Whether you're a trend follower, mean-reversion trader, or looking for visual confirmation zones, this indicator is designed to offer deep insights with high customizability.
⚙️ Key Features
🔄 Supports multiple MA types: Choose from EMA, SMA, WMA, VWMA to suit your strategy.
🎯 Six moving averages: Three MA pairs (MA1-MA2, MA3-MA4, MA5-MA6), each with independent lengths and colors.
🌈 Heatmap Zones: Dynamic fills between MA pairs, changing color based on bullish or bearish alignment.
👁️🗨️ Full customization: Enable/disable any MA pair and its heatmap zone from the settings.
🪞 Transparency controls: Adjust the visibility of heat zones for clarity or stylistic preference.
🎨 Color-coded for clarity: Bullish and bearish colors for each heat zone pair, fully user-configurable.
🧩 Efficient layout: Smart use of grouped inputs for easier configuration and visibility management.
📈 How to Use
Use the MA1–MA2 and MA3–MA4 zones for longer-term trend tracking and confluence analysis.
Use the faster MA5–MA6 zone for short-term micro-trend identification or scalping.
When a faster MA is above the slower one within a pair, the fill turns bullish (user-defined color).
When the faster MA is below the slower one, the fill turns bearish.
Combine with price action or other indicators for entry/exit confirmation.
🧠 Pro Tips
For trend-following strategies, consider using EMA or WMA types.
For mean-reversion or support/resistance zones, SMA and VWMA may offer better zone clarity.
Overlay with RSI, MACD, or custom entry signals for higher confidence setups.
Use different heatmap transparencies to visually separate overlapping MA zones.

Volume vs Volatility Trend Signal1 is increasing volume decreasing volatility -1 is decreasing volume increasing volatility 0 is neither

ATR as % of CloseATR 14day period in % terms
the Normal ATR indicator by TV helps but this gives a clear idea as to the range in percentage terms as and when market rises to newer and newer highs
better than an absolute value

PHL Sweep Signals(1 Hour)PHL Sweep Signals (Full History)
This indicator is designed to identify high-probability reversal setups by detecting liquidity sweeps of the previous standard hour's high and low (PHL). It provides clear, actionable signals complete with visual aids and a data table to keep you in tune with the higher-timeframe context.
Key Features
Previous Hour Levels: Automatically draws the high and low of the previous standard hour as key reference lines for the current trading hour. The line colors rotate to provide a clear visual separation.
Bearish Sweep Signal: Identifies a specific bearish pattern: a green (bullish) candle that wicks above the previous hour's high but fails to hold, with its body remaining entirely below the line.
Bullish Sweep Signal: Identifies the opposite bullish pattern: a red (bearish) candle that wicks below the previous hour's low but is absorbed, with its body remaining entirely above the line.
Clear Visual Signals: When a signal is confirmed, the indicator provides a multi-faceted alert:
Plots a "Buy" or "Sell" arrow on the chart.
Draws a colored box around the signal candle for easy identification.
Displays a label with the potential Stop Loss size (calculated from the size of the signal candle).
Informative Display Table: Includes a convenient table in the corner showing the Open and Close data for the last 3 hours, helping you stay aware of the broader market context without leaving your chart.
Built-in Alerts: Triggers an alert for every confirmed Buy and Sell signal so you never miss a potential setup.
How to Use
This indicator helps you spot potential exhaustion and reversals at key hourly levels.
A "Sell" signal suggests a failed breakout to the upside, indicating potential weakness and a possible entry for shorts.
A "Buy" signal suggests a failed breakdown to the downside, indicating potential strength and a possible entry for longs.
As with any tool, these signals are most powerful when used as part of a comprehensive trading strategy and combined with your own analysis for confirmation.
Optimal Settings:
Timeframe: 5-Minute
Time Zone: UTC-4 (New York Time)
-ratheeshinv

多维度市场分析指标 v2 (区间框选)使用大周期MACD的能量柱作为背景用于识别趋势并且搭配上伦敦和纽约交易session
we are using a high time frame macd momentum as chart background to analysis a trend and using london and newyork session to help you trade better

BB + RSI Strategy Optimized✅ Pine Script Version 5
✅ Complete Strategy: Long + Short
✅ Automatic Entry and Exit
✅ Visual Signals: Buy/Sell, Short/Cover
✅ Trailing Take Profit
✅ Progressive

Trigonometric Sine Cosine WavesTrigonometric Sine Cosine Waves - Advanced Cyclical Analysis
Overview
This innovative indicator applies trigonometric mathematics to market analysis, generating dynamic sine and cosine waves that adapt to price movement and volatility. Unlike traditional oscillators, this tool visualizes market cycles directly on your chart using mathematical wave functions.
How It Works
The indicator calculates phase-based waves using:
• Phase Calculation: 2π × bar_index / cycle_length
• Adaptive Amplitude: EMA-based price + ATR volatility scaling
• Sine Wave: avgPrice + volatility × sin(phase)
• Cosine Wave: avgPrice + volatility × cos(phase)
Key Features
Dynamic Wave Generation
• Sine Wave: Primary cycle indicator with smooth transitions
• Cosine Wave: Leading indicator (90° phase difference from sine)
• Adaptive Amplitude: Automatically adjusts to market volatility using ATR
Turning Point Detection
• Anti-Repaint Signals: Uses confirmed values from previous bars
• Sine Bottom: Potential buy zones when wave transitions from down to up
• Sine Top: Potential sell zones when wave transitions from up to down
Advanced Analytics
• Price Correlation Angle: Shows relationship between price movement and cycle
• Phase Information: Current position in the mathematical cycle
• Real-time Values: Live sine/cosine values and phase degrees
Visual Enhancement
• Background Coloring: Changes based on sine wave position (above/below zero)
• Clean Overlay: Waves plot directly on price chart without cluttering
Parameters
• Cycle Length (5-200): Controls wave frequency - shorter = more sensitive
• Amplitude Multiplier (0.1-5.0): Adjusts wave height relative to volatility
• Display Options : Toggle sine wave, cosine wave, and correlation table
• Show Correlation : Optional table showing mathematical values
Trading Applications
Cycle Analysis
• Identify market rhythm and timing
• Spot potential reversal zones
• Understand price-to-cycle relationships
Entry/Exit Timing
• Buy Signals: Sine wave bottoms (cycle lows)
• Sell Signals: Sine wave tops (cycle highs)
• Confirmation: Use with other indicators for higher probability setups
Market Structure
• Visualize underlying market cycles
• Identify periods of high/low cyclical activity
• Track phase relationships between price and mathematical cycles
Pro Tips
1. Longer cycles (50-100) work better for swing trading
2. Shorter cycles (10-20) suitable for scalping
3. Combine with volume for stronger signal confirmation
4. Monitor correlation angle for trend strength assessment
5. Use background color as quick visual cycle reference
Important Notes
• Signals are anti-repaint using confirmed previous bar values
• Best used in trending or cyclical markets
• Consider market context when interpreting signals
• Mathematical approach - not based on traditional TA concepts
Alerts Included
• Sine Wave Buy Signal: Triggered on wave bottom detection
• Sine Wave Sell Signal: Triggered on wave top detection
Technical Requirements
• Pine Script v6
• Works on all timeframes
• No external dependencies
• Optimized for performance
This is a free, open-source indicator. Feel free to modify and improve according to your trading needs!
Educational Value: Perfect for understanding how mathematical functions can be applied to market analysis and cycle detection.

NY/LDN/TOK Stock Exchange Opening HoursThis indicator displays vertical dotted lines marking the exact opening times of the three major global stock exchanges: New York (NYSE), London (LSE), and Tokyo (TSE). Perfect for traders who need to track market opening sessions across different time zones.
Features:
New York Stock Exchange (NYSE): 9:30 AM EST/EDT
London Stock Exchange (LSE): 8:00 AM GMT/BST
Tokyo Stock Exchange (TSE): 9:00 AM JST
Key Highlights:
✓ Automatic daylight saving time adjustments for NY and London
✓ Individual color customization for each market
✓ Toggle on/off functionality for each exchange
✓ Clean vertical dotted lines (1-pixel width) that extend across the entire chart
✓ Interactive legend in bottom-right corner showing active markets
✓ Weekdays only (Monday-Friday) - no weekend lines
✓ Uses official local time zones for accurate timing
Customizable Settings:
Enable/disable individual exchanges
Custom color selection for each market line
Dynamic legend that shows only enabled markets
Time Zone Handling:
The indicator automatically handles daylight saving time transitions using official time zones:
America/New_York (EST/EDT)
Europe/London (GMT/BST)
Asia/Tokyo (JST - no DST)
Perfect for:
Multi-market traders
Session overlap analysis
Global market timing coordination
Institutional trading schedules
Simply add to your chart and customize colors/visibility in the indicator settings. The legend will automatically update to show your active markets in their respective colors.
